Traffic Flow Maximization using Evolutionary Algorithm
Jiaxing Cui
Carnegie Mellon University 5000 Forbes Ave
Pittsburgh, PA
Quentin de Metz
Carnegie Mellon University NASA Ames Research Park
Mountain View, CA
ABSTRACT
Traffic Flow maximization is one of the crucial problems in de-signing a city. It directly affects the daily life of the people living in that city. It is a complex problem, one that in most cases cannot be deterministically solved. This paper proposes us-ing evolutionary algorithms to solve that problem. This paper compares existing work and traffic flow with solutions yielded by evolutionary approach, and the results show that it is bene-ficial to adopt this strategy when designing traffic light timings.
General Terms:
Evolutionary Algorithm, Artificial Intelligence
Keywords:
Evolutionary Algorithm, Traffic Light Optimization, FTGA, MTGA
1. INTRODUCTION
Traffic infrastructure comes in various forms, and optimizing traffic flow in road networks is a task that depends highly on the infrastructure. People commonly considers infrastructure as being in one of two categories: ”smart” infrastructure and ”legacy” infrastructure. The first makes use of detectors placed in the infrastructure to determine the state of traffic, whereas the second does not.
It is reasonable to assume that achieved solutions will perform better as a whole when making use of smart infrastructure. For example, a traffic light that can detect that there is no traffic from East to West, and that vehicles are waiting to go from North to South, can react accordingly and change its state to shorten the wait of these vehicles.
There have been projects in the past where traffic flow was optimized by combining real-time knowledge of traffic and communication between lights. The best-known of these projects is one spearheaded by Carnegie Mellon University in the East Liberty part of Pittsburgh, with excellent results.
However, this previous study’s approach relies heavily on smart traffic lights and detectors, which, although quite practical, are still far and few between throughout the world. In countries such as China or India, where the number of vehicles is growing most
rapidly, most roads are equipped with legacy traffic equipment. An effective approach to solving this problem should be applicable to the maximum amount of scenarios, which is why this paper dis-cusses only optimizing traffic light timings in a legacy environment. However, operating in a legacy environment does not mean that this paper must forgo all knowledge of the traffic flow. It is reasonable to assume that traffic flow can be measured at specific intersections. The collection of this data can unearth trends in the traffic flow (ie: rush hour traffic). Once this data is collected, any period of time can be split into different sections, where each of these sections has a different, but constant, traffic flow.
2. EXISTING RESEARCH
Researchers have come up with several different ways to optimize traffic lights in the past. Many studies have focused on adding sophisticated detectors at intersections, or on adding features to the traffic lights to leverage existing traffic theory results and artificial intelligence once the lights are capable of transmitting the state of the intersection to their neighbors. This approach is the one pursued by Ken Walters of Carnegie Mellon University and has produced good results [8].
Jansson used evolutionary algorithms to optimize traffic, but only in the context of one traffic light. He produced a microcontroller implementation for his simulator and his results state that his evolutionary approach yielded better results than a deterministic approach as soon as the problem reached a certain size [3]. Sanchez Medina has used evolutionary algorithms to evolve traf-fic light timings on several major streets throughout Spain. They implemented a Standard Genetic Algorithm based on truncation and elitism. Although their paper deals talks mostly about design-ing and programmdesign-ing a custom simulator, their conclusions state that they produced good (but not great) results during their experi-ments [5].
3. SIMULATORS
3.1 Simple Java Simulator
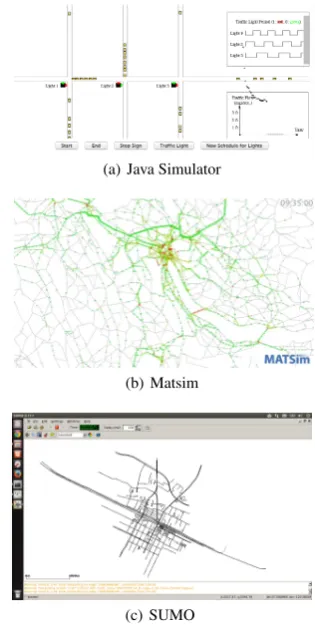
This Java simulator showed in Figure 1(a) can automatically gen-erate and plot. Another feature is the ability to to drag any car from one position to another. The simulator will automatically adjust the position of the car and continue. Furthermore, it is possible to ad-just in real-time the timings of traffic lights. For simple road net-works and light traffic flow, it is a great choice. However, in this kind of traffic network, there isn’t much to optimize, which is why this paper didn’t choose it as the final simulator.
3.2 MatSim
Matsim showed in Figure 1(b) is a powerful simulator which you can see from its simulated traffic networks. It is open source, which means that developers can modify it as they wish and adapt it closely to their needs. Also it provides and interactive visualizer which enables users to modify the traffic networks conveniently. At the same time, it provides detailed analysis which can be used by this paper.
3.3 SUMO
After comparing carefully among several different simulators, this paper finally chose SUMO [4] which was developed by employees of the Institute of Transportation Systems at the German Aerospace Center. Figure 1(c) shows how it looks like. It can handle complex situations and have a good perform even when the number of cars is very large. Also it can deal with collisions, acceleration and de-celeration.
4. SIMULATED TRAFFIC NETWORKS
In order to test the algorithm, this paper modeled the traffic network around the Caltrain station located in Mountain View, California. This choice was informed by the fact that it is a well-known inter-section among the peers and people have heard complaints about its long wait times. This paper investigated the traffic situation around the Caltrain station: during rush hour, and recorded the traffic flow as well as the traffic light timings. Figure 1(c) shows the traffic net-work around Caltrain Station.
5. FITNESS FUNCTION
In order to best simulate the real world traffic light, Several ways have been tried to establish the mapping between real world traffic measurement with the fitness function in the evolutionary algorithm of this paper. The following are the fitness function that have been tested in this paper.
5.1 Average Speed
The first fitness function designed was the average speed of the vehicles in the network. This is an intuitive metrics, in that if the average speed of a traffic network is larger than that of another, then the result can be expected that its traffic flow to be equally larger. This paper used this fitness function when testing the algorithms in the grid traffic network.
However, this fitness function did not fit well with the simulator this paper were using. Indeed, the SUMO simulator had no easy means of recovering the average speed of a vehicle at a given time. In the above experiment this paper had resorted to placing detectors at specific places along the network; these detectors could measure the velocity of vehicles passing next to them (think of them as speed
(a) Java Simulator
(b) Matsim
[image:2.595.355.513.66.386.2](c) SUMO
Fig. 1. Simulators
radars). Whereas this approach worked well in a simple traffic net-work, placing a number of detectors along multiple roads in a real-world, intricate network was a tedious task. Furthermore, the fitness function was not detector-location agnostic, which means that the placement of the detectors directly impacted the fitness values that this paper measured, and in turn could greatly impact the results of the algorithms. Finally this paper decided to move on to a simpler fitness function.
5.2 Throughput
When modelizing the traffic flow in the simulator, this paper created many different routes that the vehicles would use. When the simulator placed a new vehicle in the network, it chose an a path for the vehicle from within a list of predetermined paths that this paper had decided upon. It made sense to evaluate how many vehicles were making it to their destination in the fixed, allocated time that the simulation was running in, and this paper chose this as a metric for the fitness function. Intuitively, it is related to the throughput of the traffic network.
6. ALGORITHMS
6.1 Simple GA
6.1.1 Overview. The first algorithm which this paper imple-mented was the Simple Genetic Algorithm [1] [7]. This textbook [2] algorithm is made of several components, among which the fol-lowing:
—Parent Selection —Recombination —Mutation —Survivor Selection
Each of these components can be implemented in different ways and will give the algorithm a unique behavior. Furthermore, these components make use of constants that can be tweaked (muta-tion rate, parent popula(muta-tion size), just as the algorithm’s parameters (population size, number of rounds). Tuning these values will also change the behavior of the algorithm.
The implementation contains the following components:
—Parent Selection: Rank-based selection, Stochastic Universal Sampling
—Recombination: Single Point Crossover
—Mutation: Simple Mutation: replacing one traffic light by a ran-domly generated traffic light
—Survivor Selector: Rank-based selection, Stochastic Universal Sampling
The genotype this paper used was the following:
(Light1, Light2, Light3, Light4) (1) Where each light is represented as follows:
Light1= (t1, t2, t3, t4) (2) Wheretirepresents the timing of the light for its first phase.
After some initial parameter tweaking, the first batch of pa-rameters used was:
—Population size: 20
—Number of rank-selected parents: 6 —Number of offspring created: 6 —Mutation of one out of the six offspring
—Selection of the top 20 individuals from the new population to form the basis for the next generation
6.1.2 Issues encountered. The major encountered with this algorithm was premature convergence. The initial version reached a local optimum in less than ten generations, and did not budge afterwards. This usually means that the algorithms was lacking in diversity maintenance mechanisms. At first, this paper decided to ensure that the population’s worst individual was always maintained from one round to another. This by itself did not bring about an important improvement.
It is then decided to systematically remove the best individual from the population. The combination of these two modifications al-lowed us to notice that the algorithm continued to improve on a steady basis, even after the ten first rounds. The algorithm was ex-ploring more of the search space thanks to the increased diversity of its population.
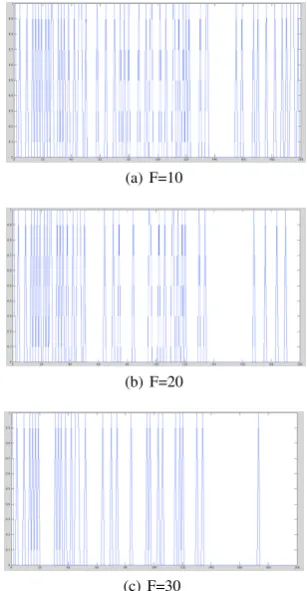
(a) F=10
(b) F=20
[image:3.595.359.513.66.362.2](c) F=30
Fig. 2. Different Factor
6.2 Simulated Annealing
6.2.1 Overview. In order to find the global optimum, this paper tried another algorithm which is called Simulated Annealing [6]. The basic idea of this algorithm is to simulate the process of an-nealing. At the beginning, a high temperature is used, in which the acceptance probability of individuals with bad fitness is high. Then temperature goes down slowly. The acceptance probability goes down as well. The way this paper encode the algorithm is as follows:
T1, T2, T3, T4 (3) Here T1, T2, T3, T4 represents the four traffic lights measured around Caltrain Station respectively. The neighbor function used is to randomly choose a gene in the individual and replace it with a new one. The function for calculating acceptance rate is:
1 1 +e∆F
T
(4)
Figure 2 is the result for using different scale factors. X-axis rep-resents time and y-axis reprep-resents acceptance of bad individuals.
can be divided into several different traffic flows microscopically, it is not possible for SA to find the global optimum.
6.3 Mutable Time-interval Genetic Algorithm (MTGA)
The initial assumption was to work on time intervals during which the traffic flow is constant. However, after many simulations, what is realized is that even in a situation where the overall traffic flow is constant, the interaction between intersections and traffic lights creates a somewhat chaotic system where traffic flow at specific intersection can vary quite a bit.
It became clear that better results can be achieved by further di-viding the time intervals into smaller sub-intervals. This paper de-signed a new algorithm, in which the individuals also contain in-formation about how to split the time interval: the Mutable Time-interval Genetic Algorithm (MTGA). It is a sort of Genetic Algo-rithm, and has the following features which will be explained later. —Hybrid Gene Type.
—No Crossover —Special Mutation Type
The first and most important feature of MTGA is that it has a hybrid gene type. Below is how this paper encode the chromosome.
T1,1. . . T1,4, T2,1. . . T2,4. . . Tn,1. . . Tn,4, I1. . . In (5)
In the above equation, the a in the subscript ofTa,brepresents the
time for the ath time interval and b represents the bth phase of a traffic light. For simplicity, in the example, only 1 traffic light is used. This traffic light has 4 phases which is the reason that b can be 4 at max. And the whole time interval is subdivided that the algorithm can be optimized in into sub regions.I1, I2, ...represents the length of each phase respectively. One thing that needs to be mentioned is that the sum ofI2, I2, ...should be a fixed constant which represents the length of the time interval where the algorithm can be estimated. It can be expressed like this:
I2+I2+I3+...+In=T (6)
where T represents the time interval between start time and end time.
Another important feature is that you cannot really perform crossover in MTGA although they align with each other very well. The reason comes from its special chromosome. Because people usually want to optimize the traffic light for a fixed time interval, therefore,I1+I2+...+Inhas to be fixed to the length of the
time interval. If crossover is performed between two individuals, the sum of these numbers will change. Although there is a way to perform crossover between two individuals, this feature isn’t added into the algorithm.
The last feature is that special mutation has to be performed in MTGA. In the first part of the chromosome, normal mutation can be performed. However as stated above, at least two genes have to be changed together because of equation 6. For example,I1 needs to be changed. Assumption can be made that, previously,
I1 = 40, I2 = 40, I3 = 100. If such mutatioin has to be make like changingI1from 40 to 20. It can results in setI1= 20. How-ever, the following operations have to be made, eitherI2 = 60or
I3= 120as well in order to keep consistent to equation 6.
6.4 Fixed Time-interval Genetic Algorithm (FTGA)
Based on the above algorithm, this paper came up with a modified version of the MTGA: the Fixed Time-interval Genetic Algorithm (FTGA). The simple idea is to get rid ofI1, I2, ..., In which are
encoded in equation6. This paper decides to split the time interval into a number of equal-length sub-intervals:I1 =I2 =...=In.
This means that there is no need to store the intervals in the chromo-somes anymore. The chromosome’s representation is the following:
T1,1. . . T1,4, T2,1. . . T2,4. . . Tn,1. . . Tn,4 (7) By limitingTa,bto a certain domain such as (1,100), there is even
no need to perform the special mutation either. What can be done with normal Genetic Algorithm can be applied to this chromosome as well. And another important feature that FTGA has is that it has fewer parameters which means it takes a shorter time to get the result.
7. EXPERIMENT & RESULT
7.1 Experiment Setup
During these experiments, the algorithm fixed the population size of SGA, FTGA and MTGA to 20 and the number of offspring size to 6 which means that during each generation, evaluation has to be performed for 26 individuals. This paper fixed the number of generations to 40. And 40 random number sequences is choosen to evaluate these algorithms. Therefore, with 1 random number sequence,40∗26 = 1040individuals have to be evaluated. And this paper run each algorithm 40 times.
In order to measure the performance of all these algorithms, this paper fixed the traffic flow, number of simulation step, and the to-tal number of cars input into the simulator. Therefore, exactly the global optimum of this problem is known and this paper try to find out whether each algorithm can achieve it.
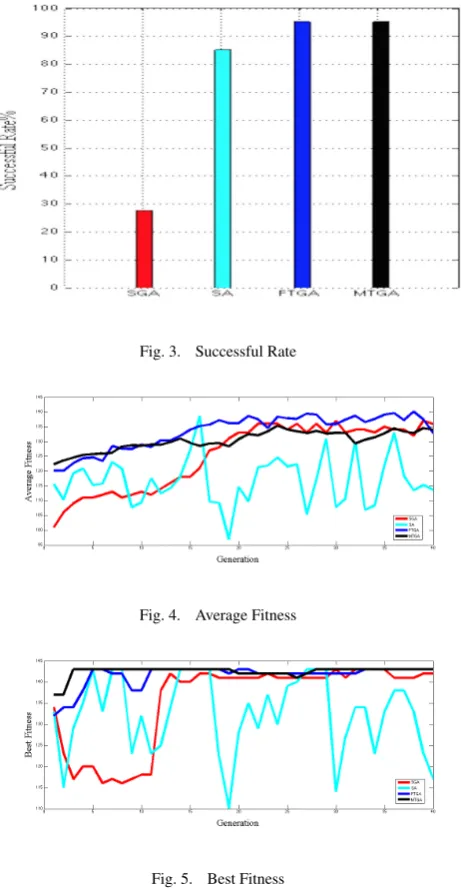
7.1.1 Successful Rate. Figure7.1.1shows the successful rate of each algorithm. This paper define the success of an algorithm as equation 8
IFbest fitness = global optimum RETURN True
ELSE
RETURN False
(8)
According to the experiment setup stated before, this paper counted the number of successes for each algorithm and plotted them in Figure7.1.1
Fig. 3. Successful Rate
Fig. 4. Average Fitness
Fig. 5. Best Fitness
7.1.3 Best Fitness. Besides average fitness, this paper measured the best fitness during the process. Figure7.1.3shows the result of this experiment. It can be seen that even the average fitness of MTGA may be lower than FTGA, it is more likely to get the global optimum since it is a more precise representation of the problem. SGA tends to behave badly in the beginning. As time goes by, the best fitness it can achieve increases dramatically. SA can achieve its best fitness at any time during its process and it is hard to predict.
8. CONCLUSION & FUTURE WORK
8.1 Conclusion
[image:5.595.348.527.71.140.2]Having investigated a lot work done by others, this paper found out that almost all of them are based on traditional methods which treat the time interval as a whole. It is a trivial way to solve the problem since EA can deal with this situation perfectly with the unnecessary constraint that the time interval cannot be subdivided.
Table 1. Performance of Algorithms Algorithm Maximum Fitness Success Times
Original 123 N/N
SGA 143 11/40
SA 143 34/40
FTGA 143 38/40
MTGA 143 38/40
Actually, when it comes to real-world, unpredictable accident happens. Therefore, these factors can affect the traffic flow from time to time. Human beings may not find the subtle difference easily. However, properly designed algorithms are able to find them out.
SGA and SA represent two kinds of traditional algorithms that treat the time interval this paper wants to optimize as a whole. They showed some ability to improve the traffic flow. However, they reach their bottlenecks easily. In some scenarios, they can never get the global optimum.
FTGA and MTGA are specially designed for subdividing the whole time interval into sub-regions. Therefore, they both have the ability to improve the max fitness that SGA and SA and achieve. Although they use different approaches to divide the time interval, they turned out to be feasible to find the global optimum.
According to the result from table 1, it can be seen that, SGA and SA can optimize the traffic to a certain extent. Although SGA and SA and achieve the global optimum at times, they are not guaran-teed to find ti. As FTGA and MTGA have the ability to subdivide the whole time interval into smaller ones, they can further improve the traffic timing. Therefore, they are more likely to find the global optimum. Also, this paper have stated that FTGA is a simplified version of MTGA. However, it behaves almost as well as MTGA. And it is much easier to implement.
8.2 Future Work
In this paper, it is presented that FTGA and MTGA work better than SGA and SA to optimize the traffic network around Caltrain Station. In the future, these two algorithm be further tested on other traffic networks and traffic flows to see how these algorithms per-form. And due to the computational cost, this paper has only en-coded the timing of 1 traffic light in FTGA and MTGA. More traf-fic lights will be tried to be encoded into the chromosome to test their ability to find the global optimum.
9. ACKNOWLEDGMENTS
We take this opportunity to express the profound gratitude and deep regards to our teacher Professor Jason D Lohn, Associate Research Professor in the Dept. of Electrical and Computer Engineering in Carnegie Mellon University, for his exemplary guidance, monitor-ing and constant encouragement throughout this report. We also thank Irina Brinster, full-time PhD in Carnegie Mellon University, for her technical support and valuable information, which helped us in completing this project through various stages.Thanks also go out the the developers of the SUMO simulator.
10. REFERENCES
Morgan Kaufmann San Francisco, 1998.
[2] Agoston E Eiben and James E Smith.Introduction to evolu-tionary computing. springer, 2003.
[3] Gustaf Jansson. Traffic control with standard genetic algo-rithm, 2010.
[4] Daniel Krajzewicz, Jakob Erdmann, Michael Behrisch, and Laura Bieker. Recent development and applications of SUMO - Simulation of Urban MObility.International Journal On Ad-vances in Systems and Measurements, 5(3&4):128–138, De-cember 2012.
[5] Javier J Sanchez Medina. Evolutionary computation applied to urban traffic optimization, 2008.
[6] Peter JM Van Laarhoven and Emile HL Aarts.Simulated an-nealing. Springer, 1987.
[7] Michael D Vose.The simple genetic algorithm: foundations and theory, volume 12. MIT press, 1999.