25
An Efficient Technique for Detection of Flooding and
Jamming Attacks in Wireless Sensor Networks
Shikha Jindal
Research scholar, Master of Technology Department of Computer Engineering
Punjabi University Patiala
Raman Maini
ProfessorDepartment of Computer Engineering Punjabi University Patiala
ABSTRACT
Distributed denial of service attacks are a major threat for wireless sensor network. The aim of these attacks is that genuine users can not use network such as bandwidth, computing power and operating system data structures. Jamming and flooding attacks are one of the most popular attacks on WSN which cause DDoS. There is a requirement for the detection of these attacks rapidly and perfectly. For detection of these attacks, this paper suggests an efficient method. This method provides improved performance over the existing methods. The method is simulated using NS2 simulator. It has been concluded that this efficient method performs better in terms of energy, delay, throughput, packet loss and packet delivery ratio.
Keywords
Distributed Denial of service, flooding, jamming, security, wireless sensor networks
1.
INTRODUCTION
Wireless sensor networking remains one of the most demanding and rising research domains of our time. A Wireless Sensor Network (WSN) is a collection of autonomous nodes, which communicates in wireless medium with small frequency and bandwidth consumption [1]. Sensor networks hold a very well-known position in technology history because they provide low cost solutions to a variety of applications such as scientific examination, data collection and monitoring and military applications. Each node can find out the neighbor nodes in the network and this helps in construction of routes in the collection. Due to some weaknesses like limited processing capability, memory, and because of the broadcast transmission medium Wireless Sensor Networks are mostly susceptible to Denial of Service attacks. These attacks diminish the capability of WSN, so that they cannot work for a long time. It mostly effects on resource consumption of network and increases the energy consumption, delay, and reduces the throughput [2].
Wood and Stankovic define DoS attack as “any event that diminishes or eliminates a network’s capacity to perform its expected function” [3].
A Denial of Service (DoS) attack is an attack with the purpose that genuine users are unable of using a particular network resource which can be a website and whole system. A Distributed Denial of Service (DDoS) attack is a synchronized attack which is done on the availability of services of some particular network with the help of compromised computing systems indirectly, so that tracking the DDoS control packets becomes more difficult. [4].
[image:1.595.313.563.362.589.2]Name of nodes which are used in performing DDoS attacks are attacker, master, zombies, victim [5]. These are explained in Table I
Table I: Role of DDoS attack nodes
Name of node Role of DDoS attack nodes
Attacker Attacker who is the main controller and gives commands directly to the master.
Master Master receives command from attacker and instructs zombies which are under control. Zombie They are handled by master and they work
according to the command came from master and execute the attack.
Victim At the end, Victims are concurrently attacked by several hosts.
As compared to Internet, Denial-of-Services attacks in WSNs are different. Sensor networks are usually divided into layers, and due to this layered design of WSN, they are susceptible to different DoS attacks because DoS attack can be occur at any layer of network [6].
The aim of this paper is to discuss two common types of DoS attacks i.e. flooding and jamming attacks. Jamming attack occurs at physical layer of sensor network whereas flooding attack occurs at transport layer of sensor network.
Flooding attack is a type of Denial of service (DOS) attack and can exhausted all network resources such as bandwidth, energy and computing power etc [7].
Jamming attacks are also kind of DoS attacks and these attacks mainly exhaust the energy. In this attack, attacker deploys the jammers in some particular area with the purpose to jam the area, so that sending and receiving of messages is stopped. The jammers disturb the communication between sensor nodes or start on the radios frequency so that they interfere with open wireless medium. A jammer prevents the sender from sending messages and receiver from receiving messages [8]. Jamming signals are purposely sent so that communication link between sensor nodes is destroyed, whereas radio frequency intervention is un-intentionally sent because this can be due to some frequency planning errors [9].
This paper is described as follows: In section II we have done a related work survey on some existing methods of flooding and jamming attack. In section III we discuss about transport layer attack i.e. flooding attack and in section IV physical layer attack i.e. jamming attack. Section V discusses the efficient method used to detect flooding and jamming attack along with its algorithm. Section VI covers the results of implementation of efficient method for both attacks.
2.
RELATED WORK
A number of previous works has been done for detecting flooding and jamming attacks.
In 2005, P. Yi et al. [10] , proposed a simple method so that flooding attacks can be prevented. In this method, each node monitors and calculates the request rate of neighborhood nodes. Now when the request comes it compares the request rate of neighbor node with the predefined threshold. If it exceeds, then node records the ID of that node in a list. In future if any request comes from the node stored in the list, is rejected.
In 2005, Desilva et al. [11] , proposed a technique which is based on statistical analysis so that we can detect the malicious RREQs from authenticated RREQs. Similar to [10], in this approach, each node monitors the RREQ received from the neighbor nodes and made a record of count of RREQs which are received from sender nodes for a fixed interval. Now when the RREQs received from sender then its rate is compared with the stored count. If it exceeds, then the request packet is dropped without forwarding. In 2014, S. T. et al. [12] , proposed a profile based technique which is used to detect and cut off the flooding attack on MANET using Adhoc on Demand Distance Vector (AODV) routing protocol. In this technique each node has a profile value. These profile values are set on the base of behavior of MANET. Whenever the node tries to exceed the defined threshold value, the attack will be recognized and isolated. The main benefit of this technique is that threshold value is not fixed; it is based on the average request allowed in the network which varies with the number of requests in the network.
In 2003, Wood et al. [13], represented a novel mapping service to detect jamming attacks. JAM (Jamming Area Mapping) is a service that provides rapid and exact jamming attack response. With the help of this mapping service, we get the geographic information which tells us about the jamming region. In this technique special extra hardware is not required which makes it cost effective.
In 2013, Babar et al. [14], represented the game theoretic model of the jamming attack. This paper proposed a game theory based detection technique which is used to detect all types of jamming attack. This method gives better performance in terms of energy, delay and throughput also.
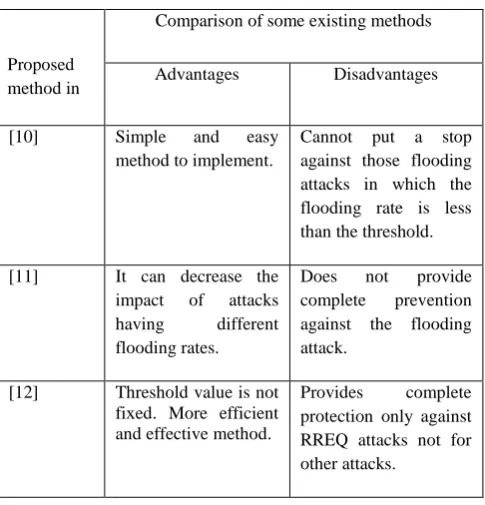
In 2012, Liu et al. [15] , propose a novel two-phase jamming detection scheme for sensor networks. In first phase, some symptoms of jamming are identified quickly. When symptoms are found then second phase of detection is applied. In this technique we don’t need any extra communication or hardware. Comparisons of all above methods are explained in table II.
TABLE II: Comparison of some existing methods
Proposed method in
Comparison of some existing methods
Advantages Disadvantages
[10] Simple and easy
method to implement.
Cannot put a stop against those flooding attacks in which the flooding rate is less than the threshold.
[11] It can decrease the impact of attacks having different flooding rates.
Does not provide complete prevention against the flooding attack.
[12] Threshold value is not fixed. More efficient and effective method.
[image:2.595.305.548.498.751.2]27 [13] Does not require extra
hardware, thus implementing JAM is cost effective.
As in some cases, no single group, or map is achieved.
[14] Shows better energy consumption, throughput, and delay in different practical situations of network.
Cannot used to detect cluster head jamming attack.
[15] This scheme is both efficient and timely.
Small scale
experiment.
3.
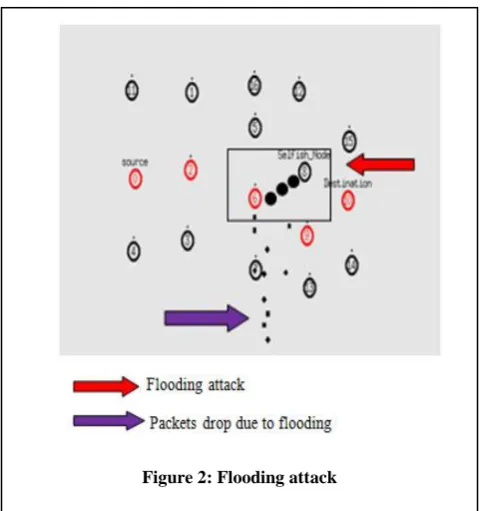
FLOODING AND JAMMING ATTACK
3.1
Flooding attack
The main aim of Flooding attack is to consume network resources such as bandwidth, computational resources and battery power so that network performance goes down and genuine user cannot use network resources [16].
Flooding Attack can be start by flooding the network with forged RREQ or data packet due to which network is completely jammed and the possibility of data broadcast of the authentic node is decreased [7].
3.1.1
RREQ flooding
In this type of flooding attack, the attacker transmits many RREQ packets for the node which can be exist or not in the network. To execute RREQ flooding the intruder increase the RREQ rate which consumes network bandwidth and stop genuine users from using it [7].
For example, in AODV protocol, attacker node sends RREQs in large amount in a small duration to a node which does not exist in the network. These RREQs are sent for the node which do
es not exist in the network so no one will respond to the RREQs. So these RREQs will flood the entire network with request packets. As a result, all of the network resources battery power will be used up and this consumption could lead to denial-of-service [16].
3.1.2
Data flooding
In Data flooding data packets are used to flood the network. In this flooding attack, attacker node firstly builds a path to all the other nodes in the network and then send the excessive amount of forged data packets and this forged data packet fail the network resources so that no one can use them and it will very hard to detect [7]
3.2
Jamming attack
The purpose of jamming attack is to fill up the communication channel with useless signals, due to which authenticated or legitimate user cannot use it. Jamming retards the sending and receiving of messages at the destination. It is very hard to prevent and detect the jamming attacks but still some detection algorithms are trying to prevent the possibilities of jamming attack. But the new attacks are able to overcome these detection algorithms. Another purpose of Jammers is to hide themselves from the detection algorithms so that they can proceed with jamming of some particular region. [17].
4.
EFFICIENT METHOD TO DETECT
FLOODING AND JAMMING ATTACK
This method is used to detect flooding and jamming attack. In flooding attack this method can detect the malicious node sending fake packets or request to flood the network. In jamming attack this method can detect the jammer nodes which stops the sending or receiving of packets in a particular area. For simulation first of all some finite number of nodes are deployed in fixed area. Then path is established according to AODV protocol.
[image:3.595.52.296.69.254.2]After finding paths shown in figure 5 source will choose the best shortest path for sending packets or requests to destination.
[image:3.595.54.296.342.598.2]28
Figure 4: Different paths for sending data
[image:4.595.296.546.112.474.2]Source can verify the route by sending fake message. There is one node which is present at the outside of the network. This is malicious node which is continuously sends packet on the route. Due to this network is exhausted and packet drop problem occurs or some particular area can be jammed. To remove this problem monitor nodes will be used. To isolate the attack first of all source flood ICMP packets to the network. Nodes which receive ICMP packets go to the monitor mode.
Figure 5: Nodes in monitor mode
One node which is adjacent to the malicious node detects malicious node and send message to source to isolate the path.
Figure 6: Isolated path
Now source isolate the path and other path will be chosen for communication.
Algorithm
Start ( )
5.
PERFORMANCE EVALUATION
[image:4.595.61.285.384.523.2]To analyze the effect of flooding and jamming attack AODV routing protocol is used. Our aim is to recognize the attacker node that flood the network with RREQ packets. Simulation is carried out in NS2 simulator with 17 nodes in the network. Simulation is performed to show the flooding and jamming attack and after that detection is done using efficient method. Some other parameters are shown in table III.
Table III: Simulation parameters
Name Simulation parameters
Protocol AODV
Simulator NS-2
Simulation area 800m×800m
Channel type wireless
Number of sensor nodes
17
MAC type Mac/802_11
Attacker nodes 1
The metrics are the main determinants which are used to check network performance. With the help of metrics we can evaluate
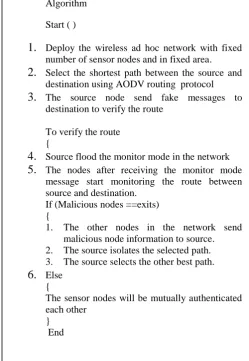
Algorithm
Start ( )
1.
Deploy the wireless ad hoc network with fixed number of sensor nodes and in fixed area.2.
Select the shortest path between the source anddestination using AODV routing protocol
3.
The source node send fake messages todestination to verify the route
To verify the route {
4.
Source flood the monitor mode in the network5.
The nodes after receiving the monitor modemessage start monitoring the route between source and destination.
If (Malicious nodes ==exits) {
1. The other nodes in the network send
malicious node information to source. 2. The source isolates the selected path. 3. The source selects the other best path.
6.
Else{
The sensor nodes will be mutually authenticated each other
} End
Flooding Attack:
In this type of attack first of
all, Nodes are deployed in the network with
finite number of nodes. Path is established
according to AODV protocol. There is one
node which is present at the outside of the
network. This is malicious node which is
continuously sends packet on the route. Due to
this network jam and packet drop problem
occurs. To remove this problem monitor nodes
will be used.
To isolate the flooding attack first
[image:4.595.57.278.588.732.2]29 the performance of the efficient scheme. We choose five main
metrics to evaluate the performance of our efficient schemes namely energy spent, delay, throughput, packet delivery ratio and packet loss.
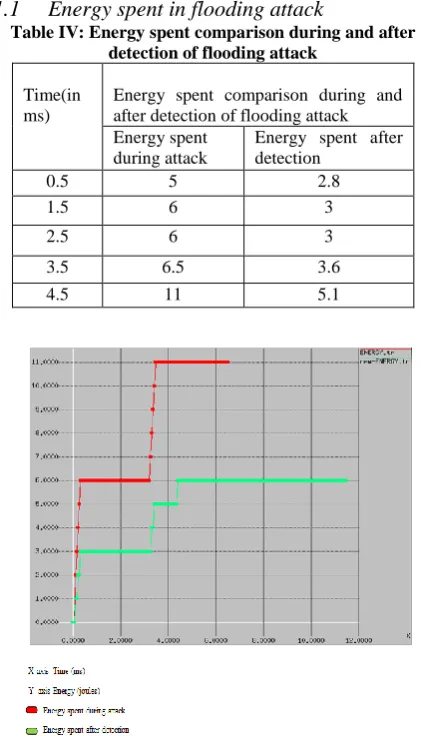
5.1
Energy spent
Average energy spent by the sensor nodes in the network is one of the important metrics to evaluate the energy efficiency of routing protocol. In flooding attack, due to the presence of an attacker there is no successful transmission. Due to that, energy spent is the highest.
[image:5.595.324.531.67.284.2]5.1.1
Energy spent in flooding attack
Table IV: Energy spent comparison during and after detection of flooding attack
Time(in ms)
Energy spent comparison during and after detection of flooding attack Energy spent
during attack
Energy spent after detection
0.5 5 2.8
1.5 6 3
2.5 6 3
3.5 6.5 3.6
4.5 11 5.1
Figure 7: Energy spent graph for flooding attack of table IV
[image:5.595.66.277.201.573.2]5.1.2
Energy spent in jamming attack
Table V: Energy spent comparison during and after detection of jamming attack
Time (in ms)
Energy spent comparison during and after detection of jamming attack Energy spent
during attack
Energy spent after detection
0.5 4.3 1.9
1.5 6 2
2.5 6 2
3.5 6.8 2.7
4.5 11 3
Figure 8: Energy spent graph for jamming attack of table V
5.2
Delay
It is the total time taken for the packet to reach from source to destination and it is measured in seconds.
[image:5.595.335.548.408.732.2]Delay = Arrive time- Send time
5.2.1
Delay in flooding attack
Table VI: Comparison of delay during and after the detection of flooding attack
Time (in ms)
Comparison of delay during and after the detection of flooding attack
Delay during attack
Delay after detection
0.5 0 0.5
1.5 0 1
2.5 0 1
3.5 1.4 1.2
4.5 4 2
[image:5.595.57.290.639.749.2]5.2.2
Delay in jamming attack
Table VII: Comparison of delay during and after the detection of jamming attack
Time (in ms)
Comparison of delay during and after the detection of jamming attack
Delay during attack
Delay after detection
0.5 3.2 1.7
1.5 6 2
2.5 6 2
3.5 6.8 2.6
4.5 11 3
5.3
Throughput
The throughput represents the ratio of numbers of data packets sent by the source node to the number of data packets received by the destination.
Throughput = No. of data packets sent No. of data packets received
5.3.1 Throughput in flooding attack
Table VIII: Comparison of throughput during and after the detection of flooding attack
Time (in ms)
Comparison of throughput during and after the detection of flooding attack
Throughput during attack
Throughput after detection
0.5 0 0
1.5 0 0
2.5 0 0
3.5 0.8 4
4.5 5 15
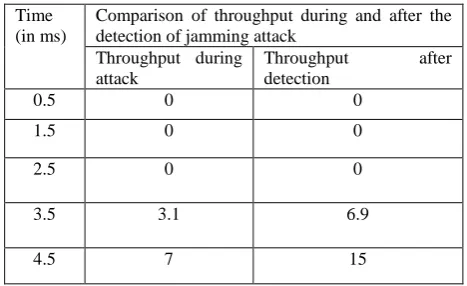
5.3.2
Throughput in jamming attack
Table IX: Comparison of throughput during and after the detection of flooding attack
Time (in ms)
Comparison of throughput during and after the detection of jamming attack
Throughput during attack
Throughput after detection
0.5 0 0
1.5 0 0
2.5 0 0
3.5 3.1 6.9
[image:6.595.68.550.94.554.2]4.5 7 15
[image:6.595.69.304.119.531.2]Figure 11: Throughput graph for flooding attack of table VIII
[image:6.595.315.549.601.744.2]Figure 8: Throughput graph for flooding attack
Figure 8: Throughput graph for flooding attack
31
Figure 12: Throughput graph for jamming attack of table IX
5.4
Packet Delivery ratio
The packet delivery ratio is the ratio of number of packets received at destination node to that of number of packets sent by the source node.
[image:7.595.311.537.116.492.2]Packet delivery ratio = No. of packets receive No. of packets send
5.4.1 Packet Delivery ratio in flooding attack
Table X: Comparison of packet delivery ratio during and after the detection of flooding attack
Time (in ms)
Comparison of packet delivery ratio during and after the detection of flooding attack Packet delivery
ratio during attack
Packet delivery ratio after detection
0.5 0 0
1.5 0 0
2.5 0 8.9
3.5 4.4 19.1
4.5 12.2 26
Figure 13: Packet delivery ratio for flooding attack of table X
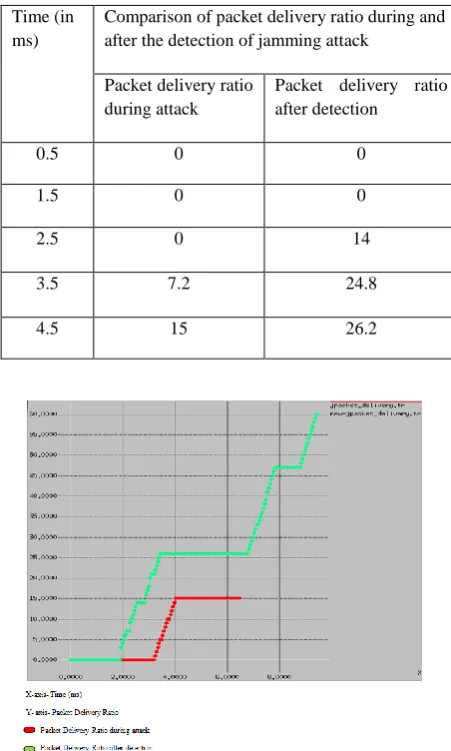
5.4.2
Packet Delivery ratio in jamming attack
Table XI: Comparison of packet delivery ratio during and after the detection of jamming attack
Time (in ms)
Comparison of packet delivery ratio during and after the detection of jamming attack
Packet delivery ratio during attack
Packet delivery ratio after detection
0.5 0 0
1.5 0 0
2.5 0 14
3.5 7.2 24.8
4.5 15 26.2
Figure 14: Packet delivery ratio for jamming attack of table XI
5.5
Packet loss
Total number of packets dropped in the network.
Packet loss = Number of packet send – Number of packet received
5.5.1
Packet loss in flooding attack
Table XII: Comparison of packet loss during and after the detection of flooding attack
Time (in ms)
Comparison of packet loss during and after the detection of flooding attack
Packet loss during attack
Packet loss after detection
0.5 0 0
1.5 0 0
2.5 9.9 6.9
3.5 22.4 11.8
[image:7.595.63.282.373.708.2]Figure 15: Packet loss in flooding attack of table XII
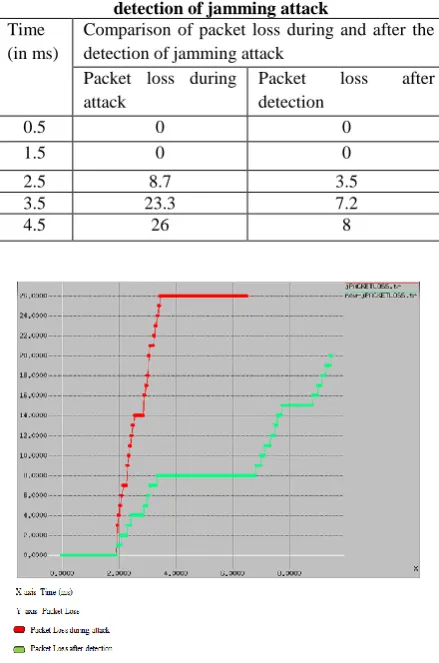
[image:8.595.62.282.320.652.2]5.5.2
Packet loss in jamming attack
Table XIII: Comparison of packet loss during and after the detection of jamming attack
Time (in ms)
Comparison of packet loss during and after the detection of jamming attack
Packet loss during attack
Packet loss after detection
0.5 0 0
1.5 0 0
2.5 8.7 3.5
3.5 23.3 7.2
4.5 26 8
Figure 16: Packet loss for jamming attack of table XIII
6.
CONCLUSION
Wireless Sensor Networks are generally used in different fields for data monitoring purposes. They are useful in mainly civilian, industrial and scientific applications. So it is necessary to detect flooding and jamming attacks quickly because these attacks cause DDoS on WSN. This paper suggests an efficient method for detection of these attacks. In this method monitor modes are used to isolate the malicious path. To isolate the attack source flood ICMP packets in the network. Nodes which receive ICMP packets go to the monitor mode. One node which is adjacent to the malicious node detects malicious node and send message to source to isolate the path. Now source isolate the path and other path will be choose for communication.
The scheme has been evaluated using the simulator NS-2. The result of our implementation show better impact to overcome flooding and jamming attack. This technique significantly improves system performance and we find that the method introduced is efficient because it detect both flooding and jamming attack with less delay, less energy spent, more throughput, less packet loss and more packet delivery ratio. In the future, following issues can be studied. First, this approach is still used on a small- scale. It would be interesting to see that how it works on a large-scale deployment. Second, the cost can be reduced by suspiciously selecting the detection nodes i.e. it is not essential to use all nodes in the detection process. Only one alert from them is needed for detecting the attack.
7.
ACKNOWLEDGMENT
The authors would like to acknowledge the Department of Computer Engineering, Punjabi University Patiala, for the facilities provided during this research.
8.
REFERENCES
[1] D. Boyle, T. Newe “Securing Wireless Sensor Networks: Security Architectures” in journal of networks, VOL. 3, NO. 1, JANUARY 2008
[2] H. B. Hubboub “Denial of Service Attack in Wireless Sensor Networks” library.iugaza.edu.ps/thesis/92125.pdf
[3] A. D. Wood and J. A. Stankovic, “Denial of Service in sensor networks”, Computer, vol.35, no.10, pp.54-62, 2002 [4] S. M. Specht, R. B. Lee “Distributed Denial of Service:
Taxonomies of Attacks, Tools and Countermeasures” in Proceedings of the 17th International Conference on Parallel and Distributed Computing Systems, 2004 International Workshop on Security in Parallel and Distributed Systems, pp. 543-550, September 2004
[5] J. H. Jun, H. Oh, S. H. Kim “DDoS flooding attack detection through a step-by-step investigation” Published in Networked Embedded Systems for Enterprise Applications (NESEA), 2011 IEEE 2nd International Conference on [6] O. Xi , T. Bin , L. Qi , Z. J. yi , H. Z. Ming , X. Yang “A
Novel Framework of Defense System Agaist DoS Attacks in Wireless Sensor Networks” in Wireless Communications, Networking and Mobile Computing (WiCOM), 2011 7th International Conference.
[7] R. Meher, S. Ladhe “Review Paper on Flooding Attack in MANET” in Int. Journal of Engineering Research and Applications, ISSN : 2248-9622, Vol. 4, Issue 1( Version 2), January 2014, pp. 39-46
33 International Conference on Parallel, Distributed and Grid
Computing
[9]J. A. Jahanshahi, S. A. Ghorashi, and M. Eslami “A Support Vector Machine based Algorithm for Jamming Attacks Detection in Cellular Networks” in Wireless Advanced (WiAd), 2011
[10] P. Yi et al., “A New Routing Attack in Mobile Ad Hoc Networks,” Int’l. J. Info. Tech., vol. 11, no. 2, 2005. [11] S. Desilva, and R. V. Boppana, “Mitigating Malicious
Control Packet Floods in Ad Hoc Networks,” Proc. IEEE Wireless Commun. and Networking Conf., New Orleans, LA, 2005.
[12] Sathish. T, Sasikala. E” Dynamic Profile Based Technique to Detect Flooding Attack in MANET” in International Journal of Innovative Research in Computer and Communication Engineering Vol.2, Special Issue 1, March 2014
[13] A. D. Wood, J. A. Stankovic, and S. H. Son “JAM: A Jammed-Area Mapping Service for Sensor Networks”
Proceedings of the 24th IEEE International Real-Time Systems Symposium (RTSS’03), IEEE, 2003.
[14] S. D. Babar, N. R. Prasad, R. Prasad “Game Theoretic Modelling of WSN Jamming Attack and Detection Mechanism” Published in Wireless Personal Multimedia Communications (WPMC), 2013 16th International Symposium on
[15] D. Liu, J. Raymer, A. Fox “Efficient and Timely Jamming Detection in Wireless Sensor Networks” in 9th International Conference on Mobile Adhoc and Sensor Systems MASS, page 335-343. IEEE Computer Society, (December 2012)
[16] R. Choubey, S. Sahu, R. S. Dubey, S. Dubey “Flooding Attack Prevention Algorithm in AODV Protocol for Mobile Ad-hoc Network” in International Journal of Science and Advanced Technology, Volume 1 No 6 August 2011 [17] A. Mummoorthy , S. S. Kumar “A Detailed Study on the
Evolution of Recent Jammers in Wireless Sensor Networks” in International Journal of Engineering Research and Development Volume 4, Issue 6 (October 2012), PP. 12-15
![Figure 1: Structure of DDoS attack [5]](https://thumb-us.123doks.com/thumbv2/123dok_us/8037782.770618/1.595.313.563.362.589/figure-structure-of-ddos-attack.webp)