© 2016, IRJET | Impact Factor value: 4.45 | ISO 9001:2008 Certified Journal | Page 1499
Performance Based Evaluation Of Response Reduction Factor For
Elevated Rectangular Water Tank
Roja M
1, T.S Sahana
2, Dr Naveen G M
3, Sagar S
41ROJA .M, PG Student,Department Of Civil Engineering,SSIT Tumukur,Karnataka,India 2T.S. SAHANA, Assistant professor,Department Of Civil Engineering, SSIT Tumukur,Karnataka,India 3Dr. Naveen G .M, Assistant Professor,Dept Of Civil Engineering,GEC Chamarajanagar,Karnataka,India 4SAGAR .S, Assistant professor,Department Of Civil Engineering,MITE Mudabidre,Karnataka,India
***Abstract
-Earthquakes are one of the most dangerous natural hazards causing damage and collapse to livelihood and they are the result of ground shaking caused by sudden release of energy in earth’s lithosphere. Due to Earthquake ground motions, there is heavy economic and life loss. Most of the losses are due to collapse of structures such as buildings, bridges, water retaining structures. Response reduction factor is defined as the factor by which the actual base shear force should be reduced to obtain the design lateral force. It represents the ratio of the maximum lateral force VB (Design seismic base shear) which would develop in a structure to the Design base shear calculated using the approximate fundamental period Ta. To compare response reduction factor of elevated water tank having different capacities(20m3,30m3.40m3,50m3,70m3) for different seismic zones and also different soil types and also be evaluation of strength factor ductility factor and redundancy factor for all various seismic zones. Then evaluate the response reduction factor of elevated water tank for various capacities using non linear analysis in EATABS Software. To the study includes the effect of base shear, maximum lateral displacement, fundamental time period and natural frequency of various zones to be carried out and also evaluate the displacement of elevated water tank within the permissible limits from the code book. Finally the base shear of the elevated water tank modal results can be compared to the manual calculated results.
Key Words: Elevated water tank, push over analysis, seismic loads, Base shear, Displacement
1.INTRODUCTION
The water tank is the one of the structure which is widely used in water distribution system and it is life line structure in earthquake prone area. Due to the past earthquake many structures have collapsed or damaged, it caused the life losses and property losses. So if the structure has to be constructed, it is required to check out the behaviour of structure under seismic loading. If the structure is existing, retrofitting work has to carried out. The various factors contributing to the structural damage during earthquake are vertical irregularities, irregularity in strength and stiffness, mass irregularity, torsional irregularity etc.
Earthquakes are one of the most dangerous natural hazards causing damage and collapse to livelihood and they are the result of ground shaking caused by sudden release of energy in earth’s lithosphere. Due to Earthquake ground motions, there is heavy economic and life loss. Most of the losses are due to collapse of structures such as buildings, bridges, water retaining structures, etc.
© 2016, IRJET | Impact Factor value: 4.45 | ISO 9001:2008 Certified Journal | Page 1500
beneath the structure and by the nature of the entire earth mass between the epicenter and the structure.
Response reduction factor is defined as the factor by which the actual base shear force should be reduced to obtain the design lateral force. It represents the ratio of the maximum lateral force VB
(Design seismic base shear) which would develop in a structure to the Design base shear calculated using the approximate fundamental period Ta. Base shear force
is the force that would be generated at the base of the structure if the structure were to remain elastic during its response to the design basis earthquake (DBE)
.
Over strength (RS): It is defined as an supplementary
strength beyond the design strength. Over strength can be considered to reduce forces used in design, hence leading to more economical structures. Over strength is the ratio of maximum base shear from pushover curve(Vo) to design base shear (VB).
i.e., Rs = Vo/ VB
Ductility Factor (Rμ): Itis defined as the capacity to undergo large inelastic deformations without significant loss of strength or stiffness. Ductile structures have been found to perform much better in comparison to brittle structures. Ductility ratio ‘μ’ is given by
μ = Δu / Δy, where Δu is ultimate deformation and Δy is yield deformation.
Then Rμ can be evaluated using Miranda and Bertero equation.
Redundancy factor( RR): it is defined usually as
beyond what is necessary or naturally excessive. Building should have high degree of redundancy. More the redundancy in the structure tends to increase in level of energy dissipation and more strength.
This factor is considered as per ATC19 as follows: Lines of vertical seismic
framing Drift redundancy factor
2 0.71
3 0.86
4 1
The response reduction factor R reflects the capacity of structure to dissipate energy through in elastic behavior. It is combined effect of over strength, ductility factor and redundancy factor represented as
R = RS * Rμ * RR
1.1 Problem Statement
Importance of seismic is very essential factor for the analyzing tall structures and so that effect of the performance of seismic analysis is one of the important phenomena For the RCC elevated water tank responses were find out with the help of the nonlinear static analysis. For RCC elevated water tank the outputs results are compared with the different zones from zone 2 to zone 5. For the static nonlinear response of the structures of the elevated water tank pushover analysis is conducted in this analysis and in static analysis various responses of elevated water tank are displacement and time period and natural frequency and base shear evaluated and compared with respective zones and also for different soil conditions R factor of most common designed rectangular tank through comparing the assumed R factor during design to actual R factor obtained from the non-linear analysis is compared with time period and different zones.
1.2 PUSHOVER ANALYSIS PROCEDURE
Following are the steps followed in the present study to carry out analysis, design and performance study of RC frame
1. 3D model of RC frame was created.
2. Corresponding section and loads for the beam and column were assigned.
3. Analysis was carried out for both gravity and earthquake loads.
4. Design was carried out using ETABS15, itself, as per IS: 456-2000 provision.
5. Default hinge properties at assumed potential points (near beginning and ending of the element) were assigned.
© 2016, IRJET | Impact Factor value: 4.45 | ISO 9001:2008 Certified Journal | Page 1501
8. For displacement control case, earthquake force is used to push the frame laterally upto maximum displacement (4% of building height).
9. Run the non-linear static analysis to get pushover curve.
2. Material Properties
The following are the material properties of an existing water tank are
Grade of concrete = 20 MPa
Grade of steel = 415 MPa
Modulus of elasticity of steel = 210000 MPa
Modulus of elasticity of concrete = 5000×√fck =22360.64 MPa
[image:3.595.301.567.99.172.2]Ultimate strain in bending = 0.0035
Table -1: Description of rectangular over head water tank for seismic analysis
Capacity 20m3 30m3 40m3 50m3 70m3
Seismic zone II II II II II
Length and width of container
4*3.5 5*4 6*5 6.5*5.5 7*6
Height of
container(m) 2.93 3 2.83 2.89 3.1
Wall thickness of container(m m)
150 150 150 150 150
Top slab container thickness(m m)
120 120 120 120 120
Bottom slab container thickness(m m)
200 200 200 200 200
Height of
staging(m) 16 16 16 16 16
Column size
(mm) 350*350 350X350 350X350 350X350 400X400
Size of plinth
beam (mm) 230X450 230X450 230X450 230X450 300X450
Size of top
slab beam(m) 230X450 230X450 230X450 230X450 230X450
Size of bottom slab beam(mm)
300X50 0
300X50 0
300X60 0
300X700 300X7 00
No of column 4 4 4 4 4
Length of
column (m) 4 4 4 4 4
Soil type II II II II II
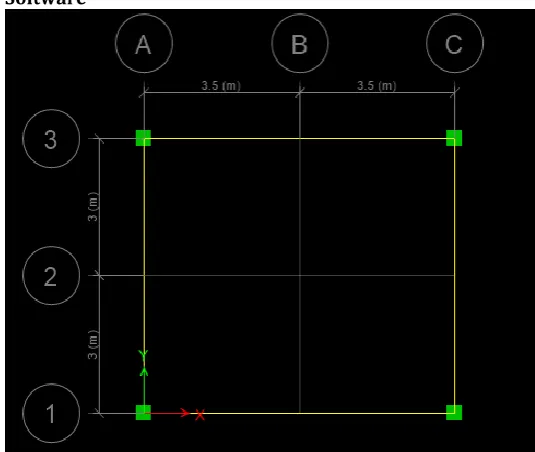
2.1.1 Rectangular Tank modeled by using ETABS Software
[image:3.595.306.574.202.428.2]Figure 1: Plan of 70m3 Rectangular Water tank
Figure 2: Elevation and 3D of 70m3 of Rectangular water
© 2016, IRJET | Impact Factor value: 4.45 | ISO 9001:2008 Certified Journal | Page 1502 3. ALAYSIS AND RESULTS
3.1 Design base shear for 70m3 capacity tank
weight of columns
=0.4*0.4*16*4*25+0.4*0.4*3.1*4*25 =305.60kN
weight of beams
=0.3*0.45*3.5*32*25+0.3*0.7*3.5*8*25 =525kN
weight of slabs =0.12*7*6*25+0.2*7*6*25 =336N
weight of walls =0.15*6*3.1*4*25 =279kN
weight of water =7*6*1.667*9.81 =686.83kN
Total weight of the structure=2132.43Kn The horizontal seismic coefficient Ah for the structure can be determined by
Ah=Z*I*Sa/(g*2*R) Where Z=zone factor I=importance factor
R=response reduction factor
Sa/g=avg response acceleration coefficient T=0.075*h0.75=0.075*19.1^0.75=0.685s Therefore Sa/g=1.36/T=1.36/.685=1.985 Ah=1.985*0.1*1/(2*2.5)=0.0397
Therefore design base shear for Zone II VB=0.0397*=84.65kN
Similarly for Zone III VB=135.45KN Zone IV VB=203.17KN
Zone V VB=304.76KN
Figure 3: Relation between Base shear vs monitored displacement
Results from above table and corresponding graphs (Figure 3) shows the variations of base shear v/s displacement for different zones of 70m3 capacity
tank. The curve shows the max base shear and corresponding displacement for zone II is 204.36kN and 337.6mm respectively.
similarly
For zone III it is 228kN and 365.1mm. For zone IV it is 225.935kN and 364mm. For zone V it is 227.481kN and 365mm
Calculation of response reduction factor 3.2 Estimation of strength factor [for zone II]
Maximum Base Shear (from pushover curve) Vo=204.36kN
Design Base shear (as per EQ calculation) VB =84.65kN
Using equation for strength factor, given in ATC – 19
Rs = Vo / VB=204.36/84.65
Rs =2.41
Estimation of ductility factor
Maximum drift capacity Δm =76.4mm (0.004 H) Yield drift Δy =23.89mm
Using equation for displacement ductility ratio, given in ATC-19 [1]μ = Δm / Δy =75.56/26=3.19
Using equation for ductility factor, derived by Miranda and Bertero
R μ = {(μ - 1 / Φ) + 1}
ϕ for medium soil = 1+{1 /(12T -μT)}–{(2 / 5T)*e-2(ln(T) – 0.2)^2}
T =1.238seconds (From ETABS model) Φ=1.0915
Rμ=3.00
Estimation of redundancy factor
RR = 0.71 (Redundancy factor (RR) from ATC-19)
Estimation of response reduction factor R:
R= RS x Rμ x RR =2.41*3.00*0.71
© 2016, IRJET | Impact Factor value: 4.45 | ISO 9001:2008 Certified Journal | Page 1503 Table 2: Comparing value of “R” factor for different
zones of 70m3 capacity of tank
Zone II III IV V
Time period 1.238 1.193 0.895 0.740
Over strength factor(RS)
2.41 1.68 1.11 0.746
Ductility ratio(µ) 3.19 3.34 3.44 3.63
Ductility factor(Rµ) 3.00 3.13 3.17 3.30
Redundancy factor(RR)
0.71 0.71 0.71 0.71
Response reduction factor(R)
[image:5.595.37.288.456.608.2]5.14 3.74 2.49 1.7
Table 2 shows the time period, ductility factor, and response reduction factor for 70m3.It is observed
that the value of ‘R’ varies from 5.14 to 1.7 and that of % variation of ‘R’ value for seismic zone II as compared to the zones III, IV, V is 72.7%, 48.4% and 33% respectively.
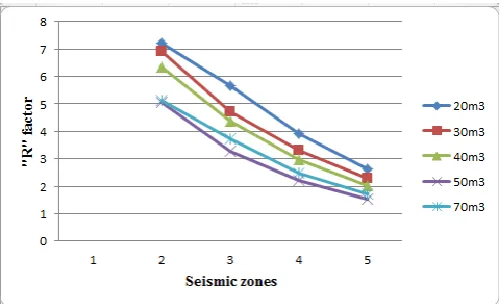
Figure 4: graph of R factor v/s seismic zones for different capacities of water tank
Figure 5: graph of Rμ factor v/s seismic zones for different capacities of water tank
Figures 4 and 5 shows that the time period, ductility factor, and response reduction factor for 20m3, 30m3,
40m3, 50m3 and 70m3 capacity water tank in
different seismic zones. It is observed that the ductility factor, response reduction factor is
affected by seismic zones. It is also observed that as time period increases the ductility factor
also decreases but the ‘R’ factor increases. Also ‘R’ factor decreases with seismic zones and
ductility factor increases with seismic zones. The variation of ‘R’ factor and ductility factors
are shown in Fig 17 and 18.The over strength factor Rs reduces with zones. The results from
© 2016, IRJET | Impact Factor value: 4.45 | ISO 9001:2008 Certified Journal | Page 1504 CONCULSIONS
Based on the results from pushover analysis following conclusions are arrived.
1) Earthquake force decreases with increases in staging height.
2)Base shear increases as capacity increases with various seismic zones but decreases with time period. 3) There is no mathematical basis for the response reduction factor tabulated in India design codes. 4) Pushover curves for different capacities elevated over head water tank shows the max base shear and corresponding displacement values for different seismic zones.
5) It is observed that response reduction factor is directly proportional to the fundamental time period of water tank that is to say it is increase with time period
.
6) The contributing factor while evaluating “R”factor i.e Rµ is also increases with time period and Rs is decreases with time period as seismic zones increases.
7) It is observed from the additional study on soil types the time period for soil type I is higher than that of soil type II.
8) Value of response reduction factor for soil type I is more than that of soil type II.
The % variation of “R” value for soil type I as compared to that of II for 20m3 capacity elevated water tank is decreased by 68.1%. Similarly
For 30m3 capacity elevated water tank is decreased by 73.17%
For 40m3 capacity elevated water tank is decreased by 88.2%
For 50m3capacity elevated water tank is decreased by 82.9%
For 70m3 capacity elevated water tank is decreased by 86.7%
REFERENCES
[1] ATC-19, ‘Structural response modification Factors’, 1995 [2] ATC 40 (1996): “Seismic Evaluation and Retrofit of Concrete Buildings”, Volume1, ATC-40 Report, Applied Technology Council, Redwood City, California
[3] IS 1893 (Part I) 2002, ‘Criteria for Earthquake Resistant Design of Structures
[4] Jinkoo Kim, Hyunhoon Choi., “Response modification factors of chevron-braced frames”Engineering Structures 27 (2005) 285–300(2004)
[5] Bhavin Patel and Dhara Shah., “Formulation of Response Reduction Factor for RCC Framed Staging of Elevated Water
Tank” Proceedings of the World Congress on Engineering 2010 Vol III WCE 2010, June 30 - July 2, 2010, London, U.K. [6] SoheilSoroushnia, TavousiTafreshi, Omidinasab SH, Beheshtian F, SajadSoroushnia N., “Seismic Performance of RC Elevated Water Tanks with Frame Staging and Exhibition Damage Pattern” The Twelfth East Asia-Pacific Conference on Structural Engineering and Construction(Procedia Engineering 14 (2011) 3076–3087)
[7]Moslemi M, Kianoush M R,Pogorzelski W., “Seismic response of liquid-filled elevated tanks” Engineering Structures 33 (2011) 2074–2084 (2011)
[8] Estekanchi H E, Alembagheri M., “Seismic analysis of steel liquid storage tanks by Endurance Time method” Thin-Walled Structures 50 (2012) 14–23
[9]MostafaMasoudi, SassanEshghi, Mohsen Ghafory
-Ashtiany.,“Evaluation of response modification factor (R) of elevated concrete tanks”Engineering Structures 39 (2012) 199–209(2012)
[10] Tande, S. N. and. Ambekar, R. V., “An Investigation of Seismic Response Reduction Factor for Earthquake Resistant Design” International Journal of Latest Trends in Engineering and Technology (IJLTET), 2013