© 2016, IRJET ISO 9001:2008 Certified Journal Page 1616
Hep-2 cell classification using shape index histogram with donut
shaped spatial pooling
P. Asha
1, Prof. R S Khule
21
Student, Dept. Of ENTC Engineering, Matoshri College of Engineering & Research centre,
Savitribai Phule Pune University,
Nasik, Maharashtra, India
2
Professor, Dept. Of ENTC Engineering, Matoshri College of Engineering & Research centre,
Savitribai Phule Pune University,
Nasik, Maharashtra, India
---***---Abstract
-
HEp-2 cell image classification is vital andrelatively unexplored area of research. This concept presents an experimental analysis of different categories of feature. This work develops a new method for automatic pattern recognition categorization of immunoflourescence images of HEp-2 cells into Centro mere, Golgi, homogeneous, Nucleolar, Numem and Speckled classes. It will stand on a new texture gauge called shape index histograms that captures second order image construction at several scales. Moreover, a spatial decomposition scheme which is radically symmetric and appropriate for cell images is introduced. The spatial decay is performed using donut-shaped pooling regions of varying sizes when gathering histogram contributions. We will assess our method using both the ICIP 2013 and the ICPR 2012 competition datasets. Our outcome shows that shape index histograms are superior to other popular texture descriptors for HEp-2 cell classification. Moreover, when comparing to other robust systems for HEp-2 cell classification. We will show that shape index histograms are very spirited; especially considering the fairly low complexity of the method.
Key Words
:
Cell classification, feature histograms,
indirect immunofluorescence, shape index, spatial pooling, texture decryption.
1. INTRODUCTION
( Size 11 , cambria font)Cancer cells are cells that grow and divide at a rapid and unregulated pace. Although cancer cells are regularly created in the body, the disease known as cancer only occurs when immune cells fail to recognize and/or destroy them. In the past a common belief was that cancer cells failed to be recognized and destroyed because of weakness in the immune system. However more recent research has shown that the failure to recognize cancer cells is caused by the lack of particular co-stimulated molecules that aid in the way antigens react with lymphocytes. In this survey, weare seeking to develop an automatic method for classifying staining patterns of HEp-2 cell IIF images.
1.1 BASICS
We assess our method on the dataset as of the competition on Cells. The Anti-Nuclear Antibody (ANA) clinical pathology test is usually used to recognize a
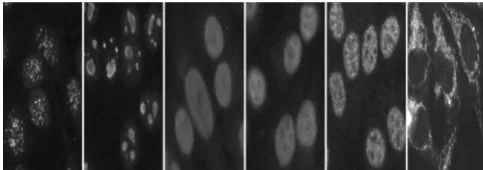
[image:1.595.317.559.406.491.2]variety of autoimmune diseases. An ordinary method for identifying the presence of ANAs is Indirect Immunofluorescence (IIF) on Human Epithelial (HEp-2) cells due to its high compassion and the large variety of antigens that can be detected [1]. The IIF HEp-2 cell patterns which are imaged need to be recognized for a more detailed diagnosis. This is typically done by human observers and is therefore subjective, relying heavily on the experience of the observer. Partly due to large inter- and intra-observer variability there is a strong demand for developing automated procedures to recognize IIF patterns that would improve test repeatability and reliability.
Figure 1: (a)Centromere (b) Nuclear Membrane (c) Golgi (d) Homogeneous (e)Speckled (f)Nucleolar.
Sample images from I3A 2014 dataset
Figure 1 shows an example cell from each class. Firstly, cell metaphors were intensity-normalized. A set of limited features was then extracted and a characteristic encoding method based on sparse coding was employed to cumulative the local features into a cell image demonstration. A two-level cell pyramid was used to capture spatial arrangement. Finally a band of a verses rest linear support vector machines (SVMs) was trained to classify cell images into one of the six classes. The following section explains the future method in detail.
© 2016, IRJET ISO 9001:2008 Certified Journal Page 1617 of the cell image. The innovation of our technique is in the
characteristic description part of the classification pipeline, and hence, this is composition that is also rotation invariant. Our donut-shaped rings are similar to the ones introduce in the RIFT descriptor. Note that the donuts do not require information about the HEp-2 cell borders is like a spatial decomposition schemes presented in [5].
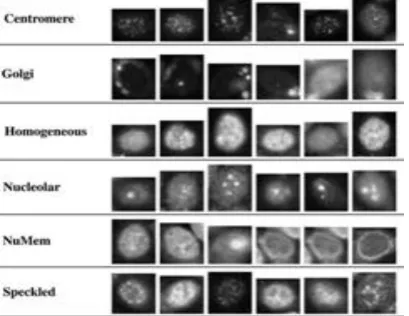
Figure 2: Examples of the six different staining pattern classes.
Immunofluorescence is a technique used for light microscopy with a fluorescence microscope and is used primarily on microbiological samples. This technique uses the specificity of antibodies to target fluorescent dyes to specific biomolecule targets within a cell, and therefore allows visualization of the distribution of the target molecule through the sample. Immunofluorescence can be used on tissue sections, cultured cell lines, or individual cells, and may be used to analyze the distribution of proteins, glycans, and small biological and non-biological molecules. We describe a system to categorize pre-segmented immunofluorescence images of HEp-2 cells keen on six classes: Homogeneous, Speckled, Nucleolar, Centromere, Golgi, and Nuclear membrane. Figure 2 shows example cell from all class. Firstly, cell images were intensity normalized. A set of limited features was then extracted and a characteristic encoding technique based on sparse coding was employed to aggregate the local characteristic into a cell image representation. A two level cell pyramid was use to capture spatial structure. Finally an ensemble of one verses rest linear support vector machines (SVMs) was trained to classify cell images into one of the six classes. The subsequent sections explain the proposed method in detail. This technique has been evaluated at the ICIP 2013 competition and got the second place just 0.11% below the winner (the accuracy scores were 83.54% and 83.65%, respectively). Our method acknowledged the title merit winner as it was the top performer in most classes.
1.1 Shape Index Histograms
[image:2.595.36.241.185.343.2]The shape index is image geometry determine proposed by Koenderink and van Doorn [2]. It captures second-order image structure in a continuous interval which allows us to review the distribution of curvatures in a histogram. Here, we shall first see how the shape index is calculated, then how we can represent shape index statistics. Note that we have prepared our implementation of shape index histograms accessible online.
[image:2.595.311.549.246.429.2]Figure 3: Shape index histograms
Figure 4: Second order curvatures along the shape index interval .
Different shapes like glass, groove, seat, edge, and top shapes are appeared. Shapes are adjusted vertically and they have the same curvedness.
Figure 5: Saddle shaped with increasing curvedness
© 2016, IRJET ISO 9001:2008 Certified Journal Page 1618
Figure 6: Diagram of the donut weight calculations. Black circle represents the mode of the distribution. Gray circles indicate the standard deviation.
1.1.1 Histogram Construction
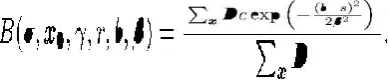
Shape index histograms are generated by choosing a set of bin centers uniformly distributed along the shape index interval . For a bin centered at , we calculate its total contributions from a weighted sum using both the spatial donut weighting and the curvedness measure ,
We apply a Gaussian window in the shape index range (aka. the tonal range) such that a shape index may contribute to neigh-boring bins. The tonal scale parameter adjusts this smoothing. We also perform a normalization of the bin contributions relative to the total spatial weight of the donut. This makes histograms with spatial pooling from small donuts to have the same influence as histograms with spatial pooling from large donuts.
At this point, it can be concluded that shape index allows us to construct histograms capturing image structure at different scales and with different spatial pooling ( and ). Thus, we can construct a feature vector by concatenating histograms with different parameters such that image structure at multiple scales is captured with different spatial decompositions.
As the final step we normalize the feature vector. That is, we normalize across all histograms in order to make the description robust to image contrast variations among the cell images. We experimented with different normalization schemes that try to diminish the dominance of large bin values in order to emphasize the influence of smaller bin values get higher influence. For example, the normalization proposed by Lowe for SIFT ( normalization followed by clipping follow b.y normalization) or the square root normalization described in ( normalization followed by element-wise square rooting followed by normalization). However, we have not found significant performance gains from any of these techniques, and we therefore use plain normalization.
1.1.2 Segmentation
It is one of the most vital processes that decide the success of character recognition technique. It is used to decay an image of a series of characters into sub images of individual symbols by segmenting lines and words.
1.1.3 Feature Extraction
Features are information extracted from the captured or input image. This information must be similar for similar images but it must be dissimilar for other images. These features play major role in pattern recognition. Thus the selection of feature extraction technique becomes an important factor in achieving high recognition performance. Some characteristic extraction method is projection, zoning, bordered transition and graph matching [17]. The projection method performs compression of data through a projection.
1.1.4
Preprocessing
In order to capture data in a paper document it is usually scanned and stored in a file of picture elements, called pixels. These pixels values: OFF (0) or ON (1) for binary images, 0– 255 for gray-scale images, and 3 channels of 0–255 color values for color images. To extract the useful information from this collected raw data I need to further process and analyze it which includes conversion of a grayscale or color image to a binary image. Further the following operations are performed.
1.1.5 Noise Removal
Addition of noise, introduced by the optical scanning device or the writing instrument, may cause disconnected line segments, bumps and gaps in lines, filled loops etc. Problems like distortion that includes local variations, rounding of corners, dilation and erosion, need to be eliminated prior to the character recognition process.
2.
LITERATURE REVIEW
A number of methods had been projected to do staining prototype categorization. At ICPR 2012, the first competition in the field was prepared with a total of 28 teams participating [1], [4]. We categorize the different classification methods into the following two approaches. One method is the popular bag of visual words (BoVW) pipeline where each method customizes one or more of the pipeline stages.
1. Spatial decay (using cell boundary information [5], image intensities [6]).
2. Local feature description (gradient histograms [6], sparse coding [5], covariance of Gabor features, linear projections [7]).
3. Feature encoding (k-means, Fisher tensors [8]). 4. Classification (linear/ kernel/multi- kernel support vector machines).
© 2016, IRJET ISO 9001:2008 Certified Journal Page 1619 2012 employs an extension of LBPs where the spatial
relatives among adjacent LBPs are prearranged in a rotation invariant manner. Our method belongs to the second approach as I apply a classifier directly on top of the shape index features.
Praful Agrawal et al. had proposed a system where they stated that HEp-2 Cell picture collocation is important and relatively unexplored area of research [14]. It presented an experimental study of five different categories of feature sets with four different classifiers to determine the best performing combination of characteristics and classifiers. The analysis was performed on the ICIP 2013 Cell Collocation Contest Training dataset comprehend over 13; 000 cell images pertaining to six cell classes. The results computed with 10 fold cross validation showed that texture features performed the best among all the explored feature sets and the combination of Laws particularity with SVM yielded the highest accuracy. They concluded in their research, the features for HEp-2 cell image classification are classified among five broad grouping: boundary, shape and size, statistical, texture, and descriptor. This classification assisted in understanding the discriminating properties of HEp-2 cells among six pattern classes namely Centromere, Golgi, Homogeneous, Nucleolar, Nuclear Membrane and Speckled.
Robert M.Haralick et al. stated that texture is one of the key characteristics used to identify items or regions of interest in an image, whether the image is a photomicrograph, aerial snap, or a satellite picture [15]. This paper described some easily computable textural features base on gray character spatial dependency. In each experiment the data set was divided into two parts, a first training set and second a test set. Test set identification accurateness was 89% for the photomicrographs, 82% for the aerial photographic images, and 83% for the satellite images. These outcome point to that the easily computable textural features probably have a common applicability for a large variety of picture categorization applications.
Pasquale Foggia et al. had introduced a system where they have reported on the primary version of the HEp-2 Cells Classification contest, held at the 2012 edition of the International Conference on Pattern Recognition, and paying attention on indirect immunofluorescence (IIF) image examination [1]. The IIF method was used to notice autoimmune diseases by seeking for antibodies in the patient serum but, unfortunately, it was a subjective method that depended on the experience and proficiency of the physician. This was the motivation behind the recent preliminary developments of computer aided analysis systems in this field.
28 different recognition systems were able to robotically recognize the staining pattern of cells within IIF images. In particular, the dataset had six staining patterns that occur
most frequently in the each day diagnostic practice: centromere, nucleolar, homogeneous, fine speckled, coarse speckled, and cytoplasmic. They concluded that they had reported the results of the first international contest on HEp-2 cells classification hosted by the HEp-21st edition of the International Conference on Pattern Recognition (ICPR 2012). Analysis of 28 methods on the same private dataset was done.
Shahab Ensafi, et. al introduced a CAD system for cell classification where the accuracy was achieved 72.8%, which is almost the same as human expert [17]. This experiment was done by looking to each cell images without considering the other cells in that specific specimen. The accuracy in image level was achieved 85.8%, which is the same as result of human expert.
S. Manivannan, et. al introduced classification using multi-resolution local patterns and SVM [12]. An ensemble of linear support vector machines was used to classify each cell image. While conducting the experiments, the training data set predicted a mean class accuracy of 80:25%.
3.
PROPOSED WORK
The different cell classification strategies adopted in the last three decades have been reviewed. Based on this survey a new technology to classify cancer cells by considering all the properties of image (like shape, size and intensity) is introduced. In the proposed method cell classification can be achieved using a shape index method strategy. The benefits of the proposed optimization method are:
1. HEP 2 cells have been classified efficiently to diagnose autoimmune diseases.
2. Crucial limitations such as inappropriate results, cost and time consuming can be reduced.
4. CONCLUSIONS
Manual analysis of IIF images had limitations that were discussed briefly. Comprehensive review related to various methodologies to classify various patterns of cells in the images was mentioned in the literature is done. Based on this review a new texture measure called shape index histograms is introduced in this paper.
5. ACKNOWLEDGEMENT
© 2016, IRJET ISO 9001:2008 Certified Journal Page 1620
REFERENCES
1]. P. Foggia, G. Percannella, P. Soda, and M. Vento, “Benchmarking HEp-2 Cells Classification Methods”, IEEE TRANSACTIONS ON MEDICAL IMAGING, VOL. 32, NO. 10, OCTOBER 2013,pp. 1878- 1889.
2]. J. J. Koenderink and A. J. van Doorn, “Surface shape and curvature scales,” Image Vis. Comput., vol. 10, no. 8, pp. 557– 564, 1992.
3]. M. Lillholm and L. D. Griffin, “Statistics and category systems for the shape index descriptor of local 2nd order natural image structure,” Image Vis. Comput., vol. 27, no. 6, pp. 771–781, 2009.
4]. P. Foggia, G. Percannella, A. Saggese, and M. Vento, “Pattern recognition in stained hep-2 cells: Where are we now?,” Pattern Recognit. vol. 47, no. 7, pp. 2305–2314, 2014.
5]. A. Wiliem, C. Sanderson, Y. Wong, P. Hobson, R. F. Minchin, and B. C. Lovell, “Automatic classification of human epithelial type 2 cell in-direct immunofluorescence images using cell pyramid matching,” Pat-tern Recognit., vol. 47, no. 7, pp. 2315–2324, 2013.
6]. L. Shen, J. Lin, S. Wu, and S. Yu, “HEp-2 image classification using intensity order pooling based features and bag of words,” Pattern Recognit., vol. 47, no. 7, pp. 2419– 2427.
7]. J. Sivic and A. Zisserman, “Video Google: A text retrieval approach to object matching in videos,” in IEEE Int. Conf. on Computer Vision, 2003.
8]. S. Lazebnik, C. Schmid, and J. Ponce, “Beyond bags of features: Spatial pyramid matching for recognizing natural scene categories,” in IEEE Computer Vision and Pattern Recognition, 2006.
9]. J. Yang, K. Yu, Y. Gong, and T. Huang, “Linear spatial pyramid match-ing using sparse coding for image classification,” in IEEE Computer Vision and Pattern Recognition, June 2009.
10]. J. Wang, J. Yang, K. Yu, F. Lv, T. Huang, and Y. Gong, “Locality-constrained linear coding for image classification,” in IEEE Computer Vision and Pattern Recognition, 2010.
11]. J. C. Platt, “Probabilistic outputs for support vector machines and comparisons to regularized likelihood methods,” in Advances in large margin classifiers, 1999.
12]. S. Manivannan, W. Li, S. Akbar, R. Wang, J. Zhang, and S. J. McKenna, “Hep-2 specimen classification using multi-resolution local patterns and SVM,” in ICPR I3A workshop on pattern recognition techniques for IIF images, 2014.
13]. R.-E. Fan, K.-W. Chang, C.-J. Hsieh, X.-R. Wang, and C.-J. Lin, “LIBLINEAR: A library for large linear classification”, Journal of Machine Learning Research, 2008.
14]. Praful Agrawal, Mayank Vatsa, Richa Singh, “Hep-2 Cell Image Classication: A Comparative Analysis”, Machine learning in medical imaging, pp. 195-202.
15]. Robert M. Haralick, K. Shanmugam, And Its'hak Dinstein, “Textural Features For Image Classification”, Ieee Xplore, January 29, 2010,Pp. 610- 621.
16]. Prachi Mukherji, Priti Rege, “Shape Feature and Fuzzy logic based offline Devnagari handwritten optical character Recognition”, International Journal of Pattern Recognition Research, Vol. 4, 2009.pp. 52-68.