DETECTION MECHANISM FOR DISTRIBUTED DENIAL OF
SERVICE (DDOS) ATTACKS FOR ANOMALY DETECTION
SYSTEM
1K. SARAVANAN, 2Dr.R. ASOKAN and 3Dr.K. VENKATACHALAM
1Asst Prof., Department of Computer Science and Engineering, ERODE SENGUNTHAR ENGINEERING
COLLEGE, ERODE, TAMILNADU
2Principal, KONGUNADU COLLEGE OF ENGINEERING AND TECHNOLOGY, THOTTIAM,
TRICHY, TAMILNADU
3Professor, Department of Electronics and Communication Engineering, VELALAR COLLEGE OF
ENGINEERING AND TECHNOLOGY, ERODE, TAMILNADU
E-mail: [email protected], [email protected]
ABSTRACT
DDoS means Distributed Denial of Service. DDoS is the attack to pollute the network. The attacker creates a large amount of packet to the particular system. DoS attacks synchronized by a group of attackers will lead to Distributed DoS. The packets are sending by using the compromised computers. Which are targeted systems does not response to all the packets because of the DDOS attacks. In this paper, it is proposed a novel statically method fo r DDoS attacks that is based on anomaly detection. Statistical techniques are used to classify packets followed by rule set model which helps in improving proposed system performance.
Keywords: Distributed Denial of Service Attack (DDoS), Denial of Service Attack (DoS), Fast Fourier
Transform (FFT), Discrete Wavelet Transform (DWT)
1. INTRODUCTION
The internet is polluting the network environment most reason is Distributed Denial-of-Service (DDoS) attacks. The attackers generate a huge amount of requests to victims through compromised computers (zombies), with the aim of denying normal service. Initially network data stream traffic is analyzed with traffic signal generated from packet header traces recorded as input. Next required header fields are segregated from the input log files of the packet header to transform the data transformation for discrete wavelet based statistical analysis. The discrete wavelet transforms work on the concurrencies of the required fields of options such as stream identifier, loose and strict sour routing, time stamp, and type of versions to evaluate the normal and abnormal traffic streams with anomalies in various time zones of the
recorded data input header files. With
information analysis on the header packets data in the wavelet transformation is made to identify the attacker and anomalies derived with mean
threshold relating to the training data sets and the test data sets.
The proposed system model’s traffic source workable data are obtained from the routers deployed in the network domain considered for evaluation. A traffic monitoring at a source network enables a detector to detect attacks early and is able to control hijacking of admin domain machines. Outbound filtering has been advocated for limiting the possibility of address spoofing i.e., to make sure that source addresses correspond to the designated addresses for the campus. With such filtering in place, we can focus on destination addresses and port numbers of the outgoing traffic for analysis purposes.
2. ANOMALY DETECTION RULE SET
number correlation over several timescales. Then the detection of attacks and anomalies are
checked using thresholds. The analyzed
information will be compared with historical
thresholds to see whether the traffic’s
characteristics are out of regular norms. This comparison will lead to some form of a detection signal that could be used to alert the network administrator of the potential anomalies in the network traffic.
The generated signal can be, in general, analyzed by employing techniques such as FFT and wavelet transforms. The analysis carried out on the signal may exploit the statistical properties of the signal such as correlation over several timescales and its distribution properties. Since wavelet analysis can reveal scaling properties of the temporal and frequency
dynamics simultaneously unlike Fourier
Transform, proposal compute a wavelet
transform of the generated address correlation signal over several sampling points. Through signal can be detected in certain timescales that imply frequency components, and in certain positions of the timescales that mean temporal information, can induce the frequency and
temporal components respectively. DWT
consists of decomposition and reconstruction. The proposed model iterates a multilevel one-dimensional wavelet analysis up to 8 levels in case of the postmortem analysis, so our final analysis coefficients. The filtered signal is down sampled by 2 at each level of the analysis procedure. The signal of each level has an effect that sampling interval extends 2 times. Consequently it means that the wavelet transform identifies the changes in the signal over several timescales. When use t minutes as sampling interval j, the time range at a level spans t*2j minutes. This time range can independently sample and restore frequency components.
3. FORMULATION OF ANOMALY TRAFFIC DETECTION
Detection of anomalies using the real attack traces are based on composite approach with network traffic measures on the sampled time band. The weighted correlation signal of IP addresses is used for wavelet transform with real attacks. The anomaly detection results of0020the wavelet-transform and reconstructed signal are
supposed to be evaluated from the
experimentation.
Periodic traffic trend (with period T=24 hours) can be defined as follows:
Interval 0 – t1 (night traffic) y(t) = A1
Interval t1 – t2 (increase of morning traffic)
y(t) = A1 + (A2 – A1) * ((t-t1) / (t2 – t2)
Interval t2 – t3 (daily traffic) y(t) = A2
Interval t3 – T (fall of night traffic)
y(t) = A2 – (A2 – A1) * ((t-t3) / (T – t3))
Where A1, A2 are amplitude of the traffic pattern t1, t2, t3 and T represent values of time intervals and its values vary from user to user. In case of some users, in days of weekend the fall of average daily traffic is about 25%. In this sense, the value of A2 for a same user can not be considered as constant in all periods T. In order to determine the range of expected values of traffic in a certain time during the day, 24 samples were taken from the curve of traffic from all segments of time: 0 – t1, t1 – t2, t2 – t3 and t3 – T. The descriptive statistics is applied on them, with aim of calculating the lower and upper control limit.
The arithmetic mean and standard deviation of samples are calculated, and on the basis of them, with confidence interval around 99% (i.e. 3ó), the maximum and minimum of expected value of traffic is determined. Each value that falls outside the specified interval, in statistical terms is a network anomaly and doubt on attack.
4. IMPLEMENTATION
The data collected from the internet service provider during various time stamps in the form of packet header streams stored in recorded file logs. The file logs were recorded during real time traffic arises on providing service of internet connection to the user demands of varying
bandwidth. Initially the packet header
comprising all fields are analyzed and extraction is made on the essential fields of IP header i.e., source and destination IP addresses, option field of stream identifier, loose and strict source routing, internet time stamp, time to live, protocol, version and type of services. Option field in our work identify statistical variance in the following parameters to detect the anomaly
In switching between Loose Source
Routing and Strict Source Routing
Abnormality arise in internet time stamp
Changes in Stream identifier
Individual fields in the packet header are analyzed to observe anomalies in the traffic. Individual fields in the traffic header data take discrete values and show discontinuities in the sample space. For example, IP address space can span 232 possible addresses and addresses in a sample are likely to exhibit many discontinuities over this space making it harder to analyze the data over the address space. In order to overcome such discontinuities over a discrete space, we convert packet header data into a continuous signal through correlation of samples over successive samples. To investigate the sequence of a random process, we employ a simplified correlation of time series for computational efficiency without compromising performance.
For each address in the traffic count the number of packets sent in the sampling instant.
For computing address correlation signal, consider two adjacent sampling instants. The detection model define address correlation signal in sampling point. If an address spans the two sampling points i.e., n-1 and n, the user obtain a positive contribution. In order to minimize storage and processing complexity, employ a linked data structure. A location count is used to record the packet count for the address j in ith field of the IP address through scaling. This provides a concise description of the address instead of 232 locations that would be required to store the address occurrence uniquely.
5. RESULT
[image:3.612.82.506.651.712.2]To illustrate the performance of statistical traffic anomaly detection in wired network, single user is considered, and the sample data is applied on different time intervals as shown table 1.
Table 1: Statistical Evaluation On The Traffic Samples
In our analyses we found that in neither case the calculated maximum value of traffic exceeds 34.1 Mb/s. The fact justifies our method. The research also studies about establishing the size and variation recorded for different time periods. The observed values are the average and maximum traffic of several users, on daily, weekly and monthly basis. An evaluation of the above method shows that the changes in maxima and average values of traffic are relatively small
the average value of difference in maximum traffic is 3.26% while in average value is 8.44%.
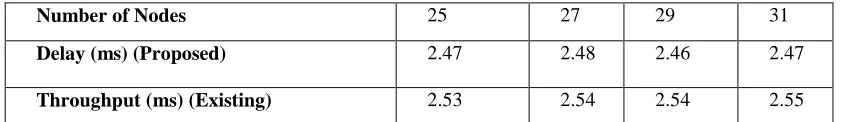
It depicts the node delay measure of intrusion anomaly detection towards maintenance of record route. In our analysis, we found that the delay in proposed work was 2.46 or higher where the throughput value was 2.53 or higher.
Table 2: Node Delay Measure Of Anomaly Detection Towards Maintenance Of Record Route
Sample 09-24 Hours
(Mb/s)
24-03 Hours (Mb/s)
03-07 Hours (Mb/s)
07-09 Hours (Mb/s)
Average 23.15 11.87 8.07 15.87
Standard deviation 3.65 3.36 1.83 4.93
Max (99%) 34.11 21.96 13.57 30.66
Min (99%) 12.18 1.77 2.57 1.07
Number of Nodes 25 27 29 31
Delay (ms) (Proposed) 2.47 2.48 2.46 2.47
The simulation result based on the node variation affecting the jitter is measured. The jitter value increases as the number of nodes increased in the anonymous traffic network. As
for comparison made on existing method (without bandwidth threshold), the jitter is low in the proposed method.
Number of Nodes Vs Jitter
2.32 2.37 2.42 2.47 2.52 2.57 2.62
23 25 27 29 31 33 35
Number of Nodes
D
e
la
y
(
m
s
)
[image:4.612.102.523.161.361.2]proposed existing
Fig . 1 Number Of Nodes Vs Jitter
6. CONCLUSION
The existing work utilized discrete wavelet for destination IP address correlation data for anomaly detection, however in our work we applied the statistical discrete wavelet transform for the option fields of traffic stream identifier,
internet time stamp, recording of data
transmission route, and the flags of loose and
strict source routing. Some attacks are
immediately recognizable, perhaps taking the form of one or more packets operating over a short time period Ät – e.g. less than one second. Others are active for a much longer period (e.g. hours, days or even weeks) and may not even be identified as attacks until a vast collection of event records are considered in aggregate.
REFERENCES
[1] C. Patrikakis, M. Masikos, and O. Zouraraki, “Distributed Denial of Service Attacks,” The Internet Protocol J., vol. 7, no. 4, pp. 13-35, 2004.
[2] T. Peng, C. Leckie, and K.
Ramamohanarao, “Survey of Network-
Based Defense Mechanisms
Countering the DoS and DDoS
Problems,” ACM Computing Surveys, vol. 39, no. 1, p. 3, 2007.
[3] Y. Kim et al., “PacketScore: A Statistics-Based Packet Filtering Scheme against Distributed Denial-of-Service Attacks,” IEEE Trans. Dependable and Secure Computing, vol. 3, no. 2, pp. 141-155, Apr.-June 2006.
[4] H. Wang, C. Jin, and K.G. Shin, “Defense against Spoofed IP Traffic Using Hop-Count Filtering,” IEEE/ACM Trans. Networking, vol. 15, no. 1, pp. 40-53, Feb. 2007.
[5] Y. Chen and K. Hwang, “Collaborative Detection and Filtering of Shrew DDoS Attacks Using Spectral Analysis,” J. Parallel and Distributed Computing, vol. 66, pp. 1137-1151, 2006.
[6] K. Lu et al., “Robust and Efficient Detection of DDoS Attacks for Large-Scale Internet,” Computer Networks, vol. 51, no. 9, pp. 5036- 5056, 2007.
[8] P.E. Ayres et al., “ALPi: A DDoS Defense System for High-Speed Networks,” IEEE J. Selected Areas Comm., vol. 24, no. 10, pp. 1864- 1876, Oct. 2006.
[9] R. Chen, J. Park, and R. Marchany, “A Divide-and-Conquer Strategy for
Thwarting Distributed
Denial-of-Service Attacks,” IEEE Trans. Parallel and Distributed Systems, vol. 18, no. 5, pp. 577-588, May 2007.
[10] A. Yaar, A. Perrig, and D. Song, “StackPi: New Packet Marking and Filtering Mechanisms for DDoS and IP Spoofing Defense,” IEEE J. Selected Areas Comm., vol. 24, no. 10, pp. 1853-1863, Oct. 2006.
[11] J. Xu and W. Lee, “Sustaining
Availability of Web Services under
Distributed Denial of Services
Attacks,” IEEE Trans. Computers, vol. 52, no. 2, pp. 195-208, Feb. 2003.
[12] W. Feng, E. Kaiser, and A. Luu, “Design
and Implementation of Network
Puzzles,” Proc. IEEE INFOCOM, pp. 2372-2382, 2005.
[13] X. Yang, D. Wetherall, and T. Anderson, “A DoS-Limiting Network Architecture,” Proc. ACM SIGCOMM, pp. 241-252, 2005.
[14] Z. Duan, X. Yuan, and J. Chandrashekar,
“Controlling IP Spoofing through
Interdomain Packet Filters,” IEEE Trans. Dependable and Secure Computing, vol. 5, no. 1, pp. 22-36, Jan.-Mar. 2007.
[15] F. Soldo, A. Markopoulou, and K. Argyraki, “Optimal Filtering of Source Address Prefixes: Models and Algorithms,” Proc. IEEE INFOCOM, 2009.
[16] A. El-Atawy et al., “Adaptive Early Packet Filtering for Protecting Firewalls
against DoS Attacks,” Proc. IEEE
INFOCOM, 2009.
[17] B. Al-Duwairi and M. Govindarasu, “Novel Hybrid Schemes Employing Packet Marking and Logging for IP Traceback,” IEEE Trans. Parallel and Distributed Systems, vol. 17, no. 5, pp. 403-418, May 2006.
[18] M.T. Goodrich, “Probabilistic Packet Marking for Large-Scale IP Traceback,” IEEE/ACM Trans. Networking, vol. 16, no. 1, pp. 15-24, Feb. 2008.
[19] T.K.T. Law, J.C.S. Lui, and D.K.Y. Yau, “You Can Run, But You Can’t Hide: An Effective Statistical Methodology to Traceback DDoS Attackers,” IEEE Trans. Parallel and Distributed Systems, vol. 16, no. 9, pp. 799-813, Sept. 2005. [20] Saravanan Kumarasamy, “An effective
defence mechanism for Distributed Denial-of- Service (DDoS) attacks using router-based techniques”, In the Proceedings of
International Journal of Critical
Infrastructures, IJCIS, vol. 6,No.1, pp 73-80.
2010,
[21] Mr. K.Saravanan, and Dr.R.Asokan “ Distributed Denial of Service (DDoS) Attacks Detection Mechanism ”, In the
Proceedings of International Journal of
Computer Science Engineering and
Information Technology, IJCSEIT, Vol. 1,
No. 2011.
[22] Mr. K.Saravanan, and Dr.R.Asokan “An
Efficient Detection Mechanism for
Distributed Denial of Service (DDoS) Attacks”, In the Proceedings of International
Journal of Electronics Communication and Computer Engineering, IJECCE, Vol. 3,