PERFORMANCE EVALUATION OF FEATURE
EXTRACTION AND FEATURE SELECTION FOR
CLASSIFICATION OF LUNG DISEASES
1C.BHUVANESWARI, 2Dr.P.ARUNA, 3 Dr.D.LOGANATHAN
1Head, Department of computer science, Theivanai Ammal College for women (Autonomous)
Villupuram, Tamilnadu, India 2
Professor, Department of Computer Science and Engineering, Annamalai University, Chidambaram Tamilnadu, India
3Professor and Head, Department of Computer Science and Pondicherry Engineering College, Puducherry
E-mail: [email protected], [email protected], [email protected]
ABSTRACT
In this paper, investigations to evaluate various feature extraction and selection methods for classification of lung images are conducted. Widespread screening by CT or MRI is not practical, ensuring that chest radiology is the most common procedure for diagnosis of lung disease. The term lung disease refers to the disorders that affect the lungs such as asthma, COPD and infections like influenza, pneumonia, tuberculosis, lung cancer, and many other breathing problems. This study classifies Lung images automatically as Pleural effusion, Emphysema, Bronchitis and normal lung scan. Features extraction is through Gabor filter, Walsh hadamard transform. Feature selection is through Correlation based Feature Selection (CFS), Principal component analysis (PCA). Classification is through use of Naïve Bayes, J 48, K- Nearest Neighbour (KNN) and Multi-Layer Perceptron Neural Network. The results of the performance ensure that the PCA with multi layer perceptron provides above 81% of accuracy.
Keywords: Classification, Feature Extraction, Performance, Radiology, Selection
1. INTRODUCTION
The lungs are contained within the thoracic cavity. The lungs themselves are enveloped in two pleural membranes or pleurae. It retains its form and size due to the vacuum between the pleura and the chest wall. The lungs are subdivided into lobes: compartments that are fed by different parts of the bronchial and vessel trees. CT imaging had evolved far enough in terms of speed and resolution to make it a valuable tool in the imaging of the lungs. The medical image analysis is extremely challenging for many reasons. First, as CAD/CADx systems efficacy has very serious implications, near perfection is needed. Second, large variability in the abnormalities appearance makes this a difficult image analysis task.
Bronchitis is a form of COPD characterized by a chronic productive cough. Emphysema is pathology of the lung, characterized by the destruction of lung tissue. Difficulty blowing air out is its hallmark. Emphysema shows up on CT as areas with abnormally low attenuation coefficients. Pleural
effusion refers to increased amount of fluid within the pleural cavity (i.e.) accumulation of fluid between the layers of the membrane that lines the lungs and the chest cavity. The CT scan types which investigate specific areas of the body include: head scans, which check for suspected brain tumors and bleeding abdominal scans, to detect tumors and diagnose conditions causing internal organs like liver, kidneys, pancreas, intestines or lungs, Bone scans, which assess bone injuries and disease.
2. RELATED WORKS
Computed Tomography (CT) is efficient than X-ray [1], the latter is more generally available. Therefore preliminary diagnosis for TB and lung cancer, currently performed by medical doctors, is mainly based on chest X ray images. In previous studies, classification systems were developed by using the features of nodule candidate patterns with image-processing techniques [2–4], by classifying the shape of pulmonary nodule patterns [5, 6] and by using morphological features [7, 8].
Mitani, et al., [9] evaluated performance of Gabor filter and experiments revealed that the Gabor filter-based approach was effective in classifying diffuse lung diseases.
A computer-aided system to classify CT images proposed by Mohammed, et al., [10] described lung images, using artificial NN CT images and which were investigated to develop a computer-aided system to discriminate varying lung abnormalities. This was through analysis of data recorded for healthy subjects.
Uppaluri et al. [11] have developed a general system for regional classification by using small areas that were classified into one of the six categories based upon 15 statistical and fractal texture features.
Shyu et al, [12] have developed a system that retrieves reference cases similar to the case at hand from a proven database. In their approach they have combined global and anatomical knowledge, combining features from several pathological regions and anatomical indicators per slice.
Ribeiro, et al., [15] proposed StARMiner (Statistical Association Rule Miner) that aims at identifying the most relevant features from those extracted from each image, taking advantage of statistical association rules. The feature vectors condense the texture information of segmented images in just 30 features. The attributes selected by StARMiner with those selected by the C4.5 were compared, and found that the attributes selected by StARMiner maintains the retrieval ability of images higher. The proposed StARMiner achieved a reduction of 50% to 85% in the number of features.
3. PROPOSED WORK
The following are the illustration of the proposed work.
Fig 1: Block Diagram of the proposed work
3.1 Material And Methods
In the study, dataset containing 59 lung CT images comprising emphysema(15),Bronchitis(20),Pleural Effusion(10) and normal lung(14) are taken from 59 patients was utilized. The lung diseases are categorized by the radiologist from the CT Image. Images are collected from 31 male and 28 female patients whose ages are ranging from 15 to 78 years. The chest CT images of patients were scanned at Radiology Department, Sri Manakula Vinayagar Medical College and Hospital Madagadipet, Puducherry. All CT images are in size of 256 × 256 pixels and stored as DICOM (Digital Imaging and Communications in Medicine) format files, directly from the CT modality.
3.2. Data Preprocessing
Preprocessing phase of the images is necessary to improve the quality of the images and make the feature extraction phase more reliable. The purpose of pre-processing is removal of noises from the lung CT images. In the data preprocessing the median filters and morphological smoothening are applied to enable the input image for effective feature extraction techniques.
3.3 Feature Extraction
Images usually have a huge number of features. It is important to recognize and extract interesting features for an exacting task in order to decrease the complexity of processing. All the attributes of an image are not useful for knowledge extraction. The feature extraction methods used are a) Gabor filter b)Walsh hadamard transform
FEATURE EXTRACTION METHODS 1.Gabor filter 2.Walsh hadamard transform
FEATURE SELECTION METHODS 1. Correlation Based Feature Selection 2. Principal component Analysis
CLASSIFIERS
1. J48 2. KNN 3. MLP-NN 4. NAÏVE BAYES
Bench Marking By Performance Measures Preprocessed image
3.3.1 Gabor Filter
The Gabor filter is used to extract the texture features from the preprocessed image. The coding is implemented using the Matlab. The 2D Gabor filter constitutes a sinusoidal plane of specific frequency and modulated Gaussian.
( )
22 221 1
, exp
2 x y 2 x y
x y
G x y
πσ σ σ σ
− +
(1) The gabor filter will extract the texture features and the various orientations of the images are taken along with the max, min, mean, median.
3.3.2 Walsh–Hadamard Transform
The Walsh–Hadamard transform returns sequency values. Sequency is a frequency notion and defined as one half of average number of zero-crossings per unit time interval. The Walsh functions in the matrix are not arranged in increasing order of their sequencies or number of zero-crossings
1 1 1
1 - 1 2
N N
N
N N
H H
H
H H
− −
=
− −
(2)
Additionally the WHT was advantageous due to the following reasons: (a) it has a real nature and (b) only additions and subtractions are needed to compute coefficients.
3.4 Feature Selection
Feature selection deals with selecting a subset of features, among the full features, that shows the best performance in classification accuracy. The best subset contains the least number of dimensions that most contribute to accuracy. The methods used in this work are the correlation based feature selection and principal component analysis.
3.4.1 Correlation-Based Feature Selection (Cfs) One of the filter based multivariate model search which is models feature dependencies, Independent of the classifier, better computational complexity than wrapper methods is correlation based feature selection. CFS is used to determine the best feature subset and is usually combined with search strategies such as forward selection, backward elimination, bi-directional search, best-first search and genetic search.CFS first calculates a matrix of feature-class and feature-feature correlations from the training data.
3.4.2 Principal Component Analysis (PCA) PCA is a popular data processing/dimension reduction technique. It has many applications as an un-supervised learning method like handwritten zip code classification and human face recognition.
(3) where T means transpose. U is principal components (PCs) of unit length, and columns of V are principal components corresponding loadings. The variance of ith PC is .
3.5 Classifiers
The “classifier" referred as the mathematical function, which is implemented by a classification algorithm, will maps input data to a category can be supervised or unsupervised learning. Four types of the classifiers are used for the proposed work.
3.5.1 Naïve Bayes
Bayesian classifiers assign the most likely class to a given example described by its feature vector. Naïve Bayes is used for classifying the extracted features in this study. The extracted features are classified to the most likely class. Learning in Naïve Bayes is simplified by assuming that the features are independent for a given class. The feature is classified as shown in equation (4) Where X=(X1,…, Xn) is the feature vector and C is a class.
The choice of choosing this classifier is the
(4) The images are classified according to the features according to the classes.
3.5.2 J48
Decision tree structures organize classification schemes where they visualize the steps to reach classification. A decision tree begins with a root node, considered other nodes "parent." Each tree node evaluates data attributes determining the path to follow. The decision test compares values against constants. Decision tree classification is by routing from root node till it reaches a leaf node.
3.5.3 Multi Layer Perceptron Neural Networks (MLP NN)
An artificial neural network is a mathematical model based on biological neural networks Neurons are organized into layers. The input layer consists simply of the original data, while the output layer nodes represent the classes. Then, there may be several hidden layers. A key feature of neural networks is an iterative learning process in which data samples are presented to the network one at a time, and the weights are adjusted in order to predict the correct class label.
3.5.4 K Nearest Neighbor (KNN)
The Nearest Neighbor Classification underlying intuitions are straightforward, and examples based on class of nearest neighbor are classified. More than one neighbor is considered and so the technique is usually called k-Nearest Neighbor (k-NN) where k nearest neighbors determines class.
4. RESULTS AND DISCUSSIONS
The output of the various phases of the work is as follows the input image is preprocessed and the feature extraction is done by the gabor filter and WHT the feature selection is done by the PCA and CFS the following classifiers are used for the classification namely naïve bayes,J48,KNN,MLP-NN . The output screen and the various results of the methods are illustrated in figure 2 &3.
A) Input Image B) Enhanced Image
(C) Median Filter (D) Morphological Smoothened
(E) Gabor Filter Image (F) WHT Image
Fig 2: Output Images of Various Methods
[image:4.612.309.523.72.277.2]The following classification accuracy are obtained for the input images.
Fig 3: Screenshot
[image:4.612.306.504.349.652.2]The following classification accuracy are obtained for the input images.
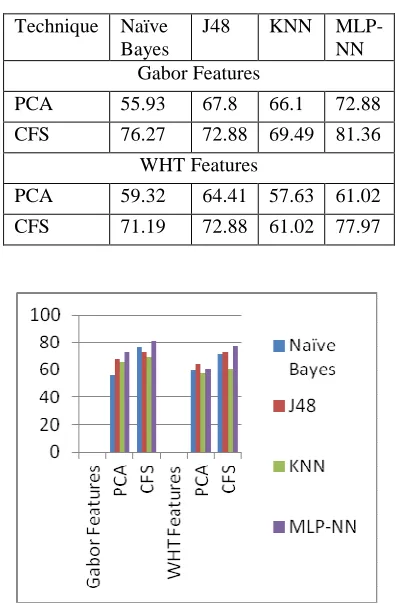
Table 1: Classification Accuracy (In Percentage)
Technique Naïve Bayes
J48 KNN
MLP-NN Gabor Features
PCA 55.93 67.8 66.1 72.88
CFS 76.27 72.88 69.49 81.36
WHT Features
PCA 59.32 64.41 57.63 61.02
CFS 71.19 72.88 61.02 77.97
Fig 4: Classification Accuracy (In Percentage)
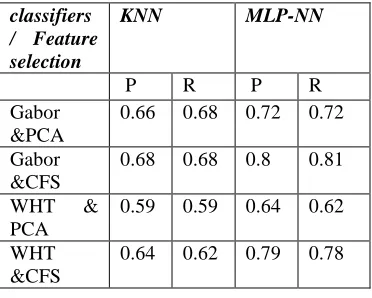
were classified as class x. Precision (P) = tp/(tp+fp) the recall is defined by Recall (R) = tp/(tp+fn) Where tp, fp, tn and fn are true positive, false positive, true negative and false negative respectively.
The table 2,3 represents the precision and recall values of the lung images for the various methods of the feature extraction, selection techniques. The table represents the four combinations of feature selection and the feature extraction methods. In
table 2 precision and recall are calculated
[image:5.612.85.271.264.413.2]for the naïve bayes and the J48 classifiers.
Table 2: Precision,Recall value
Table 3: Precision,Recall value
*P –Precision R-Recall
5. CONCLUSION
In this work the preprocessing of the images are done then the feature extraction is done by Gabor filter, walsh hadamard transform and the feature selection is done by the correlation based feature selection, Principal component analysis and the naïve bayes, decision tree, J48, MLP-NN classifiers are used to train, test and classify and the
performance measure shows that the MLP-NN classifier produces 81.4% than the other classifiers. This works assists in detecting the lung diseases using image processing technique.
ACKNOWLEDGEMENT
We would like to take this opportunity to thank Radiologist Dr.Ramesh Kumar M.D.,(R.D) ,Professor and Head, Department of Radiology Sri Manakula Vinayagar Medical college and Hospital Madagadipet for analyzing the Dicom Images regarding the lung diseases.
REFRENCES:
[1] Kakeda, S. et al., “Improved Detection of Lung Nodules on Chest Radiographs Using a Commercial Computer-Aided Diagnosis System”, American Journal of Roentgenology, 182, February, pp. 505-510, 2004
[2] K. Kanazawa, Y. Kawata, N. Niki et al., “Computer-aided diagnosis for pulmonary nodules based on helical CT images,” Computerized Medical Imaging and Graphics, vol. 22, no. 2, pp. 157–167, 1998. [3] U. Bagci,M.Bray, J. Caban, J. Yao, andD.
J.Mollura, “Computer assisted detection of infectious lung diseases: a review,” Computerized Medical Imaging and Graphics, vol. 36, no. 1, pp. 72–84, 2012. [4] K. Murphy, B. van Ginneken, A. M. R.
Schilham, B. J. de Hoop,H. A. Gietema, and M. Prokop, “A large-scale evaluation of automatic pulmonary nodule detection in chest CT using local image features and k-nearest-neighbour classification,” Medical Image Analysis, vol. 13, no. 5, pp. 757–770, 2009.
[5] S. Iwano, T.Nakamura,Y.Kamioka, andT. Ishigaki, “Computeraided diagnosis: a shape classification of pulmonary nodules imaged by high-resolution CT,” Computerized Medical Imaging and Graphics, vol. 29, no. 7, pp. 565–570, 2005.
[6] S. Iwano, T. Nakamura, Y. Kamioka, M. Ikeda, and T. Ishigaki, “Computer-aided differentiation of malignant from benign solitary pulmonary nodules imaged by high-resolution CT,” Computerized Medical Imaging and Graphics, vol. 32, no. 5, pp.416– 422, 2008.
classifiers / Feature selection
KNN MLP-NN
P R P R
Gabor &PCA
0.66 0.68 0.72 0.72
Gabor &CFS
0.68 0.68 0.8 0.81
WHT & PCA
0.59 0.59 0.64 0.62
WHT &CFS
0.64 0.62 0.79 0.78
classifiers / Feature selection
NaïveBayes J48
P R P R
Gabor&P CA
0.57 0.56 0.68 0.69
Gabor &CFS
0.76 0.76 0.72 0.72
WHT & PCA
0.57 0.57 0.64 0.65
WHT &CFS
[image:5.612.85.265.445.598.2][7] H. Chen, J. Zhang, Y. Xu, B. Chen, and K. Zhang, “Performance comparison of artificial neural network and logistic regression model for differentiating lung nodules on CT scans,” Expert Systems with Applications, vol. 39, pp. 11503–11509, 2012.
[8] T. Kubota, A. K. Jerebko, M. Dewan, M. Salganicoff, and A.Krishnan, “Segmentation of pulmonary nodules of various densities with morphological approaches and convexity models,” Medical Image Analysis, vol. 15, no. 1, pp. 133–154, 2011.
[9] Mitani, Y., Hirayama, H., Yasuda, H., Kido, S., Hamamoto, Y., Ueda, K., & Matsunaga, N. (2000). A Gabor filter-based classification for diffuse lung opacities in thin-section computed tomography images. In Knowledge-Based Intelligent Engineering Systems and Allied Technologies, 2000. Proceedings. Fourth International Conference on (Vol. 2, pp. 780-783). IEEE.
[10] Mohammed, H., Abou-Chadi, F., & Obayya, M. (2011, December). A computer-aided system for classifying computed tomographic (CT) lung images using artificial neural network. In Computer Engineering Conference (ICENCO), 2011 Seventh International (pp. 93-96). IEEE.
[11 ]Uppaluri R, Hoffman EA, Sonka M, Hartley PG, Hunninghake GW, McLennan G,”Computer recognition of regional lung disease patterns” American Journal of Respiratory Critical Care Medicine 1999;160:648–54.
[12] Shyu CR, Brodley CE, Kak AC, Kosaka A, Aisen AM, Broderick L, ASSERT:“A physician-in-the-loop content based retrieval system for HRCT image databases” Computer Vision Image Understanding, 1999;75:111– 132.
[13] Zagers H, VroomanHA,Aarts NJM, Stolk J,Kool LJS, Dijkman JH, et al. “Assessment of the progression of emphysema by quantitative analysis of spirometrically gated computed tomography images”, Invest Radiolology,1996;vol 31,pg:761–767. [14] Kauczor HU, Heitmann K, Heussel
CP,Marwede D, Uthmann T, Thelen M. “Automatic detection and quantification of ground-glass opacities on high resolution CT using multiple neural networks: comparison with a density mask”, American Journal Roentgenol 2000,vol:175,pg:1329–34.
[15] Ribeiro, M. X., Balan, A. G. R., Felipe, J. C., Traina, A. J. M., Traina Jr., C.,” Mining statistical association rules to select the most relevant medical image features” , First International Workshop on Mining Complex Data (IEEE MCD’05), Houston, USA, IEEE Computer Society, 2005, pg. 91–98.
[16] Uppaluri R, Hoffman EA, Sonka M, Hartley PG, Hunninghake GW, McLennan G,”Computer recognition of regional lung disease patterns” American Journal of Respiratory Critical Care Medicine 1999;160:pg:648–655.
[17] A. Jain and D. Zongker, “Feature Selection: Evaluation,Application, and Small Sample Performance”, IEEE Transactions on Pattern Analysis and Machine Intelligence, 1997, Vol. 19, No. 2, pp. 153-158.