Time-resolved infrared imaging and
spec-troscopy for engine diagnostics
intake charge due to atmospheric humidity, it is found at hig-her temperature and concentration (both of which yield stron-ger emission) in the volume where combustion has occurred. The significant increase in water concentration (due to a peak water production rate of ~15x10-3 mol/[cm3-s] for a laminar, stoichiometric, methane/air premixed flame) and in tempera-ture (~4-fold for a laminar, stoichiometric, methane/air premi-xed flame) across the thickness of the flame front, a distance of approximately 0.5 mm [11], allow water to serve as a proxy for the location of the flame front and burned-gas region [12-15]. Finally, infrared imaging can provide spatially resolved temperature measurements, though thermography is not di-scussed here.
Not all IR bands are equally useful. The near infrared band (NIR, 0.7-1.4 µm) offers a performance/price ratio only slight-ly worse than the visible band but onslight-ly offers access to emis-sion lines of water. The short-wavelength infrared (SWIR, 1.4-3 µm) is somewhat less mature but offers stronger water lines and lines of carbon dioxide, as well as imaging and thermo-graphy of objects at some higher combustion-relevant tem-peratures. The mid-wavelength infrared (MWIR, 3-8 µm) inclu-des stronger water, carbon dioxide, carbon monoxide, and hydrocarbon lines as well as the opportunity for imaging/ther-mography of objects at lower combustion-relevant tempera-tures. The long-wavelength infrared (LWIR, 8-15 µm) provides imaging/thermography of objects at body temperature or room temperature (and is thus also known as the thermal band), making the LWIR less useful for combustion research. In this paper, we present two experiments demonstrating how NIR/SWIR imaging and spectroscopy can provide critical in-formation for both fundamental and applied combustion re-search.
• The first, fundamental experiment was centered on time-re-solved, in-cylinder, IR emission spectroscopy and shows the promise of this technique. The main advantage of this dia-gnostic is the combination of the broad wavelength range measured and sufficiently fine spectral resolution to provi-de simultaneous, species-specific information, giving a bro-ad understanding of the molecular rbro-adiation. This combi-nation can provide detailed information about intra- and trans-cylinder radiative heat transfer and can also be used for validation of simulated spectra reaching the wall, simil-ar to those reported by Fernandez et al. [16]. Further, the addition of simultaneous NIR/SWIR imaging provided infor-mation about the spatial evolution of the flame kernel. • The second, applied experiment was centered on
high-speed NIR/SWIR borescopic in-cylinder imaging, which was used to evaluate the effect of two ignition systems on fla-me-kernel growth and cycle-to-cycle variation (CCV).
1.1 Spectroscopy for Fundamental
He-at-Transfer Research
Heat transfer in internal-combustion engines (ICEs) has been studied since the 1920s in an effort to increase engine efficien-cy [17]. The amount of energy lost to the efficien-cylinder walls, piston surface, and the head of the engine is significant, and produc-tion engines are designed to reduce this energy loss [18]. Ef-ficiency can be increased by running at higher pressures.
Abstract
Molecular emissions in the infrared spectral region can provi-de access to a range of quantities that are of interest in inter-nal-combustion engine research and development. Molecu-les; such as water, carbon dioxide, carbon monoxide, and hydrocarbons; provide the strongest signals in the range from 1.0 to 5.5 µm. We describe several imaging experiments that employed high-frame-rate infrared cameras to capture spec-trally resolved and specspec-trally integrated signals from both op-tical and production engines. Spectrally resolved infrared emis-sions that were recorded at kHz rates (i.e., crank-angle steps) in an optically accessible, propane-fueled, single-cylinder en-gine are used to guide the development and validation of a radiative-emission model that is integrated into large-eddy si-mulations (not discussed in this paper). The emissions were dispersed with a spectrometer, and the spectra were recorded with an InSb camera. Clear spectral signatures from water and carbon dioxide were recorded, and the spectra reveal the evo-lution of combustion through each of 100 consecutive cycles for each engine run. Furthermore, at any wavelength of these spectra, cycle-to-cycle variation can be extracted readily. Cy-cle-to-cycle variation was of particular interest in a study of a production heavy-duty engine fueled by natural gas.The ad-dition of two borescopes outfitted with high-frame-rate In-GaAs cameras enabled spectrally integrated measurements from 1.0-1.7 µm. The images allow cycle-resolved observations of ignition and flame growth. The intent of this work was to identify and quantify the impact of a range of ignition systems on lean and/or dilute operation limits from a combustion de-velopment and stability point of view.
1 Introduction
the transient emissions of SI engine gases during combusti-on, and it has the unique ability to be translated to capture the spectrum at different spatial locations within the combus-tion chamber. Addicombus-tionally, the technique can be adapted to provide one dimension of spatial information, i.e., line ima-ging, in addition to spectral information. High-speed, time-re-solved diagnostic techniques performed in the visible and ul-traviolet bands can be used to study temperature, equivalence ratio [33], turbulence, CCV [34, 35], and other pa-rameters. These techniques, however, cannot directly provide information about radiative heat transfer. The work presented here is based on the premise that time-resolved IR spectros-copy of molecular radiation reaching the walls in an optically accessible engine can enable a better understanding of radi-ative energy redistribution and how this radiation affects other engine parameters.
1.2 Imaging for Applied Ignition Research
Leaner air/fuel mixtures are desirable for improved efficiency in SI engines, due to better thermodynamic properties of the mixture, reduced pumping work, lower heat losses from lower burned-gas temperatures, and the higher compression ratios that can be reached without knock. However, leaner mixtures require higher ignition energy and some method of accelera-ting the flame growth so that combustion can be completed during the time available. In order to address these require-ments, Quader [36] defined two limiting parameters [37]: (i) the flame-initiation (or ignition) limit and (ii) the partial-burn li-mit. The first limit marks the threshold at which ignition fails, and it is affected by flame-quenching factors, such as charge dilution, mixture motion, mixture temperature, compression ratio, and spark energy, as well as the spark plug’s heat ran-ge, extension, and gap. The second limit marks the boundary where the flame-propagation speed becomes too low to com-plete combustion after the mixture is ignited, and it is affec-ted by charge dilution, mixture temperature, mixture turbu-lence, and the location and geometry of the spark. Ignition timing must be selected based on both of these limits. Ad-vanced spark timing prevents partial burns by providing more time for the flame to propagate, but it also leads to more mis-fires, especially in leaner mixtures, since the temperatures and pressures early in the cycle are not high enough for flame in-itiation, and the turbulence level quenches the flame kernel. On the other hand, retarding the spark timing reduces the mis-fire risk, but it also reduces the available time for flame pro-pagation and hence makes the combustion more susceptib-le to partial burn. Operating in the stabsusceptib-le-combustion zone located between the flame-initiation and partial-burn limits becomes increasingly challenging as the mixture becomes le-aner or more dilute or the combustion chamber becomes lar-ger.
Some advanced ignition systems try to overcome the ignition limit by increasing either their output energy (e.g., dual-coil ignition [38, 39], Controlled Electronic Ignition [40]) or the ef-fectiveness of the spark-to-gas energy transfer (microwave-as-sisted spark ignition [41, 42], high-frequency corona ignition [43-45], nanosecond-pulsed transient-plasma ignition [46, 47], breakdown ignition [37], laser ignition [48]). Some systems Unfortunately, higher pressures increase the gas
tempera-tures, which in turn yields increased heat loss and formation of NOx, a tightly regulated pollutant. Fortunately, NOx pro-duction can be mitigated through the addition of exhaust gas recirculation (EGR). EGR consists mostly of inert exhaust gases (H2O and CO2) that reduce the peak in-cylinder
tem-perature and thus the formation of NOx [19]. These gases are strong emitters and absorbers in the infrared band, and radiative energy redistribution could lead to changes in local temperatures of tens of K [20].
The role of radiation is considered differently in compressi-on-ignition (CI) and spark-ignition (SI) engines. In CI engi-nes, the soot particles created during combustion have been studied as blackbody sources causing radiative heat loss to the walls [21-23]. However, recently, the application of ac-curate radiative transfer equation solvers for a CI engine sho-wed that the combined infrared emissions of H2O, CO2, and
CO can be higher than those of soot and that a significant fraction of this radiation is reabsorbed before reaching the walls [20]. In SI engines, because of the absence of soot, ra-diation has historically been considered to have little impact on heat transfer within the combustion chamber [18, 24]. Ho-wever, the effects of added EGR to mitigate the negative consequences of higher operating pressure suggest that ra-diative heat transfer could be relevant to SI combustion. Th-erefore, accurate predictive models are needed to enable quantitative consideration of radiative heat transfer in ad-vanced engine simulations [25]. Supporting the design and validation of such models requires adequate experimental data, which is sparse for the infrared band, in combination with other well-characterized data, for a comprehensive ana-lysis of an SI engine.
The IR band and its relevance to combustion have been spec-troscopically studied since the late 1800s [26] in order to bet-ter understand and control combustion. The IR band is the most relevant for assessing the redistribution of radiative energy within the combustion chamber and the transfer of energy to the walls. The strongest molecular emission lines of H2O, CO2, and CO are located in the NIR, SWIR, and
MWIR [7-10]. A simulation of the IR emission of gases pro-duced in SI combustion based on the High-Resolution Trans-mission Molecular Absorption Database (HITRAN) showed that over 80% of H2O and CO2 emissions occur within the
1.0-5.5 µm band [27]. Additionally, as mentioned, the black-body emission of soot is brighter in the IR than in the visib-le. Although soot is a greater concern in CI engines than in SI engines, the trend toward direct injection in SI engines means that soot and its radiation is increasingly relevant to SI combustion and heat transfer.
2.1.1 Optically Accessible Engine
The engine is the third-generation Transparent Combustion Chamber (TCC-III) engine, which has been described in detail elsewhere [20], [56]. This engine has a simple pancake cham-ber with bore x stroke of 92 mm x 86 mm, two valves, and a geometric compression ratio of 10:1. The engine was run on a homogeneous and stoichiometric propane/air mixture at 500 rev/min with pressure in the intake and exhaust plenums of 40 and 101.5 kPa, respectively. The ignition timing was -18 degrees after top dead center firing ( aTDC). The in-cylinder pressure was measured with a pressure transducer (Kistler 6125C12) every 0.5 crank-angle degrees (CAD).
A fused-silica cylinder (Rodriguez Consulting) provides opti-cal access. The transmission of fused silica varies according to the manufacturing process, so the transmission was measu-red (Figure 2) using the spectroscopy setup and a blackbody source (Electro Optical Industries LES800-04) with a known emission spectrum. Although the cylinder transmits well across the visible, NIR, and SWIR bands, there is strong attenuation from around 2.75 μm and beyond 4.0 μm. As a result, the sig-nal recorded in these bands was weak, and correcting recor-ded signals for these (low) measured transmission values pro-duced unreliable results for the emission inside the cylinder. In order to avoid these regions, the work presented here only includes wavelengths shorter than 2.5 μm.
attempt to overcome the partial-burn limit by some combina-tion of increasing the flame-propagacombina-tion rate (microwave-as-sisted ignition [49, 50]) or reducing the flame-travel distance within the cylinder (multi-plug ignition [51], high-frequency co-rona ignition [45, 52, 53], nanosecond-pulsed transient-plas-ma ignition [46, 47]).
High-frequency corona ignition addresses both limits and is of particular interest. This technology uses bursts of a sinu-soidal electric field with a MHz carrier frequency and a MV/m amplitude to produce plasma streamers from several fine elec-trode tips. The period of the MHz carrier, on the order of 1 μs, does not give the ions and electrons in the plasma time to thermally equilibrate during each carrier cycle, so the elec-trons are heated to a much higher temperature than the ions [54]. This process repeats for each cycle in the burst, so the temperatures of the ions and electrons never equalize. Such a plasma is said to be nonthermal, nonequlibrium, or transi-ent. The electrons are more effective than the ions at initiating the chain-branching reactions of combustion [55]. Thus, less ignition energy is wasted in heating the ions, and energy is more efficiently used to initiate combustion, which addresses the flame-initiation limit. Each electrode tip produces a stre-amer many millimeters long, and a wrinkled kernel forms along each streamer. As a result, the total flame volume just after ig-nition is much larger than for conventional igig-nition, the fla-me-travel distances are reduced, and the wrinkled flame tra-vels at a higher speed, all of which address the partial-burn limit.
In this document, we compare the ability of conventional and high-frequency corona systems to ignite both stoichiometric, minimally diluted NG mixtures and lean, dilute NG mixtures in heavy-duty (HD) applications. The goals of this work were to determine if combustion stability at the lean operating li-mit could be improved and to understand the mechanism of any such improvement. The two ignition systems produce plas-mas with very different spatial and temporal evolution. There-fore, direct visual observation of the ignition and flame kernel growth is of interest in this study. While optically accessible engines provide the best view of the combustion chamber, optical engines limit the peak pressure and engine speed that are attainable. Borescopes provide much more restricted ac-cess, but they can be installed in a production engine and can withstand the peak pressures reached therein. It was critical for this project to replicate real-world pressures and engine speeds, so borescopic access was chosen.
2 Setup and Procedure
2.1 Spectroscopy for Fundamental
He-at-Transfer Research
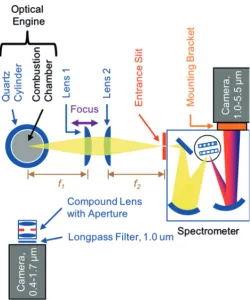
[image:4.595.313.564.83.384.2]The experimental setup, as illustrated in Figure 1, was used for measurements in an optically accessible engine. Spectros-copy was performed by the lenses, spectrometer, and came-ra shown on the right; imaging was performed by the com-pound lens, filter, and camera on the bottom.
background emission. Finally, the eight pixels in each column of each frame were averaged to reduce noise and create a fi-nal spectrum measuring 188 x 1 pixels.
The camera used for imaging (Xenics Cheetah-640-CL with VisNIR option) has 640 x 512 monochrome pixels with 12 bits of depth, and it is sensitive to wavelengths between 0.4 and 1.7 μm (though maximum sensitivity occurs between 1.0 and 1.6 μm). In order to better match the spectral range of the spectroscopy camera, a 1000-nm long-pass filter (ThorLabs FELH1000) was inserted between the lens (Navitar SWIR-35) and camera. The camera can operate at up to 865 Hz in full-fra-me mode. Unlike the spectroscopy cafull-fra-mera, this cafull-fra-mera was not windowed, so custom electronics were used to extract every fourth trigger, producing images at 4-CAD resolution (giving a frame rate of 750 Hz) from -150 to +180 aTDC. This camera’s images were processed according to the procedure outlined in Section 2.2.3 [58, 59].
Synchronization and triggering was accomplished with a timing unit (LaVision HSC, programmed with a Windows computer running LaVision DaVis 8). One-per-cycle and 7200-per-cycle encoder signals were provided to the timing unit. Images were acquired from the cameras with manufacturer-supplied soft-ware (Xenics Xeneth).
2.2 Imaging for Applied Ignition Research
Previous studies with a different research focus used the same experimental setup and image-processing procedure [58, 59]; thus the setup will be briefly summarized here.
2.2.1 Engine and Calibration
The test engine was a Weichai WP10NG, a turbocharged in-line six-cylinder engine with a bore x stroke of 126 mm x 130 mm, two valves per cylinder, and central-point injection of na-tural gas (NG). This engine had a separate cast-steel head for each cylinder, each equipped with an in-cylinder pressure trans-ducer (AVL GH13P). The intake/exhaust plumbing was modi-fied to enable high-pressure exhaust-gas recirculation. Two ig-n i t i o ig-n s y s t e m s w e r e t e s t e d : a c o ig-n v e ig-n t i o ig-n a l inductive-discharge ignition system delivering 65 mJ of ener-gy to each spark event and a high-frequency corona ignition system (BorgWarner EcoFlash). For each operating point, the spark timing was adjusted to position the crank angle at which 50% of the mass fraction of the fuel has been burned, MFB50, at approximately 9 aTDC. (In this document, MFBx refers to the crank angle at which x% mass fraction of the fuel has been burned.) This target value was determined by earlier spark-timing sweeps at various operating points as the MFB50 that minimized brake specific fuel consumption.
2.1.2 Cameras and Optics
[image:5.595.44.288.80.254.2]Two CaF2 plano-convex lenses (focal length = 250 mm) were used to focus the light from the combustion chamber onto the spectrometer’s entrance slit. The focal point was ~10 mm below the center of the cylinder head, where the spark plug is located. The spectrometer (McPherson Model 2035) had a 350-mm focal length on the input mirror. An output mirror with a 400-mm focal length was selected to place the output image on the camera sensor when the camera was mounted via a custom bracket to the spectrometer’s output port. All of the spectrometer’s mirrors were gold-coated to provide the best reflection across the wide range of wavelengths investigated. The spectrometer was equipped with two turret-mounted gra-tings (Richardson), but only the grating blazed at 4.0 μm with a density of 11.5 groove/mm was used for these experiments. The high-speed IR camera used with the spectrometer (Xenics Onca MWIR InSb 320 with broadband option) has an InSb sen-sor with 320 x 256 pixels sensitive from 1.0 to 5.5 μm. The ca-mera records at 460 Hz full frame, but for the current experi-ments, the camera was windowed to 320 x 8 pixels, allowing frame rates up to 3.5 kHz. A two-brightness nonuniformity cor-rection was performed using an integrating sphere (Electro Optical Industries ISV-400S), though an aperture inside the ca-mera partially blocks 132 pixels, some on each side of the sen-sor; signals from those pixels were discarded. The spectral sensitivity of the spectrometer/camera system was measured using a blackbody source (Electro Optical Industries LES800-04), and the result was used to correct the measured spectra. A wavelength calibration was performed using a xenon lamp (Newport 6033). The IR transitions of xenon [57] were used to establish a wavelength-to-pixel mapping for each recorded spectrum. For each measurement, spectra were recorded every 1.0 CAD (giving a frame rate of 3.0 kHz) from -150 to +180 aTDC for 100 continuous cycles. For each experiment, an aver-age background imaver-age was recorded immediately before the data images with the same imaging parameters as the data images but without firing the engine. The background image was then subtracted from each data image to correct for
Figure 2. The measured transmission of the fused-silica cylinder. The low transmis-sion near 2.75 μm and above 4.0 μm lead to the work described here being
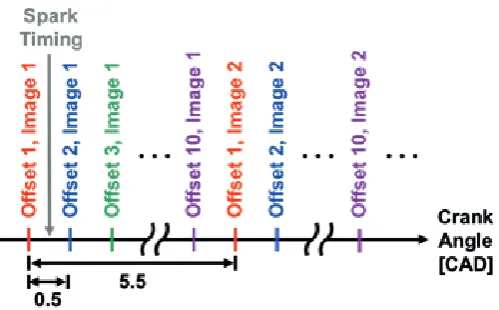
each “offset” cannot simply be interleaved to fill in the gaps in the imaging, due to CCV. However, the 100 cycles from each offset can be used to provide statistical information at 0.5-CAD intervals, as described below. During each cycle, images were recorded from just before spark timing to the point at which the FoV was nearly filled. Only data between spark timing and MFB00.5 is reported here.
2.2.4 Image Processing and Analysis
The image processing and analysis, performed with a combi-nation of LaVision DaVis 8 and MathWorks MATLAB R2014b, has been described in detail and illustrated elsewhere [58, 59]. First, a background image recorded immediately before igni-tion was subtracted from each image, reducing noise. A me-dian filter with a 3x3-pixel window was applied to smooth the image while preserving the edges. Some reflections from the piston were still visible, despite the matte black coating. To reduce these reflections, Otsu’s thresholding method [60] was applied, creating a binarized image. The filtered image was multiplied by the binarized image to create the final image.
2.2.2 Optical Access and Imaging
Equip-ment
Cylinder 6, the most accessible cylinder, was modified to pro-vide optical access for two cameras, as illustrated in Figure 3; two borescope sleeves were installed in the head, and reliefs were cut into the top of the piston to provide clearance. To re-duce reflections of light prore-duced by the flame, the piston top and head were painted with flat black high-temperature coa-ting (VHT Flameproof). The results presented here were all selected from Camera 1 (Xenics Cheetah, as described in Sec-tion 2.1). The borescopes (AVL TKSASTA.01) measure 7 mm in outside diameter and provide an angular field of view (FoV) of 70°. The borescopes were cooled with air at six-bar
pressu-re that was filtepressu-red to pressu-remove particles that could clog the coo-ling channels. The borescopes were protected from combus-tion heat and pressure by sapphire windows. The borescopes transmit light from visible, NIR, and SWIR but their focus is op-timized over 1.0-1.7 μm; a 1.0-μm long-pass filter was inserted between the borescope and camera to provide the clearest images. The FoV of the borescope did not fill the camera sen-sor, and thus the camera was windowed to 384 x 336 pixels to enable higher frame rates. The camera was fixed in place by a combination of commercial (AVL) and custom-fabricated bra-ckets. One-per-cycle and 1440-per-cycle signals were input to a timing unit (LaVision PTU-X, operated with LaVision Davis 8), which triggered the cameras.
2.2.3 Data and Image Acquisition
[image:6.595.90.514.255.359.2]The operating points discussed here are shown in Table 1. All four points were measured at 1000 rev/min with a 6.8-bar in-dicated mean effective pressure (IMEP) in Cylinder 6. Two air/ fuel/EGR mixtures were tested for each igniter. The EGR valu-es of 3% were measured with the EGR valve closed and repre-sent the minimum attainable. This nonzero value resulted from residual in-cylinder gases and possibly from exhaust-gas lea-kage past the EGR valve. At each operating point, the in-cylin-der pressure and images were recoded over a 100-cycle peri-od. Images were recorded at intervals of 5.5 CAD (a frame rate of 1.09 kHz). To provide more finely time-resolved informati-on, ten measurements were made for each operating condi-tion, each with the timing of the first image offset by a multi-ple of 0.5 CAD, as illustrated in Figure 4. The images from
Figure 3. The experimental setup used with the production engine. Only images from Camera 1 are discussed.
Ign
iti
on
S
ys
te
m
A
ir
/F
ue
l E
qu
iv
. R
at
io
[]
E
G
R
[%
]
Spa
rk T
im
ing
[
°
aT
DC]
m
ea
n(
MF
B
00 .5)[
°
aT
D
C]
Ig
ni
tio
n De
la
y [
CAD]
Co
m
b.
Du
ra
tio
n [
CAD]
C
oV
(I
M
E
P) [%
]
Conventional 1.0 3 -18.75 -2.51 16.5 15.2 0.3
1.6 10 -52.50 -6.11 47.1 34.1 3.0
Corona
1.0 3 -13.35 -2.01 11.7 15.0 0.4
1.6 10 -35.10 -7.85 27.7 30.7 1.9
Table 1. Engine operating conditions and parameters measured. Engine speed was 1000 rev/min; IMEP was 6.8 bar. Cases with 3% EGR occurred with
[image:6.595.317.539.580.760.2]has a larger radius of gyration would be expected to have a higher ratio of area to volume, in other words to be more stret-ched or wrinkled, and to burn more quickly. Different radii of gyration are illustrated in sample binarized flame images in Fi-gure 5.
The collection of all the images recorded at a given crank ang-le during each 100-cycang-le measurement is calang-led a “subset” in this document. Each subset of thresholded images was aver-aged, creating a mean image for each crank angle. The stan-dard deviation of all the binarized images in select subsets was computed; the binarized image was chosen as the sour-ce of this calculation in order to avoid complications due to saturation. Using the binarized images also yielded stan-dard-deviation images that were automatically normalized to a scale of 0-0.5. A number of quantitative metrics were com-puted from the images, as described below.
The total integrated image signal, S, was defined as the sum of the counts in all pixels of a thresholded image. S, being es-sentially the total brightness of the flame in the 1.0- to 1.7- μm band, should be strongly dependent on the temperature and concentration of water in the flame. It is therefore expected that S should be correlated with the timing of major combus-tion landmarks.
The area moment of inertia (also called the second moment of area), I, was computed by the formula below for an MxN-pi-xel image, where cm,n is the piMxN-pi-xel intensity at mth row and nth column and (xc, yc) is the centroid location. I is a measure of how much “mass” (number of pixels weighted by signal strength) a flame image has and how far that mass is from the centroid.
[image:7.595.40.290.80.235.2]Because very different shapes can have the same area and the same moment of inertia, the radius of gyration, rgyr, was com-puted by the below formula from I and the total projected area of the flame, A, in order to quantify the differences in flame shape. The radius of gyration is the radius of a point mass with the same I as the flame in the image; it is equal to the root-me-an-square distance of each pixel (weighted by its brightness) from the centroid. For objects in general, rgyr is a measure of how compact or extended the object is. A circle has a small radius of gyration, while a rectangle of the same area with an aspect ratio of, e.g., 10:1 has a larger rgyr. A flame whose image
Figure 4. An illustration of the crank angles at which images were recorded. Images from each subset were recorded in a single 100-cycle measurement.
Suc-cessive subsets were recorded in sucSuc-cessive measurements moments later.
𝐼𝐼𝐼𝐼 = � � 𝑐𝑐𝑐𝑐
𝑚𝑚𝑚𝑚,𝑛𝑛𝑛𝑛× [(𝑚𝑚𝑚𝑚 − 𝑦𝑦𝑦𝑦
𝑐𝑐𝑐𝑐)
2+ (𝑛𝑛𝑛𝑛 − 𝑥𝑥𝑥𝑥
𝑐𝑐𝑐𝑐)
2]
𝑀𝑀𝑀𝑀𝑚𝑚𝑚𝑚=1 𝑁𝑁𝑁𝑁
𝑛𝑛𝑛𝑛=1
[image:7.595.322.538.138.752.2]𝑟𝑟𝑟𝑟
𝑔𝑔𝑔𝑔𝑔𝑔𝑔𝑔𝑔𝑔𝑔𝑔= �𝐼𝐼𝐼𝐼 𝐴𝐴𝐴𝐴
�
Figure 5. Binarized flame images illustrating different radii of gyration. For fla-mes with the same area (top and middle), flafla-mes that are more spatially dis-persed (middle) have higher rgyr values. When both flames are similarly
sha-ped (top and bottom), larger flames (bottom) have higher values of rgyr. The
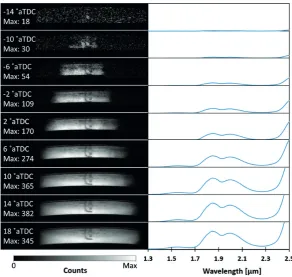
subsets or “slices.” For example, a subset of constant crank angle gives the emission spectrum at the crank angle. A sub-set of constant wavelength gives the time-dependent emissi-on at that wavelength. The molecular species and vibratiemissi-ons can be identified from the emission spectrum and are visible in the figure. The spectroscopic range discussed in this paper, 1.3-2.5 µm, contains four water vibrations and two carbon-di-oxide vibrations [13], as labeled in Figure 7. The low-amplitu-de feature at 1.3-1.7 µm is due to the υ1 + υ3 and 2υ2 +υ3
vi-brations of H2O. The central feature at 1.7-2.2 µm is due to the
υ2 +υ3 H2O vibration as well as the 4υ2 + υ3 and υ1+ 2υ2 + υ3
CO2 vibrations. Finally, the feature past 2.4 µm is the
begin-ning of the very strong υ3 H2O vibration.
Figure 8 was produced by computing the average and stan-dard deviation (over all 100 cycles) of the spectrally integra-ted (over the entire wavelength range) emission at each crank angle. Four combustion landmarks are indicated by vertical lines. This plot illustrates how the flame emission evolves du-ring a combustion cycle. Note that the peak emission occurs near MFB90 and that the standard deviation of the integrated emission, which is one measure of cycle-to-cycle variability, is greater before peak emission than after. This connection bet-ween the burn fraction and the molecular emission demons-trates the importance of the radiative heat released during Each borescope contains a fish-eye lens at its tip, which
pro-vides a wide FoV but also distorts the images. As a result, ca-librating the spatial dimensions, so that distances (e.g., rgyr)
can be reported in mm rather than in pixels, is not as simple as applying a linear pixel-to-mm scaling. Instead, three-dimen-sional dewarping must be performed. That processing has not yet been done, and all distances were calculated in pixels. It is expected that proper dewarping, once performed, will only strengthen the relationships between the image-derived and pressuderived metrics, so the conclusions drawn here re-main valid even without calibration.
It was not reasonable to compare the image-based metrics for different operating conditions at the same crank angle, sin-ce the flame development at a given crank angle would vary between conditions. Likewise, a fixed crank-angle delay rela-tive to the spark timing was not suitable. For this document, the mean MFB00.5 in Cylinder 6 for a given operating
conditi-on, labeled mean(MFB00.5) here, was chosen as the time at
which the image-based measurements would be computed for correlation with metrics derived from the Cylinder 6 pres-sure transducer. This timing provided a more consistent level of flame development and ensured sufficient delay between the image- and pressure-based measurements for the results to be of interest. The symbol R(x, y) is used in this document to represent the Pearson correlation coefficient between two metrics, x and y.
In order to compare images at multiple crank angles for diffe-rent operating conditions, it was necessary to determine “nor-malized crank angles” at which flame development was com-parable across conditions. Six crank angles evenly spaced between spark timing and mean(MFB00.5) were computed for
each condition, and these crank angles were labeled ϴx/5
whe-re x indicated the fraction of angle between spark and me-an(MFB00.5), as shown in Figure 5.
3 Results and Discussion
3.1 Spectroscopy for Fundamental
He-at-Transfer Research
[image:8.595.310.560.233.369.2]Figure 7 shows an example three-dimensional dataset pro-duced by the spectrometer/camera setup. For clarity, this plot shows only 10 of the 100 cycles recorded; each cycle includes spectra from -150 to +180 aTDC. This dataset can be presen-ted in several informative ways by displaying two-dimensional
Figure 6 The normalized crank angles, ϴx/5, at which images from different conditions were compared.
[image:8.595.313.556.414.592.2]Figure 7. A three-dimensional IR emission dataset produced by the spectroscopy setup.
[image:8.595.49.281.486.572.2]correlation for both wavelengths occurs for MFB10, which has
a mean location of –3.82 CAD. The higher the spectral power is at TDC the faster the combustion event occurs, hence the negative correlations with all MFBx. The peak spectral power
also correlates well with the peak in-cylinder pressure with a Pearson correlation coefficient R of 0.874 and 0.854 at 1.62 and 1.90 µm, respectively. Therefore, this diagnostic shows sensi-tivity to both the combustion speed and in-cylinder pressure.
The data plotted in Figure 10 were examined to identify the wavelength at which IR signals are best correlated to combus-tion parameters. The top three curves show the correlacombus-tions for spectral power measured at -10 °aTDC; the bottom three are for measurements at 0 °aTDC. The correlations at -10 °aTDC are lower because the flames are not yet fully developed; the early IR emission alone is not a good predictor of MFBx. Ho-wever, the highest correlation for the measurements at -10 °aTDC is with early MFBx values, showing that the early flame development is well captured by this measurement. The ear-ly flame development dictates how quickear-ly the flame will burn and the peak pressure it will produce. At 0 °aTDC, the flame is well developed, and therefore the combustion speed is al-ready well defined, making the correlations even stronger. Even though the correlations drop for signals at wavelengths below 1.4 µm, recording signals with the Cheetah camera at wavelengths above 1.0 µm provides a good compromise bet-ween highest correlation and image quality.
Figure 11 shows that there is a strong negative correlation bet-ween spectral power measured at 1.62 µm and at 1.90 µm and IMEP. This trend shows that there is valuable information about the engine operation and its variability in the emission spec-trum. For example, if the signal at TDC is high, IMEP will be lower for that cycle; this result is due to the fast combustion— compare to Figure 9 for the relationship between IR emission and MFBx—and earlier peak pressure. The TCC-III engine is
optimized to have a slower combustion, so the correlation de-monstrates that if there is higher signal at TDC the peak pres-sure will be reached too soon and the IMEP will be negatively affected. The correlation between IMEP and IR signals at 1.62 combustion; the rising edge of the emission curve maps to
the MFB values, and the overall curve shows the timescale over which significant radiative heat transfer occurs. The rela-tionships between these landmarks and emission peaks are further investigated in Figure 9, where a strong correlation bet-ween MFBx and the measured spectral power is shown.
The two plots in Figure 9 show the correlation between seve-ral MFBx values (MFB10, MFB50, and MFB90) and the spectral
[image:9.595.48.293.156.657.2]power at 0 °aTDC (top dead center, TDC). The correlation is consistently high for 1.90 µm and 1.62 µm, and correlates well with the three combustion milestones; the strongest
Figure 9. MFB10, MFB50, and MFB90 of each cycle correlate well with spectral
[image:9.595.312.559.181.358.2]pow-er at 0 °aTDC measured at both 1.62 µm and 1.90 µm. The correlations with early MFBx values are stronger than those with later ones.
Figure 10. The correlation coefficient of MFBx (for x = 10, 50, and 90) and spectral
power at a given crank angle plotted against the wavelength at which the spectral power was measured. The bottom three curves, corresponding to spectral-power
µm and at 1.90 µm are about the same. In the following, the flame development is explored further through a combinati-on of spectroscopy and imaging. In these experiments, the 1.3-1.7 µm region falls within the sensitivity range of both ca-meras. Combining spectroscopy and imaging allows spectral and spatial features of the flame to be linked.
Figure 12 shows sample images and spectra recorded simul-taneously by the Cheetah and Onca cameras, respectively, at nine crank angles during a single combustion cycle. As the fi-gure illustrates, the early flame development is captured both spatially and spectrally. The maximum image brightness and peak spectral power in Figure 12 occur at 14 oaTDC; at this time the flame has reached the cylinder wall. The signal from the Cheetah camera was summed over the clearance volume for each measured crank angle degree and compared with the total spectral power from the Onca spectra integrated over the 1.3-1.7 µm region at the corresponding crank angle. The results shown in Figure 12 demonstrate a very high correlati-on of R=0.996, verifying that the two measurements are cor-rectly synchronized.
3.2 Imaging for Applied Ignition Research
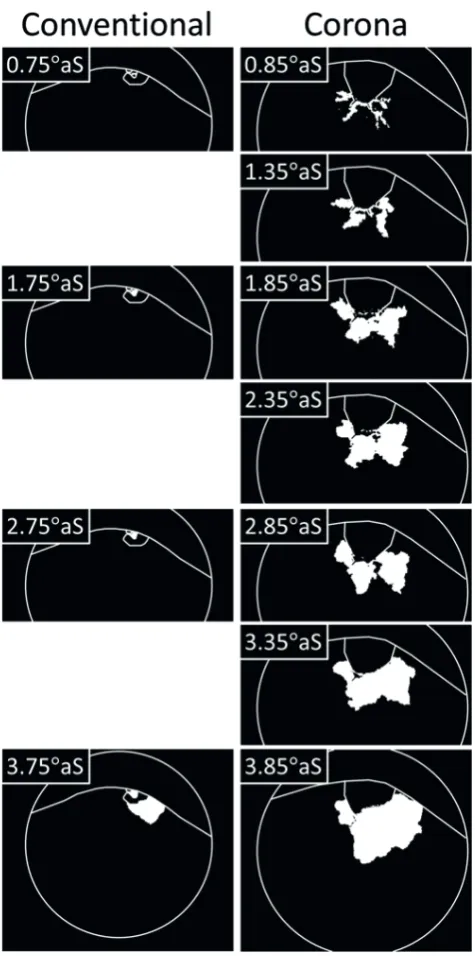
Having now established the functionality of IR imaging in the NIR/SWIR band the following section describes the results of borescopic imaging in this band that was performed to study ignition in an HD engine. Figure 14 shows images recorded by Camera 1 at several crank angles for both ignition systems at a single operating condition: engine speed = 1000 rev/min, IMEP = 6.8 bar, λ = 1.0, and 3% EGR. Because the conventio-nally ignited flames grew more slowly than those ignited by the corona system, the timing offset between measurements was 1.0 CAD for the conventional system and 0.5 CAD for the corona system. Additionally, because the ignition timing was
[image:10.595.317.549.314.534.2]Figure 11. The IMEP of each cycle correlates well with the power measured at 1.62 µm and at 1.90 µm.
Figure 12. Images and spectra recorded simultaneously at nine crank angles within a single en-gine cycle.
Figure 13. The spatially integrated (over the clearance volume only) signal recor-ded by the imaging camera correlates very strongly with the spectrally integrated
[image:10.595.6.299.478.755.2]Figure 15 shows the standard deviation of the binarized images at five normalized crank angles (ϴ1/5 through ϴ5/5) for all four igniter/mixture combinations. One condition is stoichiomet-ric with minimal (3%) EGR; the other is lean with 10% EGR. In these figures, which are false-colored according to the scale shown on the right, the band of bright (yellow) pixels repre-sent the cycle-to-cycle variation in the flame boundary; wider bands indicate more CCV. Comparing the first column to the third and the second to the fourth reveals the bright (yellow) band is wider for the lean/dilute mixture for each igniter, indi-cating greater CCV for that mixture. Comparing column one to column two and column three to column four shows that the bright band is wider for the conventional system, again pointing toward greater CCV with that system. These results agree with the pressure-based measurements of CoV(IMEP), which are reported in Table 1.
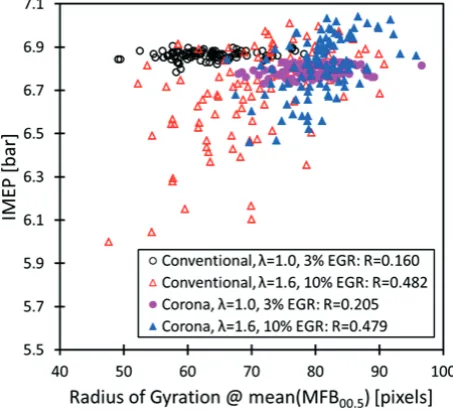
Figure 16 shows how the shape of the very early flame kernels has an impact on the highly diluted flames but not the stoichi-ometric ones, as evidenced by the correlation between the ra-dius of gyration measured at mean(MFB00.5) and the
eventu-al IMEP of that cycle. This plot includes data from 100 cycles for each of the four igniter/mixture combinations. For both ig-niters, combustion of the stoichiometric, minimally diluted mixture is robust under variation in rgyr. In other words, the
shape of the very early kernel has little impact on the combus-tion efficacy of each cycle, leading to very small Pearson cor-relation coefficients. By contrast, for both igniters, combusti-on of the lean, dilute mixture was very sensitive to variaticombusti-on in rgyr. Different kernel shapes resulted in different IMEPs,
lea-ding to significant correlations. Note that the sensitivity of the igniters to the early-kernel shape are very similar, as indicated by the similar correlation coefficients: 0.482 for the conventi-onal system, 0.479 for corona.
Figure 17 presents a series of correlation plots showing the re-lationship between the radius of gyration measured at me-an(MFB00.5) and MFBx (for x = 5, 10, 50, 90) for 100 cycles for
all four combinations of air/fuel mixture and igniter. For all four combinations and all four values of x, a negative correlation with magnitude of at least 0.497 exists. In other words, early flames with more extended or stretched shapes reach these four combustion milestones more quickly. This result agrees with expectations, since extended kernel shapes are expec-ted to be more wrinkled and to burn more quickly. It is import-ant to note that all four MFB values occur much later in the cy-cle than the time at which rgyr is measured, so this measurement
demonstrates predictive capability. As might be expected, the predictive capability is stronger for the earlier MFB values than the later ones.
Figure 18 shows how the correlation between MFB05 and the
radius of gyration measured at a given crank angle changes as the crank angle of rgyr measurement varies. The result is
qualitatively similar for all four igniter/mixture combinations: generally negative correlations that grow stronger as the crank angle of measurement approaches mean(MFB00.5). As
discus-sed for Figure 17, the sign of the correlation (negative) is con-sistent with expectations. Additionally, the most negative valu-es of the correlation coefficient are approximately -0.8 in all cases. It is important to note, however, that there are import-ant differences between the cases. First, the data points for the four different cases begin at different crank angles, since the spark timing was optimized for each case, as tabulated in optimized for each igniter, the images for the conventional
ig-niter were recorded beginning at 0.75 CAD after spark timing (°aS), while those for the corona system were recorded begin-ning at 0.85 °aS. The images illustrate the differences in how the flame kernels evolve. Each of the five streamers created by the corona igniter—the view of the rearmost one is obscu-red by the igniter in these images—creates a much larger, more wrinkled initial flame. These corona-ignited kernels also grow more quickly until they combine with each other. It is be-lieved that, since the kernels are wrinkled from their incepti-on, they skip the slow, laminar flame-growth phase and imme-diately enter the fast, turbulent flame-growth phase.
Figure 14. Binarized instantaneous image sequences of flame-kernel growth for two ignition systems. The corona system shows faster flame development.
Engine speed is 1000 rev/min; IMEP = 6.8 bar; λ = 1.0, and 3% EGR. Images were taken at a lower rate for the conventional system due to the slower
Figure 15. Standard deviation of binarized images at five normalized crank angles for two mixtures and two ignition systems. Engine speed is 1000 rev/min; IMEP = 6.8 bar. Lean, dilute mixtures yield more CCV than stoichiometric, minimally diluted mixtures, and co-rona-ignited flames exhibit less CCV than conventionally ignited ones. The CoV(IMEP) for each condition is, from left to right, 0.3%,
0.4%, 3.0%, and 1.9%.
Figure 16. The IMEP of each cycle is insensitive to rgyr at mean(MFB00.5) for
[image:12.595.185.412.561.766.2]Figure 17. Correlation plots of rgyr at mean(MFB00.5) and four MFBx values for all four igniter/mixture combinations, MFB05, MFB10, MFBx50, and MFB90 are negatively
correlated with the rgyr measured at mean(MFB00.5). The early MFBx values are more strongly correlated than the later ones.
Figure 18. The negative correlation between MFB05 and the radius of gyration
measured at a given crank angle is stronger if the rgyr is measured at a later crank
[image:13.595.172.414.538.764.2]support through the Rackham Merit Fellowship. Electro Opti-cal Industries provided the integrating sphere and the black-body source on loan. Mohammad Alzuabi supported experi-ments with the optical engine, while Justin Kern supported experiments with the production engine.
References
[1] V. Sick, „High speed imaging in fundamental and applied combustion research,“ Proceedings of the Combustion Institute, vol. 34, pp. 3509-3530, 2013. [2] V. Sick, M. C. Drake, and T. D. Fansler, „High-speed
imaging for direct-injection gasoline engine rese-arch and development,“ Experiments in Fluids, vol. 49, pp. 937-947, 2010.
[3] K. Kohse-Höinghaus and J. B. Jeffries, Eds., Ap-plied Combustion Diagnostics. New York: Taylor and Francis, 2002, p.^pp. Pages.
[4] H. Zhao and N. Ladommatos, Engine Combustion Instrumentation and Diagnostics. Warrendale, PA: Society of Automotive Engineers, 2001.
[5] M. Raffel, C. E. Willert, S. T. Wereley, and J. Kom-penhans, Particle Image Velocimetry - A Practical Guide. Goettingen: Springer-Verlag Berlin Heidel-berg, 2007.
[6] S. R. Turns, An Introduction to Combustion: Con-cepts and Applications, 3rd ed. New York: McGraw-Hill, 2012.
[7] C. B. Ludwig, W. Malkmus, J. Reardon, J. Thomson, and R. Goulard, Handbook of infrared radiation from combustion gases. Washington, D.C.: Natio-nal Aeronautics and Space Administration, 1973. [8] J. Frank, R. Barlow, and C. Lundquist, „Radiation
and nitric oxide formation in turbulent non-premi-xed jet flames,“ Proceedings of the Combustion Institute, vol. 28, pp. 447-454, 2000.
[9] S. Brookes and J. Moss, „Measurements of soot production and thermal radiation from confined turbulent jet diffusion flames of methane,“ Com-bustion and Flame, vol. 116, pp. 49-61, 1999. [10] M. Jansons, S. Lin, and K. T. Rhee, „Infrared
spect-ral analysis of engine preflame emission,“ Internati-onal Journal of Engine Research, vol. 9, pp. 215-237, Jun 2008.
[11] S. R. Turns, An Introduction to Combustion, 3rd ed. New York: McGraw-Hill, 2011.
[12] A. Arakawa, K. Saito, and W. Gruver, „Automated infrared imaging temperature measurement with application to upward flame spread studies. Part I,“ Combustion and flame, vol. 92, pp. 222-IN2, 1993.
[image:14.595.307.554.178.756.2][13] G. Herzberg, Infrared and Raman spectra of po-lyatomic molecules: D. Van Nostrand Company.; New York, 1945.
Table 1. Second, for both igniters, in the stoichiometric, unluted case, the curves are much steeper than in the lean, di-lute cases. This result may be due to the flames grow much more quickly in these cases or to the combustion being less sensitive to the flame shape.
4 Summary and Conclusions
The work presented here illustrates the utility of infrared ima-ging and spectroscopy for internal-combustion engine rese-arch. The IR band offers two primary advantages:
• Several combustion-relevant species (e.g. H2O, CO2, CO,
and hydrocarbons) exhibit characteristic emission lines in the NIR, SWIR, and MWIR. When spectrally and temporally resolved, this emission provides information that is unob-tainable otherwise, allowing the temporal evolution of the-se species and their role in radiative heat transfer during the combustion cycle to be studied.
• The emissions of these species are very strong, yielding strong signals even with integration times on the order of 10 µs. The strength of the signal allows the flame size, sha-pe, and position to be quantified with fine temporal reso-lution without the need for image-intensifying equipment. Simultaneous 2D imaging and single-shot, spectrally resolved measurements were used to design an imaging strategy for applied investigations as well as for insights into the role of radiative heat transfer in spark-ignited engines. This work was conducted in the TCC-III engine and showed that spectrally resolved infrared emissions from water and carbon dioxide can be acquired at high frame rates and at spectral resolutions sufficiently fine to support simulation of in-cylinder molecular emission and absorption and the associated radiative energy redistribution.
The spectrally resolved measurements guided the selection of imaging water emissions between 1.0 and 1.7 µm in a hea-vy-duty, natural-gas engine. The performance of a conventi-onal spark ignition system and a corona ignition system were compared for stoichiometric and for lean, dilute mixtures. The advantages of using a corona igniter for establishing a flame and promoting its rapid growth, even in highly dilute condi-tions, was directly evident from the images that were acqui-red via borescopic optical access. Further, a detailed analysis of the images showed that the flame development is highly sensitive to the geometric shape of the flame, illustrating the value of infrared imaging diagnostics for applied engine re-search and development.
Acknowledgements
[28] K. D. Rein and S. T. Sanders, „Fourier-transform ab-sorption spectroscopy in reciprocating engines,“ Applied optics, vol. 49, pp. 4728-4734, 2010. [29] K. D. Rein, S. T. Sanders, and R. J. Bartula,
„Inter-ferometric techniques for crank-angle resolved measurements of gas spectra in engines,“ SAE Technical Paper 0148-7191, 2009.
[30] L. A. Kranendonk, J. W. Walewski, T. Kim, and S. T. Sanders, „Wavelength-agile sensor applied for HCCI engine measurements,“ Proceedings of the Combustion Institute, vol. 30, pp. 1619-1627, 2005. [31] O. Witzel, A. Klein, C. Meffert, C. Schulz, S. Kaiser,
and V. Ebert, „Calibration-free, high-speed, in-cylinder laser absorption sensor for cycle-resol-ved, absolute H2O measurements in a production IC engine,“ Proceedings of the Combustion Insti-tute, vol. 35, pp. 3653-3661, 2015.
[32] G. Rieker, H. Li, X. Liu, J. Liu, J. Jeffries, R. Hanson, M. Allen, S. Wehe, P. Mulhall, and H. Kindle, „Ra-pid measurements of temperature and H2O con-centration in IC engines with a spark plug-moun-ted diode laser sensor,“ Proceedings of the Combustion Institute, vol. 31, pp. 3041-3049, 2007. [33] M. Mosburger, V. Sick, and M. Drake, „Quantitative
high-speed burned gas temperature measure-ments in internal combustion engines using sodi-um and potassisodi-um fluorescence,“ Applied Physics B, vol. 110, pp. 381-396, 2013.
[34] P. Schiffmann, „Root Causes of Cycle-to-Cycle Combustion Variations in Spark Ignited Engines,“ 2016.
[35] P. Schiffmann, D. L. Reuss, and V. Sick, „Empirical investigation of spark-ignited flame-initiation cyc-le-to-cycle variability in a homogeneous charge re-ciprocating engine,“ International Journal of Engi-ne Research, p. 1468087417720558, 2017.
[36] A. A. Quader, „What limits lean operation in spark ignition engines-flame initiation or propagation?,“ SAE Technical Paper 0148-7191, 1976.
[37] J. D. Dale, M. Checkel, and P. Smy, „Application of high energy ignition systems to engines,“ Progress in Energy and Combustion Science, vol. 23, pp. 379-398, 1997.
[38] T. Alger, J. Gingrich, B. Mangold, and C. Roberts, „A continuous discharge ignition system for EGR li-mit extension in SI engines,“ SAE International Journal of Engines, vol. 4, pp. 677-692, 2011. [39] G. Ruan, D. Kienzle, D. Roth, and M. Becker, „Dual
coil ignition for gasoline EGR engines,“ MTZ wor-ldwide, vol. 74, pp. 18-21, 2013.
[40] M. Brandt, A. Hettinger, A. Schneider, H. Senftle-ben, and T. Skowronek, „Extension of Operating Window for Modern Combustion Systems by High Performance Ignition,“ in Ignition Systems for Gasoline Engines: 3rd International Conference, November 3-4, 2016, Berlin, Germany 3, 2017, pp. 26-51.
[14] E. Mancaruso, L. Sequino, and B. M. Vaglieco, „IR digital imaging for analysing in-cylinder combusti-on process in transparent diesel engine,“ in Photo-nics Technologies, 2014 Fotonica AEIT Italian Con-ference on, 2014, pp. 1-4.
[15] T. McComiskey, H. Jiang, Y. Olan, K. Rhee, and J. Kent, „High-speed spectral infrared imaging of spark ignition engine combustion,“ SAE Technical Paper 0148-7191, 1993.
[16] S. F. Fernandez, C. Paul, A. Sircar, A. Imren, D. C. Haworth, S. Roy, and M. F. Modest, „Soot and spectral radiation modeling for high-pressure tur-bulent spray flames,“ Combustion and Flame, vol. 190, pp. 402-415, 2018.
[17] R. N. Janeway, „Combustion Control by Cylin-der-Head Design,“ SAE Technical Paper 0148-7191, 1929.
[18] G. L. Borman and K. Nishiwaki, „Internal combusti-on engine heat transfer,“ Prog. Energy Combust. Sci., vol. 13, pp. 1-46, 1987.
[19] J. B. Heywood, „Internal combustion engine fun-damentals,“ 1988.
[20] M. F. Modest and D. C. Haworth, Radiative heat transfer in turbulent combustion systems: theory and applications: Springer, 2016.
[21] J. Abraham and V. Magi, „Modeling radiant heat loss characteristics in a diesel engine,“ SAE Techni-cal Paper 0148-7191, 1997.
[22] G. D. Ebersole, P. Myers, and O. Uyehara, „The ra-diant and convective components of diesel engine heat transfer,“ SAE Technical Paper 0148-7191, 1963.
[23] P. Flynn, M. Mizusawa, O. A. Uyehara, and P. S. Myers, „An experimental determination of the in-stantaneous potential radiant heat transfer within an operating Diesel engine,“ SAE Technical Paper 0148-7191, 1972.
[24] A. J. Torregrosa, P. C. Olmeda, and C. A. Romero, „Revising engine heat transfer,“ Journal of En-gineering Annals of Faculty of EnEn-gineering Hune-doara, vol. 6, pp. 245-265, 2008.
[25] D. Haworth, S. Roy, J. Cai, A. Sircar, A. Imren, and M. Modest, „Modeling Radiative Heat Transfer in Engines,“ in International Multidimensional Engine Modelling User‘s Group Meeting at the SAE Con-gress, April, 2015.
[26] A. G. Gaydon, The Spectroscopy of Flames. New York: Wiley, 1957.
[55] A. Rousso, S. Yang, J. Lefkowitz, W. Sun, and Y. Ju, „Low temperature oxidation and pyrolysis of n-heptane in nanosecond-pulsed plasma dischar-ges,“ Proceedings of the Combustion Institute, vol. 36, pp. 4105-4112, 2017.
[56] P. Schiffmann, D. L. Reuss, and V. Sick. The TCC En-gine Collection. Available: https://deepblue.lib. umich.edu/data/collections/8k71nh59c
[57] C. J. Humphreys and E. Paul, „Interferometric Wa-velength Determinations in the First Spectrum of 136 Xe,“ JOSA, vol. 60, pp. 1302-1310, 1970. [58] M. C. Gross, A. Mazacioglu, J. Kern, and V. Sick,
„Infrared borescopic analysis of natural-gas igniti-on and combustiigniti-on variability,“ SAE Technical Pa-per 2018-01-0632, 2018.
[59] A. Mazacioglu, M. C. Gross, J. Kern, and V. Sick, „Infrared borescopic evaluation of high-energy and long-duration ignition systems for lean/dilute com-bustion in heavy-duty natural-gas engines,“ SAE Technical Paper 2018-01-1149, 2018.
[60] N. Otsu, „A threshold selection method from gray-level histograms,“ IEEE transactions on sys-tems, man, and cybernetics, vol. 9, pp. 62-66, 1979. [41] Y. Ikeda, A. Nishiyama, H. Katano, M. Kaneko, and
H. Jeong, „Research and Development of Micro-wave Plasma Combustion Engine (Part II: Engine Performance of Plasma Combustion Engine),“ 2009.
[42] B. Wolk, A. DeFilippo, J.-Y. Chen, R. Dibble, A. Nis-hiyama, and Y. Ikeda, „Enhancement of flame de-velopment by microwave-assisted spark ignition in constant volume combustion chamber,“ Combusti-on and flame, vol. 160, pp. 1225-1234, 2013. [43] S. Bohne, G. Rixecker, V. Brichzin, and M. Becker,
„High-Frequency Ignition System Based on Corona Discharge,“ MTZ worldwide, vol. 75, pp. 30-35, 2014.
[44] D. I. Pineda, B. Wolk, J.-Y. Chen, and R. W. Dibble, „Application of Corona Discharge Ignition in a Boosted Direct-Injection Single Cylinder Gasoline Engine: Effects on Combustion Phasing, Fuel Consumption, and Emissions,“ 2016.
[45] A. Schenk, G. Rixecker, and S. Bohne, „Results from Gasoline and CNG Engine Tests with the Co-rona Ignition System EcoFlash,“ in Laser Ignition Conference, 2015, p. W4A. 4.
[46] C. D. Cathey, T. Tang, T. Shiraishi, T. Urushihara, A. Kuthi, and M. A. Gundersen, „Nanosecond plasma ignition for improved performance of an internal combustion engine,“ IEEE Transactions on Plasma Science, vol. 35, pp. 1664-1668, 2007.
[47] D. L. Wisman, S. D. Marcum, and B. N. Ganguly, „Chemi-ion-current-induced dissociative recombi-nation in premixed hydrocarbon/air flames,“ Jour-nal of Propulsion and Power, vol. 24, pp. 1079-1084, 2008.
[48] T. X. Phuoc, „Laser-induced spark ignition funda-mental and applications,“ Optics and Lasers in En-gineering, vol. 44, pp. 351-397, 2006.
[49] E. G. Groff and M. K. Krage, „Microwave effects on premixed flames,“ Combustion and flame, vol. 56, pp. 293-306, 1984.
[50] H. Jaggers and A. Von Engel, „The effect of elec-tric fields on the burning velocity of various fla-mes,“ Combustion and Flame, vol. 16, pp. 275-285, 1971.
[51] N. Nakamura, T. Baika, and Y. Shibata, „Multipoint spark ignition for lean combustion,“ SAE Technical Paper 0148-7191, 1985.
[52] [T. Briggs, T. Alger, and B. Mangold, „Advanced ig-nition systems evaluations for high-dilution SI engi-nes,“ SAE International Journal of Engines, vol. 7, pp. 1802-1807, 2014.
[53] M. K. Das and S. T. Thynell, „Corona, Spark, and Electrothermal-Chemical Plasma Ignition Systems,“ Handbook of Combustion, 2010.