7282
MEMORY-ACCESS-AWARE DATA MIGRATION
TECHNIQUES FOR LOW POWER EMBEDDED SYSTEM
1YEONJOON HAN, 2SANGSOO PARK
1,2Department of Computer Science and Engineering, Ewha Womans University, Seoul, Republic of Korea
E-mail: 1[email protected], 2[email protected]
ABSTRACT
With the arrival of the Internet of Things (IoT) era, the emergence of new applications to improve various aspects of daily life is encouraged. Most Internet of things devices are small-scale, and battery power sources have improved the mobility of these devices. In this way, execution at low power is an important issue because it is necessary to extend the battery life. In order to improve the performance of small-scale embedded systems, we propose a data migration method for transferring read-dominant data from SRAM to Flash memory. We trace memory accesses, analyze memory access patterns, and separate read-dominant data from the read/write data. Then, the read-dominant data is relocated to the Flash memory sector. These procedures are able to reduce the energy, power, and current consumption for accessing the data in SRAM. Experiments showed that the proposed methodology achieves reduction of power and current consumption compared with conventional storage, which keeps all data in SRAM. Data migration technique could manage efficiently energy and power in IoT device.
Keywords: Low Power Embedded System, Data Migration, Hybrid Memory, Internet of Things
1 INTRODUCTION
With the arrival of the Internet of Things (IoT) era, the emergence of new applications to improve various aspects of daily life is encouraged [1,2]. In particular, mobile devices and wearable devices are typical of IoT devices, and most IoT devices are small-scale and battery-driven. Once the battery is charged, the user wants to use the device to operate for as long as possible. Therefore, IoT devices should perform target functions using battery power in real-time and low power manner on an embedded system. In fact, the low power operation of IoT devices has recently become one of the most important issues, and research is needed to reduce the power consumption of IoT devices through effective low power management. It is a recent study task to enable long-term computation on a system that is made up of unreliable and intermittent sources of energy. And generally, because 60% of the power consumption of the embedded system is caused by memory, effective memory management is critical for low power embedded systems [3].
IoT devices have various memory types depending on power consumption, execution speed, read/write latency, etc. It is important to understand which memory is used according to specific types. The memory type determines the performance, energy, and reliability of an embedded system [4].
Different types of memories can be combined together to compensate for the characteristics of each kind of memory. Various studies proposed methods for improving the effectiveness of hybrid memory in recent years. Several studies have focused on page replacement in hybrid main memory systems [4,5]. Other methods related to data allocation in the hybrid memory have been employed within a chip multiprocessor (CMP) system [6]. Our research focused on small-scale embedded systems such as IoT devices.
7283 The remainder of the paper is organized as follows. In Section II, the architecture and characteristics of hybrid memory in an embedded system are described. Section III presents the Data Migration Methodology suggested in this paper. In Section IV, the experimental setup of the data migration experiment is presented. In Section V, the experiment of the Data Migration Methodology is given. In Section VI, the experimental results of this paper. Finally, this paper concludes in Section VII and suggests future works.
2 HYBRID MEMORY ARCHITECTURE
AND CHARACTERISTICS
The improvements to the performance and technology of embedded systems increase the importance of power management. Memory use determines the performance, speed, and reliability of an embedded system. Typically, there is volatile memory and nonvolatile memory. Normally, volatile memory such as SRAM or DRAM is used as main memory because access its time is short. However, volatile memory consumes a considerable amount of energy [5]; in addition, data is lost at the time of power failure, and the scalability of volatile memory is limited. These disadvantages can be overcome by replacing the volatile memory with non-volatile memory such as Flash memory. Non-volatile memory has lower energy consumption and higher memory capacity than volatile memory. In the non-volatile memory, when the power is turned off, the data are unchanged. However, non-volatile memory has low memory access speed, and it has high write latency [4,5]. Thus, each type of memory has advantages and disadvantages, so it is important to take advantages of each type memory to compensate for disadvantages. This is why hybrid memory systems have been proposed in many studies and applied to embedded systems.
Hybrid memory enables fast access time and consumes less energy. Recent work has focused on power-efficient methodology in large-scale embedded systems that use hybrid memory [6,8,9]. In order to prolong the battery life of IoT devices, we propose a data migration methodology that reduces the power consumption of IoT devices and uses the volatile memory capacity more efficiently. This methodology will make it possible to reduce the power and current consumption in IoT devices.
The data migration methodology finds read-dominant data within the read/write data and migrates these data to non-volatile memory. Owing to the write latency and invariability of non-volatile
memory, read-only data, such as critical system information, are already located in non-volatile memory. Additionally, read/write data are stored in the volatile memory in the .bss or .data section. Part of the read/write data mainly participates in the read operation. It is called read-dominant data. But the remaining data do alternately read and write operations. Read-dominant data can be stored in non-volatile memory during reading operations, like read-only data. Therefore, the migration is expected to reduce power and current consumption while securing volatile memory capacity.
3 DATA MIGRAITON METHODOLOGY
This section describes the two steps of the data migration methodology: data selection and data migration. First, in the variables, we find the read-dominant variables according to memory read/write access. Next, the time to shift to Flash memory and the time to return to SRAM for the write operation are analyzed. After the selection and analysis work is finished, the selected variables are transferred to the Flash memory using Flash programming.
3.1 Selection
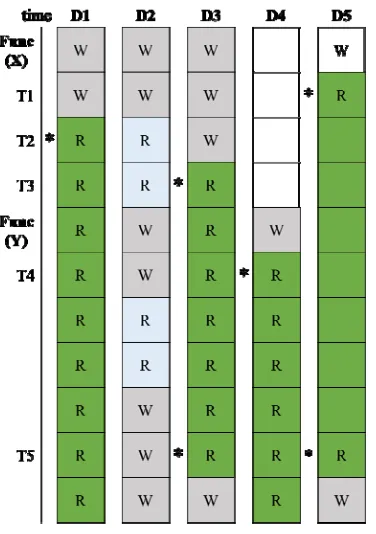
Read-dominant data is selected by analyzing the read/write trace results of the memory. These trace results allow us to determine when the memory is accessed for read and write operations. By using the address of the accessed memory, the data region of the SRAM where the read/write data are stored is first separated before classifying the data according to the variable in the data region. When classification is completed, a read/write pattern is drawn for each variable using both the memory read/write index and the clock time, i.e., time of memory access. Then, the variable patterns are used to select the read-dominant variables.
7284 Flash memory from T1 to T5. Based on this analysis, D1, D3, D4, D5 could be selected for data migration, but not D2.
Figure 1: Data variable memory read/write access flow for selection
A specific clock time is determined by comparing the trace data of a branch instruction of the program, which indicate the target address related to the branch operation at that clock time. For example, Func = {func(X), func(Y)} is a set of function in a program. The program starts with func(X) and jumps to func(Y) during T3 and T4. Along with Figure 1, it is possible to move D1, D3, and D5 to the Flash memory after starting the func(X) execution and D4 is migrated just after func(Y) execution start.
Figure 2 shows that representative pattern of the dominant variable. Most of the read-dominant variables tend to have patterns like Figure 2. For every clock time, we plot the pattern where read access is value 1 and black and write access is value 2 and red. This pattern shows that program does write access only at initial clock time and keeps do read access until the end of execution.
3.2 Data Migration
When the data are selected for data migration and the clock point is determined, the data are
[image:3.612.102.290.140.407.2]migrated from SRAM to Flash memory. To move data to the Flash memory, Flash programming must be used for the program code. Normally, in order to save data in Flash memory, we declare a constant using the “const” statement. However, this statement creates read-only data and most of the data are usually read/write data. Because it's our aim that move, not read-only data, read/write data to Flash memory, we need to use Flash programming to read/write data.
Figure 2: Representative pattern of the read-dominant variable
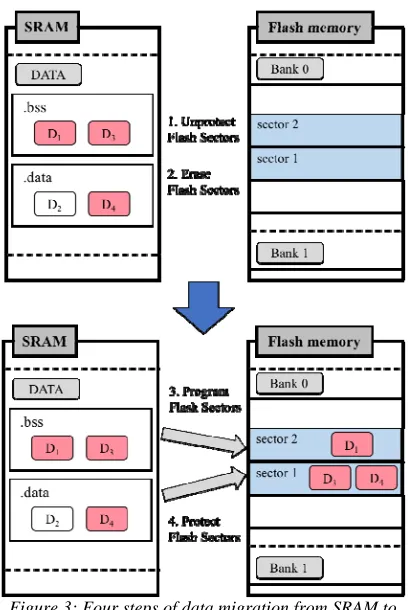
Figure 3 depicts a four-stage data migration process. First, we remove protection from the specified Flash sectors, i.e., sector 1 and sector 2, for use. Generally, critical system information exists in the Flash memory, and overwriting is prevented by protecting the Flash memory sectors. Thus, it is necessary to remove protection from specific Flash sectors for use before data migration. Second, useless data stored in sectors 1 and 2 need to be erased. Third, after the erase operation is completed, the Flash sectors are programmed to transfer data from the SRAM to the Flash memory. The selected data, which are D1, D3, and D4 in the
.bss or .data sections, will move to sectors in bank 0 of the Flash main memory. Finally, we need to protect Flash sectors again. Protecting and removing protection from the sectors are very important steps, as only unprotected sectors of Flash memory can be programmed.
4 EXPERIMENTAL SETUP
[image:3.612.326.518.234.387.2]7285
4.1 Hardware
We evaluate the power and current consumption of the proposed data migration methodology. The MSP432P401R Launchpad (Texas Instruments; Novi, MI) is mainly used for the experiments. This Launchpad has an ARM Cortex-M4 microcontroller and hybrid memory comprising 256 KB of Flash memory and 64 KB of SRAM. The Flash main memory includes two 128-KB banks, which comprise a total of 64 4-128-KB sectors. The Flash programming procedure for data migration is processed sector by sector. Additionally, the MSP432P401R Launchpad has an embedded EnergyTrace+ chip that can measure the time, power, and current consumed by an application [10].
4.2 Software Tools
4.2.1 Code Composer Studio (CCS)
Code Composer Studio is an integrated development environment (IDE) supporting TI’s microcontroller and embedded processors. Our Launchpad MSP432P401R is built-in EnergyTrace+ technology. EnergyTrace technology is viable with TI’s Code Composer Studio IDE.
Using Code Composer Studio, we can monitor device in real-time and measures time, energy, power and current [10].
4.2.2 FastModels Tarmac trace
FastModels from ARM supports a generation of traces that consistently track model execution and related activities. Using plug-ins, virtual platforms are generated and provide trace function [11,12]. The trace function can make trace output like Figure 4. We can select trace options such as instruction trace, branch trace, memory trace, etc. In this paper, we trace memory access and branch instruction. Thereby, we could distinguish and select read-dominant variables which should be migrated.
4.3 Evaluation Benchmarks
[image:4.612.339.504.136.342.2]We verified the data migration methodology by using FIR, two benchmarks in MiBench: basicmath, and dijkstra, and five benchmarks in Powerstone: bcnt, blit, CRC, g3fax, and pocsag. The finite impulse response (FIR) filter benchmark is a float array calculation algorithm. Basicmath is a mathematical program composed of a cubic function, and an integer square root function. Dijkstra is a finding shortest path algorithm in a node graph [13]. In the powerstone set, bcnt is a program which does a bit shifting and AND calculation through a 1K array. Blit is graphics applications and CRC is a cyclic redundancy check program. G3fax is a group three fax decode program which is kind of image decompression. And last, pocsag is paging communication
Figure 3: Four steps of data migration from SRAM to Flash memory
[image:4.612.95.299.290.595.2]7286 protocols [14]. In this verification, we increased the original number of benchmark executions by 2 times, as indicated in Table 1. The criteria for the number of execution is the number of iteration execution during roughly 1 minute. The execution times of the basicmath, dijkstra, and g3fax benchmarks are much longer than the others, so the number of executions for basicmath, dijkstra, and g3fax were inevitably small.
Table 1: The Number of Executions of The Benchmarks.
Benchmarks Number of Executions
x1 x2
FIR 10,000 20,000
Mibench basicmath 100 200
dijkstra 10 20
Powerstone
bcnt 50,000 100,000 blit 5,000 10,000 CRC 50,000 100,000
g3fax 250 500
pocsag 2,500 5,000
5 EXPERIMENT
5.1 Tracing Variables
Tracing memory access and tracing branch instruction are afforded while executing instructions using FastModels Tarmac trace. The Tarmac Trace plug-in of the FastModels from ARM keeps track of ‘trace_loads and stores’, ‘trace_instructions’, and ‘trace_branches’. The ‘trace_loads and stores’ function can trace loads and stores triggered by instructions, i.e., read and write access operations. These might go into the memory subsystem. In figure 4, it shows the memory tracing results. This trace function indicates time (clock), read or write access, size of data (bytes), a virtual address, and a transferred data. The ‘trace_instructions’ function can trace all of the instructions triggered during execution. This function presents the time (clock), an instruction ID which is the number of instructions executed, address at which fetch instruction, an instruction type, a mode which is processor execution mode, and disassembly code. The ‘trace_branches’ function can trace changes of the program flow like branches and exception returns. This function presents the time (clock), the instruction ID, the address at which the branch instruction is executed, and the target address at which the processor branches [12]. Figuring out where each function ends, we perform the data migration at prefer time.
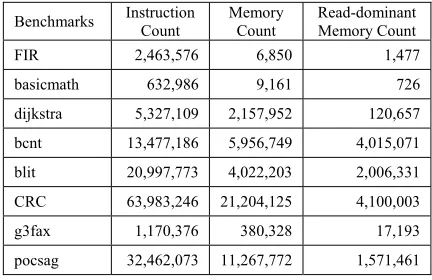
[image:5.612.309.525.280.420.2]In table 2, there are specifications of every benchmark which are analyzed by trace results. Using trace results, we count every instructions and memory access during the program execution. Basicmath benchmark has smaller instructions than any other benchmarks. Other benchmarks perform instructions more 1 million. There is much more read-dominant memory access in bcnt, cnt, blit, CRC, and pocsag benchmarks. Read-dominant memory count means the number of memory access of all of the read-dominant variables. With the Tarmac Trace plug-in features, we can trace the memory access and prepare a more precise selection of read-dominant data.
Table 2: Specifications of The Benchmarks.
Benchmarks Instruction Count Memory Count Read-dominant Memory Count
FIR 2,463,576 6,850 1,477
basicmath 632,986 9,161 726
dijkstra 5,327,109 2,157,952 120,657
bcnt 13,477,186 5,956,749 4,015,071
blit 20,997,773 4,022,203 2,006,331
CRC 63,983,246 21,204,125 4,100,003
g3fax 1,170,376 380,328 17,193
pocsag 32,462,073 11,267,772 1,571,461
5.2 Selecting Variables
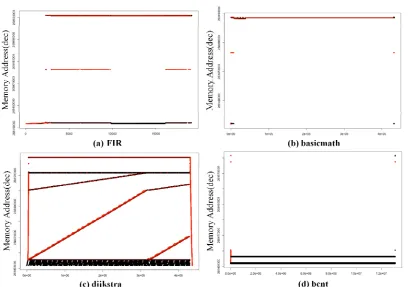
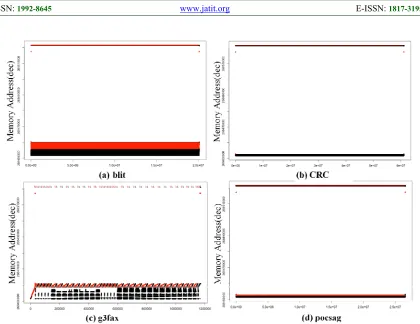
7287 black, meaning that this part of memory could be read-dominant. Similar to Figure 6(a), almost half of the memory addresses in Figure 6(b) and Figure 6(d) do read operations continuously. The g3fax benchmark pattern is unlike the other benchmarks, as shown in Figure 6(c). Although g3fax does not perform read operations continuously, it does keep reading. Therefore, there are likely some read-dominant variables. With the patterns of memory access in a data region, we can confirm whether read-dominant variables exist. Then, we can split the memory addresses with each variable to depict the patterns in a variable unit. Through those procedures, we could precisely identify read-dominant variables.
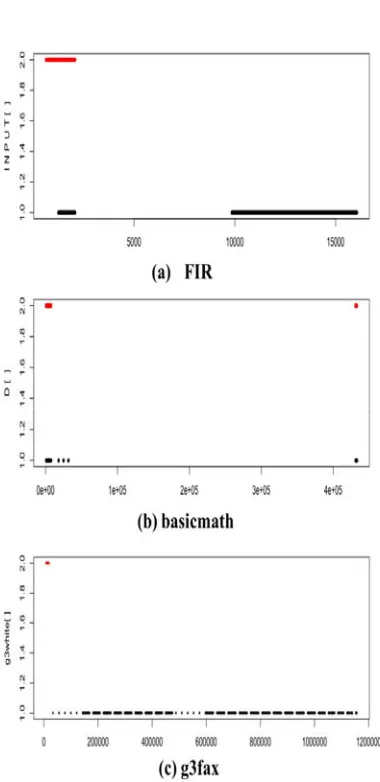
Second, we classify the trace results by variables according to the memory address. In these steps, memory accesses are indexed by numbers. The black color and index 1 is a memory read access. And the red color and index 2 is a memory write access. Third, we plot the memory access patterns of each variable using the index. Finally, we analyze the patterns to determine which variables are read-dominant. In Figure 7, there are some specific read-dominant variable patterns among the benchmarks. Most of the read-dominant
variables show a tendency like that in Figure 2. Figure 7(a) shows the pattern of an array INPUT[] in FIR benchmark. INPUT[] read and write at the initial clock time and there is no memory access until the almost half of execution. And it keeps read access during last half. Therefore, we could select INPUT[] as read-dominant variable and migrate the array right after write operations. Figure 7(b) shows the array data of the basicmath benchmark. This D[] only access read and write at the start and last clock. Albeit there are few read operations in D[], we could select this variable as a read-dominant variable. Because D[] could be located in flash memory transiently. In Figure 7(c), array g3white[] in g3fax benchmark is similar to a representative pattern. The g3white[] only write at the initial clock and then it is not continuous but it keeps reading. It is one of the read-dominant variables.
[image:6.612.103.514.417.704.2]Through these selection procedures, read-dominant variables are selected. In bcnt benchmark, There are 3 read-dominant arrays: poptab[], src[], and dst[]. Those arrays are large. And blit benchmark has one large read-dominant array src[]. It is about 4KB size. An array aa[] in CRC benchmark is selected. Large arrays which are fax[], g3white[], and g3black[] in g3fax benchmark are
7288 also selected for migration. Last, in Pocsag benchmark, we selected six small arrays such as alpha[], alpha3[], alpha_inv[], roots[], err_tab[], and alpha_data[]. Read-dominant variables tend to be primarily array data because most of them used in benchmark as input data.
5.3 Migrating Variables
Read-dominant data should be moved to Flash memory. It is important to determine the specific clock time at which to transfer the data. In the result of ‘trace_branches’, a branch point between functions is revealed. We can acquire the clock point when a certain function enters the read operation stage. All read-dominant variables of the eight benchmarks start read operations before starting their core functions. Therefore, flash programming should be performed at the main function. The size of read-dominant variables in dijkstra benchmark is almost 3.6KB. For the bcnt and g3fax benchmarks, the size of the read-dominant variables is almost 4 KB. For that reason, dijkstra benchmark use two sectors in the Flash memory for data migration. And with bcnt and
g3fax benchmarks, three sectors in the Flash memory are used for data migration. In contrast, the other five benchmarks use only one sector because the total size of all selected variables does not exceed one sector size. Flash programming is performed in the bank 1 sectors in the Flash main memory. When the data is placed in a sector, it defines an additional pointer directed to the Flash memory address of the migrated data. Each time there is a read operation request, the value is acquired from the Flash memory using the pointer.
6 EXPERIMENTAL RESULTS
[image:7.612.98.518.70.394.2]The current consumption results are shown in Figure 8. In most of the benchmarks, the current consumption is reduced when the read-dominant data is migrated. By placing the read-dominant data in the flash memory where the code is executed, the current and power required to access read/write data in SRAM are reduced. During a read operation, the processor does not need to access and obtain the data from SRAM because the necessary data are already in flash memory. The CRC benchmark has
7289 the greatest reduction of current consumption with data migration. As table 2, compared with other benchmarks, CRC benchmark has significant counts in instruction, memory access, and even read-dominant variable access. Figure 9 is showing graphs comparing basic execution results with the results which the number of execution is increased by 2 times. More benchmarks are reduced the consumed current when the number of execution is increased.
The power consumption is displayed in Figure 10 as result of data migration. It tends to be much similar with the current consumption. This tendency is because the power equation is P = V*I (P is power (W), V is voltage (V), and I is current (A)). In our experiment environment, we use a voltage as 3.3V which are fairly fixed value.
Therefore, the power consumption is effected by current consumption. As CRC benchmark has the greatest reduction in current consumption, there are significant reductions in power consumption, too.
The FIR, basicmath, blit, g3fax, and pocsag benchmarks are also reduced consumed power. This is significant that moving read-dominant to flash memory is effective in managing power. With our data migration experiment, it is found that data migration methodology could reduce the power consumption of IoT device. This tendency is also seen in the doubling of execution.
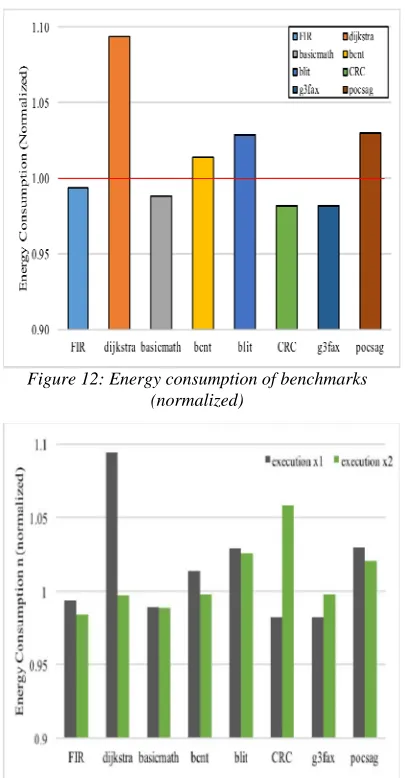
[image:8.612.106.457.65.478.2]In Figure 12, there is an energy consumption graph. Compared with current and power, consumed energy is reduced slightly less. The energy equation is E = V*I*T (E is energy (J), V is
[image:8.612.102.292.86.477.2]Figure 7: Read-dominant patterns of the (a) FIR, (b) basicmath, and (c) g3fax benchmarks
Figure 8: Current consumption of benchmarks (normalized)
[image:8.612.320.520.315.497.2]7290 voltage (V), I is current (A), and T is time (s)). As mentioned above, voltage in our experiment is 3.3V. Revealed in figures, the current reduction rate is greater than the energy reduction rate. According to the energy equation, energy is proportional to time and current. Consequently, it means that the time of executions has increased. There is a visible augment of energy in dijkstra, bcnt, blit, CRC, and pocsag benchmarks. The dijkstra, bcnt, blit, and g3fax benchmarks have large size of read-dominant variables. Dijkstra and blit benchmarks’s total size of read-dominant variables are almost 4KB. And bcnt and g3fax benchmarks’s total size of read-dominant variables are almost 8KB. Because of the size, we have to allot several sectors in flash memory. Especially, bcnt and g3fax benchmarks allot 3 sectors. Programming several sectors in flash
memory should be executed independently of each other. Furthermore, there are significant instruction and memory access in CRC and pocsag benchmarks. We thought that these factors affect Flash programming and that the overhead that occurs in Flash programming affects the execution time and also energy consumption. Even though additional overhead occurs with the data migration methodology, the power consumption has decreased in most benchmarks. And some benchmarks have been more efficient when they have increased the number of runs.
7 CONCLUSTION AND FUTURE WORK
In this paper, we proposed a data migration method in which read-dominant data is moved from SRAM into Flash memory. Typically, it is possible to reduce power and energy required to access
[image:9.612.95.296.79.280.2]read-Figure 13: Energy consumption of benchmarks with the number of execution x2 (normalized) Figure 12: Energy consumption of benchmarks
[image:9.612.319.522.237.626.2](normalized) Figure 10: Power consumption of benchmarks
(normalized)
[image:9.612.97.298.320.500.2]7291 dominant data by migrating it to Flash memory. Now that IoT technology is rapidly developing, many IoT devices use hybrid memory. Furthermore, power consumption and energy consumption in IoT devices are very important factors. Adoption of the data migration method reduces energy, power, and current consumptions. Moreover, there is a limit to the capacity of using SRAM, but it can be improved by applying the data migration technique. The more read-dominant variables we migrate, the more efficiently we can use SRAM.
In the future, we aim to devise reliable and efficient data migration techniques through more detailed memory analysis. It is a recent study task to enable long-term computation on a system that is made up of unreliable and intermittent sources of energy. There are many promising and viable solutions for powering IoT devices. Energy harvesting is the representative one. However, frequent intervals of power loss occur because of ambient energy sources in nature [15]. In such power unreliability, it is a challenge that performing programs completely. We will make sure that programs that use techniques work well even in the event of power loss. We also plan to expand learning for various applications with various datasets and sizes of various applications. A more efficient migration method is expected to lead to considerable performance improvement in small embedded systems.
ACKNOWLEDGMENTS:
This work was supported by the National Research Foundation of Korea funded by the Korean Government (NRF-2017R1D1A1B030303 93). Sangsoo Park is the corresponding author.
REFRENCES:
[1] G. Acampora, D. J. Cook, P. Rashidi and A. V. Vasilakos, "A Survey on Ambient Intelligence in Healthcare," IEEE, Vol. 101, No. 12, 2013, pp. 2470-2494.
[2] D. Balsamo, A. Elboreini, B. M. Al-Hashimi and G. V. Merrett, "Exploring ARM mbed support for transient computing in energy harvesting IoT systems," Proceedings of 2017 7th IEEE International Workshop on Advances
in Sensors and Interfaces (IWASI), IEEE
(Italy), June 15-16, 2017, pp. 115-120.
[3] M. Eggenberger and M. Radetzki, "Optimal memory selection for low power embedded systems," Proceedings of 2015 12th International Workshop on Intelligent Solutions
in Embedded Systems (WISES), IEEE (Italy),
October 29-30, 2015, pp. 11-16.
[4] H. Aghaei Khouzani, F. S. Hosseini and C. Yang, "Segment and Conflict Aware Page Allocation and Migration in DRAM-PCM Hybrid Main Memory," IEEE Transactions on Computer-Aided Design of Integrated Circuits and Systems, Vol. 36, No. 9, 2017, pp. 1458-1470.
[5] Z. Zhang, Y. Fu and G. Hu, "DualStack: A High Efficient Dynamic Page Scheduling Scheme in Hybrid Main Memory," Proceedings of 2017 International Conference on Networking,
Architecture, and Storage (NAS), IEEE
(China), August 7-9, 2017, pp. 1-6.
[6] Y. Wang, K. Li, J. Zhang and K. Li, "Energy Optimization for Data Allocation With Hybrid SRAM+NVM SPM," IEEE Transactions on
Circuits and Systems I: Regular Papers, Vol.
65, No. 1, 2018, pp. 307-318.
[7] Texas Instruments, “Code Composer StudioTMv7.x for MSP430TM: User’s Guide”, http://www.ti.com/lit/ug/slau157ap/slau157ap.p df, 06/05/2018.
[8] W. Tian et al., "Task Allocation on Nonvolatile-Memory-Based Hybrid Main Memory," IEEE Transactions on Very Large Scale Integration (VLSI) Systems, Vol. 21, No. 7, 2013, pp. 1271-1284.
[9] R. Raha, “Adaptive Regulation of Sampling Rates for Power Efficient Embedded Control System Design”, J. Inst. Control Robotics Syst (ICCAS), Vol. 23, 2017, pp. 505-510.
[10] Texas Instruments, “MSP432P401R
SimpleLinkTM Microcontroller LaunchPadTM Development Kit (MSP-EXP432P401R)”, http://www.ti.com/lit/ug/slau597e/slau597e .pdf, 06/05/2018
[11] ARM, “Fast Models Reference Manual Version 10.3”, https://developer.arm.com/ products/system-design/fast-models/docs/ dui0834/latest/plug-ins-for-fast-models/ tarmactrace-and-tarmactracev8, 06/05/2018. [12] ARM, “Tarmac Trace for Fast Models User
7292 [13] M. R. Guthaus, J. S. Ringenberg, D. Ernst, T.
M. Austin, T. Mudge and R. B. Brown, "MiBench: A free, commercially representative embedded benchmark suite," Proceedings of the Fourth Annual IEEE International Workshop on Workload Characterization.
WWC-4 (Cat. No.01EX538), IEEE (USA),
December 2-2, 2001, pp. 3-14.
[14] A. Malik, B. Moyer and D. Cermak, "A low power unified cache architecture providing power and performance flexibility," Low Power Electronics and Design, 2000. ISLPED '00. Proceedings of the 2000 International
Symposium on, IEEE (Italy), July 26-27, 2000,
pp. 241-243.