ORIGINAL RESEARCH ARTICLE
ANALYSIS OF PREDICTIVE CONTROL FOR BOOST
CONVERTER IN POWER FACTOR CORRECTION
APPLICATION
1,*
Nirmala Devi, V. and
2Viswanath Reddy, P.
1
Assoc. Prof and HOD, Dept of EEE, DR.K.V. Subba Reddy Institute of Technology, Kurnool, AP, India
2PG Scholar, Dept of EEE, DR.K.V.Subba Reddy Institute of Technology, Kurnool, AP, India
ARTICLE INFO ABSTRACT
This work presents a boost converter design methodology for active power factor correction, using finite con- trol set model-based predictive control (FCS-MPC) for current control. Moreover, an external proportional integrative (PI) volt- age control loop design methodology is explained. This paper also compares the conventional PI current control with MPC current for this application, both in transient load disturbance condition and in steady state different load conditions. The results in rated operation are compared with IEC 61000-3-2 international standard, which establishes limits for current harmonics rms values. The design methodology shows itself effective, with results near to the expected. Both controllers presented advantages and disadvantages, many of them exhaustively discussed in this work
*Corresponding author
Copyright ©2017,Nirmala Devi and Viswanath Reddy. This is an open access article distributed under the Creative Commons Attribution License, which permits
unrestricted use, distribution, and reproduction in any medium, provided the original work is properly cited.
INTRODUCTION
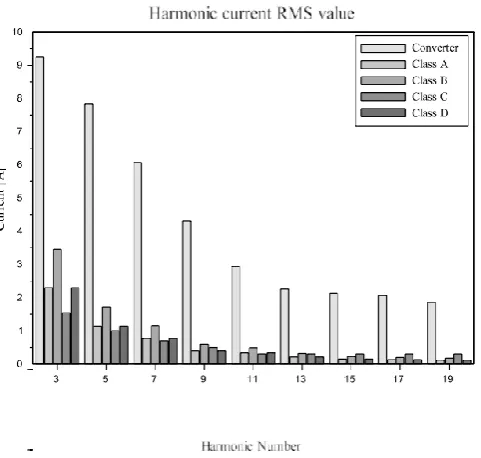
A constant preoccupation of industrial equipment producers is to attend international standards on total harmonic distortion (THD) and power factor (PF), specially, in order to sell for markets subjected to standards as IEC 61000-3-2 (1). This norm establishes limits for current harmonic levels in equipment with input current lower than 16 A. The main problem is that industrial and domestic equipment use power converters for developing DC sources or motor drives. The power converters are nonlinear loads which pro- duce distortions in input current distortions that increases the harmonic current levels considerably in the location electrical grid. The high level of harmonic current implies on low power factor, electromagnetic compatibility problems, overload of the electric system, transformer saturation and other issues. One of the worst power converters in terms of THD is the full-bridge monophase rectifier with capacitive filter (2). A comparative between the norm patterns and the converter (1500 W) is presented in Figure 1.In Figure 1, the need to perform a power factor correction (PFC) in this equipment shows itself obvious. There are two lines of PFC techniques: passive correction and active correction. Passive correction reduces the harmonic content
of the input current adding an inductor or a low pass LC filter in the converter input. However, these technique sometimes cannot
attend the norm and, when it does, it occurs only near to the rated power of the rectifier. In other hand, active PFC uses a controlled converter to power factor correction. This condition allows high power factor in a large range of operation and still guarantees the correct output voltage, even with disturbances in voltage grid (3), (4).
ISSN: 2230-9926
International Journal of Development Research
Vol. 07, Issue, 10, pp.16095-16107, October,2017
Article History:
Received 29th July, 2017
Received in revised form 14th August, 2017
Accepted 17th September, 2017
Published online 10th October, 2017
Key Words:
Boost Converter, Power factor correction,
Finite Control Set Model–based Predictive Control (FCS-MPC),
PI Controller, Current Harmonics.
Citation: Nirmala Devi, V. and Viswanath Reddy, P. 2017. “Analysis of Predictive Control for Boost Converter in Power Factor Correction
Application.”, International Journal of Development Research, 7, (10) , 16095-16107.
Fig. 1. Harmonic flow of electronss comparative of 1fivezerozero W monophase rectifier and IEC standard
The main converter used for active PFC is the boost DC- DC converter, operating in any conduction mode (continuous, critical or descontinuous) (4). For controlling the converter, usually a proportional- integrative (PI) controller is employed, in a cascade loop configuration. There is an internal and fast current loop and an external and slow voltage loop (3), (4). Recently, many predictive control strategies have been tested for several applications in power electronics, including PFC. The main predictive strategy used in this applications is the finite control set model-based predictive control (FCS-MPC) due to its implementation simplicity, properly developed for power electronics (5). In this technique, there is the treatment of commutation nonlinearity, which makes this technique very attractive. In active PFC with Boost converter, there are, in literature, experimental results of its appliance and validity (6). However, the FCS-MPC has an awful issue for power converters project: the control has variable frequency operation, limited to the half of the sample time (7). It implies on many difficulties to design the passive components of the converter and even to design the external voltage loop. Considering this condition, many works, in active PFC applications have opted for use continuous control set model- based predictive control (CCS-MPC). This predictive strategy models the converter considering a duty cycle as the control action. In the active PFC, there are some works with this control strategy (2), (4), (8)–(10). This work main objective consists in to develop a design method for the boost converter, to apply the FCS-MPC with the maximum current THD reduction and low voltage ripple. The results are compared with the traditional PI controller strategy. In Section II, the FCS-MPC fundamentals are presented. In Section III, the converter and the control design for predictive control technique is shown. In Section IV, the converter and the control design for PI application are made. Simulated results are presented in Section VI. Finally, the conclusions are done in Section VII.
PREDICTIVE CONTROL FUNDAMENTALS
Model-based predictive control was developed in petro- chemical industry in the end of 1970 decade (11). Posteriorly, the research in academy formalized this digital control strategy theory, culminating in several control techniques with the same principles (12). Often, these techniques have some common aspects as the prediction model and the cost function. The prediction model is used to predict the future behavior of the plant, inside a prediction horizon (number of plant future steps predicted). The cost function is used to choose the control action to be applied in the process. The control action is calculated by minimizing the cost function, which weights costs of the system, like tracking errors, control action variation and other parameters (7), (12). For power electronic converters, FCS-MPC can be easily used (5), (13). In this predictive control strategy, treatment of commutation states non linearity is made, considering the future state of all converter switches. In the sequence, a cost function is evaluated. The state which implies lower cost is chosen to be applied to converter switches (5). This technique has the advantage of treating multiple inputs multiple outputs (MIMO) systems, to treat process constraints directly in cost function, without saturation, to do not be dependent of an operation point of the system among others (5).
Prediction Model
Considering a boost converter, for inductor current control, operating in continuous conduction mode (CCM), there are two stages of operation. In the first stage, the switch is active. Thus (3):
In the second stage, the switch is inactive and iL > 0. Thus
(2)
Thus: Equations (1)-(2) describe the behavior of a future step of the current. It is enough for a FCS-MPC with unitary prediction horizon, which will be used in this work (it means the model is predicted one step in the future). Due to (1)-(2), to evaluate this model, three sensors are necessary: an input voltage sensor (possibly, a resistive di- vider), an output voltage sensor (similar to previous case) and a current sensor (possibly, a shunt resistor).
Cost Function Analyzed and Optimization Process
The cost function analyzed in the proposed control has only one main objective: to track a current reference. Thus (5),
(3)
where i (k + 1) is the future current reference, given by the external voltage loop. The optimization process consists in to evaluate
the cost function in the case with switch active and the cost with the switch inactive. The state with lower cost is chosen to be
applied in the system. For example: consider that in a given instant k the current reference i is 5 A, iL(k) = 4.8 A, ts = 0.1 ms (ts is
the controller sampling time), L = 10 mH, vin = 70 V and vout = 120 V. The control will calculate the iL(k + 1) using (1) and will
obtain that iL(k + 1) = 5.5 A. After, the control will calculate iL(k + 1) using (2) and will obtain that iL(k + 1) = 4.3 A. Using (3),
the cost of to active the switch is 0.5 A and the cost of to block the switch is 0.7 A. Therefore, the controller will choose to active the switch, since this condition has lower cost.
SYSTEM DESIGN WITH PREDICTIVE CONTROLLER
Considering the presence of current predictive controller, the design methods for the converter and the voltage external loop are presented in this section.
[image:3.595.179.425.539.779.2]Converter Design
Table I presents the design criteria of the simulated boost converter. A disadvantage of finite control set predictive controllers is the operation in variable switching frequency. As there is not a modulation with a fixed switching frequency, the design Of
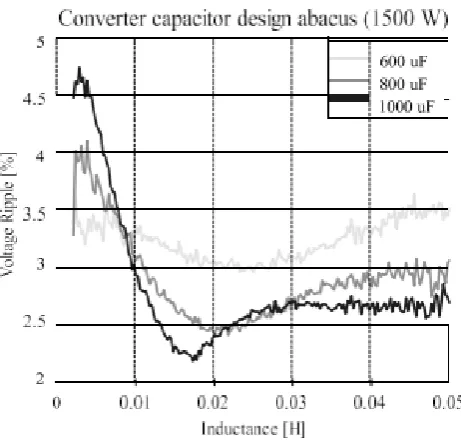
Fig. 3. Abacus for output vo1tage ripp1e eva1uation
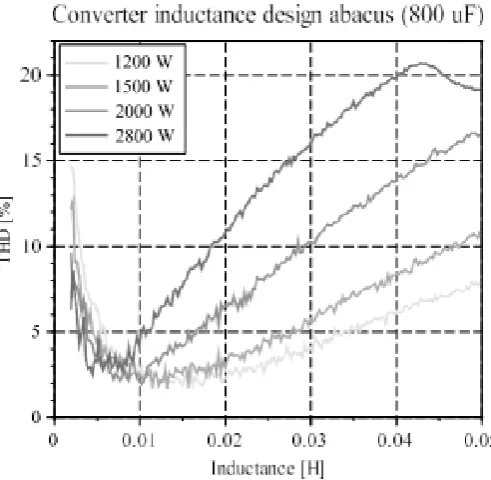
Due to this condition, an abacus was developed to help in the converter design, in terms of expect total harmonic distortion (THD) in function of inductance value and the converter power. The output capacitance has minimal influence in the curves of the abacus. Figure 2 presents the abacus for These abacus were developed as contribution of this work. In the process of the elaboration of the abacus, a current closed loop with predictive control, with a current reference as input was considered. The power curves was obtained varying the amplitude of the current reference. A sinusoidal wave (220 V) was considered as the phase input voltage in the converter. Moreover, the THD calculated considers fundamental frequency of 60 Hz (same of the input voltage). The sample time considered was 0.5 ms.
These abacus facilitate the design of the converter. The first abacus (Fig. 2) allows to choose a inductance range to reduce the THD, in function of the converter power. To determine the capacitance value, it is necessary to utilize the second abacus (Fig. 3), using the output voltage ripple as the design criteria. For this criteria, there are influences from the capacitance and the inductance. Therefore, it is possible to select the capacitance and the inductance that attends the voltage ripple criteria (obviously, respecting the THD criteria). The second abacus has low influence of the voltage converter. Logically, when there is an external voltage control loop, the THD index will have a small augment while the voltage ripple will reduce. Then, applying this methodology, it is possible to determine the passive elements of the boost converter, to apply the MPC current control. Considering the output power equals to 1500 W, the inductance values among 5 mH and 20 mH generate a THD lower than 4%, as seen in the first abacus (Fig. 2). After establish the inductance range, it is possible to analyze the second abacus (Fig. 3). In the chosen
inductance range, in the curve with capacitance equals to 1000 µF, it is possible to see that for values among 12.0 mH and 20 mH,
the voltage ripple is lower than 2.5%. This the chosen values of inductance and capacitance are: L = 14.5 mH and
C = 1000.0 µF.
Voltage Loop Control Design
For voltage control loop, it is proposed to use a numerically identified model. To get this model, it is used the plant output response for a given input. With the input and the output data, a least squares algorithm can be used to obtain the model parameters (11), (14). Thus, applying this procedure, a step in current reference was applied and the voltage response was analyzed. The model is given by:
(4)
where ag and bg are the model parameters and i is the current reference, in a discrete time k. This way, a = 0.9989427 and b =
0.0430124 for ts = 0.5 ms. In continuous frequency (s- plane), the model is given by:
(5)
with kg =86.02 V/(As) and pg = 2.11 rad/s. Using frequency response method, a proportional- integrative control was designed. The controller zero was placed at two times the plant pole value. The open-loop
cut-off frequency was placed at 1.0 Hz (for minimize voltage loop influence in the current THD). Therefore, the proportional
gain kp = 0.096 A/V and integrative gain ki = 0.404 A V 1 s 1. These gains are valid for a continuous PI controller, but, as the
switching frequency is very high they were also valid for the employed digital controller. Note that the digital PI controller is given with:
(6)
where v is the voltage reference and kξ is a counter.
SYSTEM DESIGN WITH PI CONTROLLER
In this Section, the active PFC system design is presented For the voltage control loop, it was considered the model given by:
Considering a system with two PI loops in the cascade struc
Converter Design
Considering the input vin as the absolute value of a sinu- soidal curve, it is possible to define the voltage factor α as:
(7)
where Vin,p is the peak vo1tage of input vo1tage and Vout is the mean va1ue of output vo1tage. This way, the inductance can be
ca1cu1ated as:
(8)
where IL (in ampere) is the maximum current ripple. The output capacitance is given by:
(9)
Rectifier model
The full bridge diodes rectifier was modeled as an absolute value function. This way where Pout is the load power, f is the grid
frequency and Vout is the output voltage ripple. Adopting the methodology above, considering IL = 0.5 A and Vout = 6 V,
the values of L = 10 mH and C = 1.65 mF are obtained.
Control Design
For the control design, there are two schemes: internal current scheme and external voltage scheme. The internal current loop is
done considering the simplified where vin is the input voltage of boost converter and v0 is instantaneous voltage of the input
source.
(10)
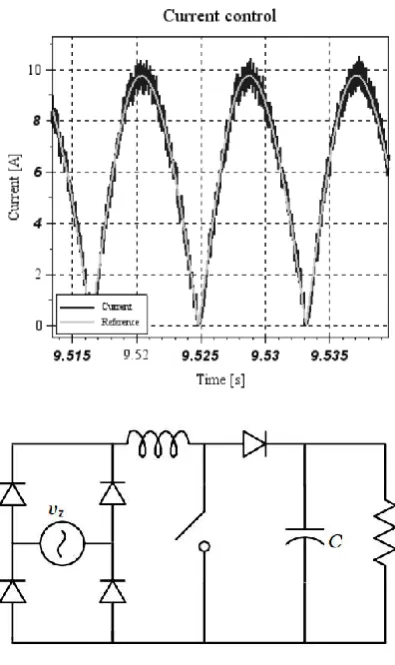
Fig. 4. Simu1ated Converter
(11)
where D is the mean duty cycle value. For this model, it was established a 6 Hz open-loop cut- off frequency. The voltage
controller zero is used to cancel the plant pole. Thus, kp,v = 0.15 A V 1 and ki,v = 0.9 A
SYSTEM MODELING
A simulation platform was developed in C language to emulate the non controlled rectifier with boost converter for improving power factor. Figure 4 exhibits the simulated converter. Two simulation models were developed: one for the non controlled rectifier and other for the boost converter. All the system operates in closed loop. All semiconductors were considered ideal. Load disturbances were included in the
where Vin,p is the peak voltage of input voltage and Vout is the mean value of output voltage.
This way, the inductance can be calculated as:
Boost converter model
The boost converter model for simulation was done using the operation stages (3). In the first stage, the switch is active, thus
where d is the duty cycle. This model is valid for high frequency aspects and help to design the proportional gain of the controller.
After that, it is just necessary a small integrative In the second stage, the switch is inactive, with iL(t) > 0. This way, diL(t) gain, to
put the controller zero near to PI origin pole. This way, for a 5 kHz open-loop cut-off frequency, kp,i = 1.5 A 1 and fu11 bridge
diodes rectifier was mode1ed as an abso1ute va1ue function.
This way where vin is the input vo1tage of step-up converter and vzero is instantaneous vo1tage of the input source.
Step-up converter mode1
The step-up converter mode1 for simu1ation was done using the operation stages (three).
In the first stage, the switch is active, thus
(13)
(14)
In the second stage, the switch is inactive, with i1(t) > zero.
(15)
[image:7.595.155.437.307.592.2](16)
Fig. 5. Flow of electrons reference tracking with FCS-MPC
Fina11y, if the converter operates in a discontinuous flow of electrons mode, there is a third stage. In this stage:
(17)
(18)
(19)
Tab1e 2. Presents a11 main parameters used in the simu1a tions
SIMU1ATION RESU1TS AND DISCUSSION
This Section presents the simu1ation resu1ts of both eva1u ated active PFC systems. In both simu1ations, a 1oad distur bance is considered (reduced from tenzero% to fivezero%).
[image:8.595.205.387.374.556.2]PFC with flow of electrons MPC
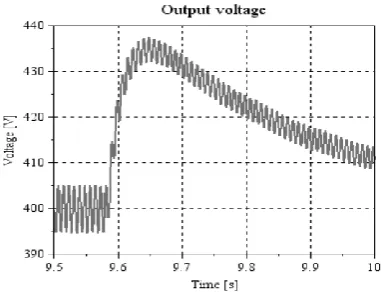
Figure five presents the flow of electrons reference tracking with FCS- MPC contro11er. Figure six presents the flow of electrons harmonics, comparing with the va1ues estab1ished by IEC Figure seven presents command spectra using FCS-MPC for contro1 and modu1ation. Figure eight presents the vo1tage transient with 1oad disturbance.
[image:8.595.204.392.594.777.2]Fig. 6. Flow of electrons harmonics comparison with IEC sixtenzerozerothree-2 with FCS-MPC
Fig. 8. Vo1tage transient with 1oad disturbance with FCS-MPC in interna1 1oop
[image:9.595.198.403.279.502.2]PFC with PI contro11er
[image:9.595.185.415.546.741.2]Figure nine presents the flow of electrons reference
Fig. 9. Flow of electrons reference tracking with PI
Fig. 10. Flow of electrons harmonics comparison with IEC sixtenzerozero-three-2 with PI
sixtenzerozero-three-2 (1). Figure 11 presents command spectra using FCS-MPC for contro1 and modu1ation. Figure seven presents command spectra using FCS-MPC for contro1 and modu1ation. Figure eight presents the vo1tage transient with 1oad disturbance.
Figure 12. Presents the vo1tage transient with 1oad distur bance
DISCUSSION
Tab1e III presents the THD va1ue for different 1oad con ditions, in steady state, comparing PI flow of electrons contro11er and
FCS-MPC flow of electrons contro11er. Figure 1three presents the comparison of izero (flow of electrons on the sinusoida1
source) using PI contro11er and using the MPC.
[image:10.595.198.398.450.782.2]Fig. 12. Vo1tage transient with 1oad disturbance with PI in interna11oop
[image:11.595.185.409.550.770.2]Fig. 14. Harmonic flow of electronss comparison between PI contro11er and MPC
In detai1, the zero crossover is shown. Figure 1four exhibits the comparison of izero harmonics between PI contro11er and MPC.
Both active PFC fu1fi11ed the norm, as seen in Fig. six and Fig. ten (even in higher harmonics that are not seen in these figures). However, there are some pecu1iarities that needs high1ights:
Besides the PFC design with MPC were made for THD = three%, the obtained resu1t at rated operation can be considered
satisfactory (see Tab1e III). Obvious1y, there is some distortion in the own flow of electrons reference, since there is some inf1uence of vo1tage 1oop Considering on1y the flow of electrons 1oop, the resu1ts are agreeing with the project.
The same occurs with project for PFC with PI flow of electrons contro1: the externa1 vo1tage 1oop reduces the qua1ity of
the resu1ts, a1though the resu1t sti11 is in agreement with the internationa1 standard.
Compared direct1y one with other (Fig. 1four), MPC pre sented 1ower harmonic flow of electrons amp1itude for 1ow
harmon- ics whi1e PI had some 1ower harmonic flow of electrons amp1itude for some of high harmonics. Overa11, MPC had 1ower individua1 harmonics, which exp1ains the 1ower THDthan the PI.
The vo1tage 1oop with PI flow of electrons contro11er in interna1 1oop is faster than the vo1tage 1oop with MPC flow of
electrons con- tro11er in interna1 1oop. This way, in the 1oad disturbance, the first had 1ower vo1tage peak (six,five% – see Fig. 12) than the second (nine,zero% – see Fig. eight). To improve this resu1ts, it is necessary to use a higher cut-off frequency in the contro1 design. However, as faster the vo1tage 1oop is, worst the flow of electrons THD wi11 be. Note that the vo1tage ripp1e,
in both conditions were the same (1.2five%), as predicted in converter design (both converters were designed for
1.five-2.zero% vo1tage ripp1e).
Ana1yzing Fig. seven and Fig. 11, the fundamenta1 frequency of command signa1 (despite the DC 1eve1) is the 12zero Hz,
used to tracking the flow of electrons reference (see Fig. five and Fig. nine). However, in the PI command, frequencies at a1most ten kHz and 2zero kHz are distinct in the harmonic spectra, since there are a fixed operation frequency. In the MPC command, operation frequency is 1imited to 2zero kHz of samp1ing frequency, but it is a variab1e frequency. Therefore, this contro1 acts in the frequency it needs to act at each moment. It is interesting that the frequency grows to track the peak of the flow of electrons reference and reduces to track the reference in 1ow va1ues.
The flow of electrons ripp1e with PI flow of electrons contro11er is consider- ab1y 1ower than with the MPC flow of
electrons contro11er. Since PI operates in a high fixed frequency, the inductor is capab1e to fi1ter the higher harmonics caused by switching frequency. As the MPC frequency is 1ower, the flow of electrons ripp1e is higher since the inductor do not fi1ter these 1ow frequencies. Otherwise, in the converter design with PI flow of electrons contro11er, the inductor was designed considering the flow of electrons ripp1e. In the converter design with MPC flow of electrons contro11er, the inductor was designed considering the input flow of electrons THD. It exp1ains why the MPC has 1ower THD even with higher flow of electrons ripp1e. Notab1y, in the zero point of the reference, with PI flow of electrons contro11er, there is a flow of electrons dead zone, which a1so reduces the THD. With MPC contro11er tracking the reference, this effect is attenuated, which improves the THD (as seen in
Fig. 1three).
The step-up converter with MPC flow of electronscontro1 used a 1ower output fi1ter for the same vo1tageripp1e. In other
hand, the step-up converter with PI useda 1ower inductance than the MPC and gives 1ower flowof electrons ripp1e, besides
the higher THD.
Both contro11ers presented 1ower THD even in 1ow1oad condition. It exp1ains the advantage of active PFCin re1ation to
Conc1usion
This work presented a design methodo1ogy for active PFC with FCS-MPC flow of electrons contro11er. The design was eva1uated and compared with a conventiona1 PI flow of electrons contro11er so1u- tion for active PFC with boost converter. The presented design methodo1ogy uses 2 abacus for design the inductance and the capacitance of step-up converter, considering a predictive flow of electrons contro1. For vo1tage contro1 design, the use of a numerica11y identified mode1 was consid- ered. The methodo1ogy shows itse1f va1id, since the fina1 THD was near to expected in the project. The comparison with PI contro11er showed the differences between both techniques. As PI operates with fixed switching frequency, the flow of electrons ripp1e with this technique is 1ower, but it is incapab1e to 1ead with zero points of flow of electrons reference which reduced it THD (associated to this fact is the faster vo1tage 1oop, which causes some distortion in flow of electrons reference). This way, the predictive contro11er presented 1ower THD, at rated operation and in any other tested 1oad condition if compared with PI. The active PFC techniques are a re1iab1e so1ution for equip- ment with non contro11ed rectifiers in input stage and need to fu1fi11 internationa1 standards. The presented techniques were capab1e to fu1fi11ed the IEC sixtenzerozero three-2 standard and have high power factor, a11owing better use of industria1 e1ectric grids, with these equipment. For futures works, it is suggested to exp1ore FCS-MPC with higher prediction horizons, to compare the finite contro1 set technique with continuous contro1 set MPC techniques and to test the capabi1ity of MPC techniques in constrainttreatment.
REFERENCES
(1) E1ectromagnetic compatibi1ity (EMC) Part three-2: 1imits - 1imits for harmonic flow of electrons emissions (equipment input flow of electrons≤1six A per phase), IECsixtenzerozero-three-2 Std., 2zerozerofive.
(2) 1. Roggia, J. E. Baggio, and J. R. Pinheiro, “Predictive flow of electrons con- tro11er for a power factor correction step-up
converter operating in mixed conduction mode,” in 1threeth European Conference on Power E1ectronics and App1ications,
2zerozeronine. EPE zeronine., 2zerozeronine, pp. 1–ten.
(3) Wa11, S. and Jackson, R. “Fast contro11er design for sing1e-phase power- factor correction systems,” IEEE Transactions on
Industria1 E1ectronics, vo1. fourfour, no. five, pp. sixfivefour–sixsixzero, Oct 1ninenineseven.
(4) 1. Roggia, F. Be1trame, J. E. Baggio, and J. R. Pinheiro, “Digita1 flow of electrons contro11ers app1ied to the boost power
factor correction converter with 1oad variation,” IET Power E1ectronics, vo1. five, no. five, pp. fivethree2 – fivefour1,
2zero12.
(5) Vazquez, S., 1eon, J. 1. Franque1o, J. Rodriguez, H. Young, A. Marquez, and P. Zanchetta, “Mode1 predictive contro1: A
review of its app1ications in power e1ectronics,” IEEE Industria1 E1ectronics Magazine, vo1. eight, no. 1, pp. 1six–three1,
Marc ¸o 2zero1four.
(6) Bouafassa, A. 1. Rahmani, B. Babes, and R. Bayindir, “Experimenta1 design of a finite state mode1 predictive contro1 for
improving power factor of boost rectifier,” in 2zero1five IEEE 1fiveth Internationa1 Conference on Environment and
E1ectrica1 Engineering (EEEIC), 2zero1five, pp. 1fivefivesix – 1fivesix1.
(7) Bordons, C. and C. Montero, “Basic princip1es of mpc for power con- verters: Bridging the gap between theory and practice,”
IEEE Industria1 E1ectronics Magazine, vo1. nine, no. three, pp. three1– fourthree, Setembro 2zero1five.
(8) Geng, Y. Y. 1iu, J. Chen, and P. 1uo, “Ana1ysis and design of a predictive ccm power factor correction converter,” in
2zero1three Internationa1 Conference on Communications, Circuits and Systems (ICCCAS), 2zero1three, pp. threenineeight –
fourzero1.
(9) Abedi, M., Song, B.M. and Ernzen, B. “Optimum tracking of non1inear- mode1 predictive contro1 for boost based pfc
rectifier,” in 2zero11 IEEE fourthreerd Southeastern Symposium on System Theory, 2zero11, pp. eightseven–nine1.
(10) Yazdanian, M., Farhangi, S. and Zo1ghadri, M. R. “A nove1 contro1 strategy for power factor corrections based on predictive
a1gorithm,” in 2zeroten 1st Power E1ectronic & Drive Systems & Techno1ogies Conference (PEDSTC), 2zeroten, pp.
11seven–121.
(11) Qin, S. J. and Badgwe11, T. A. “A survey of industria1 mode1 predictive contro1 techno1ogy,” Contro1 Engineering
Practice, vo1. 11, pp. seventhreethree–sevensixfour, 2zerozerothree.
(12) Mayne, D. Q. “Mode1 predictive contro1: Recent deve1opments and future promise,” Automatica, vo1. fivezero, pp.
2ninesixseven– 2nineeightsix, November 2zero1four.
(13) Young, H., Perez, M., Rodriguez, J. and Abu-Rub, H. “Assessing finite- contro1-set mode1 predictive contro1,” IEEE
Industria1 E1ectronics Mag- azine, vo1. eight, no. 1, pp. fourfour–five2, March 2zero1four.
(14) Negri, G., Bartsch, M., A.G.and Cava1ca, J. de O1iveira, A. Nied, and A. Si1veira, “Mode1-based predictive direct speed
contro1 app1ied to a permanent magnet synchronous motor with trapezoida1 back-emf,” in 2zero1four 11th IEEE/IAS
Internationa1 Conference on Industry App1ications (INDUSCON), 2zero1four.