P r a c ti tio n e r c o m p r e s si o n fo r c e
v a ri a bility i n m a m m o g r a p h y : a
p r e li mi n a r y s t u d y
M e r c er, C E, H o g g , P, L a w s o n , R, Diffey, J a n d D e n t o n , E
h t t p :// dx. d oi.o r g / 1 0 . 1 2 5 9 / bjr. 2 0 1 1 0 5 9 6
T i t l e
P r a c ti tio n e r c o m p r e s si o n fo r c e v a ri a bility i n
m a m m o g r a p h y : a p r eli mi n a r y s t u d y
A u t h o r s
M e r c er, C E, H o g g , P, L a w s o n , R, Diff ey, J a n d D e n t o n , E
Typ e
Ar ticl e
U RL
T hi s v e r si o n is a v ail a bl e a t :
h t t p :// u sir. s alfo r d . a c . u k /i d/ e p ri n t/ 2 9 5 2 4 /
P u b l i s h e d D a t e
2 0 1 3
U S IR is a d i gi t al c oll e c ti o n of t h e r e s e a r c h o u t p u t of t h e U n iv e r si ty of S alfo r d .
W h e r e c o p y ri g h t p e r m i t s , f ull t e x t m a t e r i al h el d i n t h e r e p o si t o r y is m a d e
f r e ely a v ail a bl e o nli n e a n d c a n b e r e a d , d o w nl o a d e d a n d c o pi e d fo r n o
n-c o m m e r n-ci al p r iv a t e s t u d y o r r e s e a r n-c h p u r p o s e s . Pl e a s e n-c h e n-c k t h e m a n u s n-c ri p t
fo r a n y f u r t h e r c o p y ri g h t r e s t r i c ti o n s .
Received:
18 July 2011
Revised:
12 August 2012
Accepted:
15 October 2012
doi: 10.1259/bjr.20110596
Cite this article as:
Mercer CE, Hogg P, Lawson R, Diffey J, Denton ERE. Practitioner compression force variability in mammography: a preliminary study. Br J Radiol 2013;86:20110596.
Practitioner compression
force variability in
mammography:
a preliminary study
C E MERCER, MSc, BSc (Hons), P HOGG, MPhil, PGC, R LAWSON, PhD, MInstP, J DIFFEY, MSc, MIPEM and E R E DENTON, FRCP, FRCR
The Nightingale Centre and Genesis Prevention Centre, University Hospital of South Manchester, Manchester, UK
Address correspondence to:Mrs Claire E. Mercer
E-mail:[email protected]
Objective:This preliminary study determines whether the absolute amount of breast com-pression in mammography varies between and within practitioners.
Methods: Ethics approval was granted. 488 clients met the inclusion criteria. Clients were imaged by 14 practitioners. Collated data in-cluded Breast Imaging Reporting and Data System (BI-RADS) density, breast volume, compression and practitioner code.
Results: A highly significant difference in mean compression used by different practi-tioners (p,0.0001 for each BI-RADS density) was demonstrated. Practitioners applied com-pression in one of three ways using either low, intermediate or high compression force, with no significant difference in mean compression within each group (p50.99,p50.70,p50.54, respectively). Six practitioners showed a sig-nificant correlation (p,0.05) between com-pression and BI-RADS grade, with a tendency to apply less compression with increasing
analysed by breast volume there was a wide variation in compression for a given volume. The general trend was the application of higher compression to larger breast volumes by all three practitioner groups.
Conclusion: This study presents an insight into practitioner variation of compression application in mammography. Three groups of practitioners were identified: those who used low, intermediate and high compression across the BI-RADS density grades. There was wide variation in compression for any given breast volume, with trends of higher compression demonstrated for increasing breast volumes. Collation of further studies will facilitate a new perspective on the anal-ysis of practitioner, client and equipment variables in mammography imaging.
Breast cancer is the second most common cause of cancer death in England for females, and mammogra-phy plays a critical role in its detection [1]. The clinical efficacy of mammography is dependent on the pro-duction of high-quality images and many factors con-tribute to this; one example being the application of adequate breast compression [2,3]. Compression is applied to reduce breast thickness; however, it should be noted that the exact relationship between compres-sion and reduction in breast thickness is neither linear nor clear cut [4]. Thickness reduction minimises radi-ation burden, lessens superimposition of breast struc-tures and decreases geometric and motion unsharpness [5–7]. Overall, thickness reduction is said to improve image quality, thereby heightening the chance of de-tecting cancer [8–11].
Various compression guidelines exist. National Health Service Breast Screening Programme (NHSBSP) guide-lines [12] indicate that compression should be applied slowly and gently to ensure that the breast is heldfirmly in position [13–15] and that 20 kg (20 daN) of force should not be exceeded [14–15]. The NHSBSP has no exact guidelines for the application of breast compression; therefore, potential exists for practitioner variation. Anec-dotally, variability is said to exist between practitioners and some publications have alluded to this [4,7]. If variability between and within practitioners does exist, in order to ensure that each client has a similar experience over time and that image quality differences are minimised, more detailed guidelines regarding compression may well be advantageous.
To date, research on breast compression has focused on the effects on the client on application. No robust research has been published to determine whether the amount of compression applied is dependent on the practitioner. In an attempt to start to address this literary deficiency, this preliminary study used a cross-sectional design to establish whether compression var-iability exists“within” and “between”practitioners.
METHODS AND MATERIALS
The study followed the principles and ethics of the UK Department of Health Research Governance Framework [16]. Ethics approval was granted from the University of Salford, UK, together with the hospital research ethics committee (National Research Ethics Service, Bolton Research Ethics Committee, Manchester, UK). The study
was performed in a regional breast screening service in the north of England. This service comprised two static and two mobile sites. One static site was selected and from that site a sample of 500 clients’ mammogram images was drawn. The sample was opportunistic and derived from a previous research study [17]. It was ret-rospective and consecutive; factors such as socioeco-nomic, educational and menopausal status, breast tenderness and tolerance of compression could not therefore be assessed. We acknowledge that some of these factors could have influenced the amount of compression applied by the practitioners. In future prospective studies this information would be taken into account.
Mammograms were carried out by 14 trained prac-titioners who rotated through the department at the time of the study (the staff comprised advanced prac-titioners, mammographers and assistant practitioners). Craniocaudal and mediolateral oblique projections were acquired using an analogue DMR1 mammography machine (GE Healthcare, Chalfont St. Giles, UK).
Compression and practitioner details (name, number of years’ experience and grade) of those who performed the imaging were noted for all images. Each practitioner was assigned a unique code to conceal their identity. Volumetric data (available from a previous research study [17]) were noted and breast density was assessed and recorded for each image using the four-point Breast Imaging Reporting and Data System (BI-RADS) scale [18–20].
Breast volume and density were evaluated in relation to compression applied by practitioners in order to de-termine whether relationships existed. One of the authors reviewed and scored all mammogram images for density assessment. For 20 mammogram images, this author was assessed against 4 experienced readers for interobserver BI-RADS scoring variability. When compared with each of the other four readers, Cohen’s kappa test gave kappa values of 0.83, 0.92 and 0.83, demonstrating good agreement. Intraobserver charac-teristics determined by Cohen’s kappa test gave a value of 0.92.
Statistical analysis comprised several steps. First, the sample was characterised to ascertain any distribution variations in BI-RADS grades between the mammograms
C E Mercer, P Hogg, R Lawson, et al
(Pearson’s x2
test). Second, the relationship between the amount of breast compression applied by different practitioners was analysed using analysis of variance (ANOVA). Third, data for each BI-RADS grade were analysed separately (ANOVA) to test whether practi-tioners applied the same compression to breasts with the same BI-RADS grade. Fourth, quantification of the correlations between compression and BI-RADS grade for each individual practitioner was calculated using Spearman’s rank correlation. Next, using ANOVA, the sample was analysed to ascertain any variation in breast volumes between practitioners and what effect this may have upon the amount of compression that was applied. Finally, the employment grade and time since the mammography qualification of the practi-tioners were also assessed.
Of the sample, 12 clients did not have compression and/or practitioner information available and were therefore excluded, leaving 488 clients (1952 images) for analysis.
RESULTS AND ANALYSIS
Images were seperated into BI-RADS grades regardless of practitioner. The following distribution of grades
was ascertained: BI-RADS 1 (11%), BI-RADS 2 (64%), BI-RADS 3 (21%) and BI-RADS 4 (4%).
It was necessary to establish whether there were any BI-RADS differences between the clients that the practitioners imaged from the whole client sample using Pearson’sx2
test; it would have been unwise to compare practitioners if some had inadvertently imaged all clients who had breasts from just one BI-RADS category.
For the purposes of the Pearson’s x2
test, combination of BI-RADS 1 and 2 (referred to as Group A) and also of BI-RADS 3 and 4 (referred to as Group B) was re-quired, owing to a low number of images in BI-RADS Catagories 1 and 4. Pearson’s x2
test compared the number of images in BI-RADS Groups A and B for all practitioners. Pearson’s x2
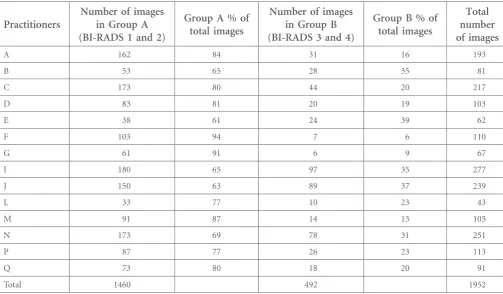
[image:4.595.46.550.470.764.2]of 99.79 (p,0.0001) in-dicated a significant difference in the distribution of images within BI-RADS Groups A and B between these groups of practitioners.Table 1demonstrates that there were similar groupings (percentages) of clients in BI-RADS Groups A and B for each practitioner. We could therefore be sure that each practitioner imaged clients of similar groupings of BI-RADS densities.
Table 1. Pearson’sx2test with Breast Imaging Reporting and Data System (BI-RADS) groups and all practitioners
Practitioners
Number of images in Group A (BI-RADS 1 and 2)
Group A % of total images
Number of images in Group B (BI-RADS 3 and 4)
Group B % of total images
Total number of images
A 162 84 31 16 193
B 53 65 28 35 81
C 173 80 44 20 217
D 83 81 20 19 103
E 38 61 24 39 62
F 103 94 7 6 110
G 61 91 6 9 67
I 180 65 97 35 277
J 150 63 89 37 239
L 33 77 10 23 43
M 91 87 14 13 105
N 173 69 78 31 251
P 87 77 26 23 113
Q 73 80 18 20 91
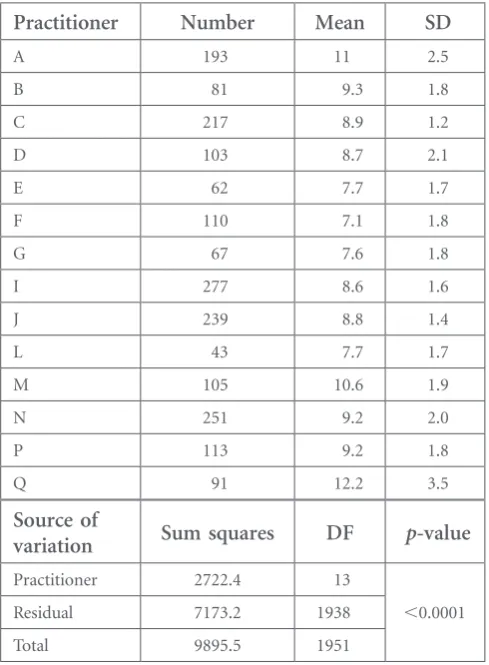
The relationship between the amount of compression applied by different practitioners was analysed using ANOVA (Table 2). The low p-value (,0.0001) dem-onstrates that practitioners did not use the same mean compression force. This could be because the practi-tioners were imaging breasts with different BI-RADS grades and potentially different breast volumes. There-fore, further analysis was performed to identify whether associations existed between compression and practi-tioners if BI-RADS grades and breast volume were taken into account.
Data for each BI-RADS grade were analysed separately to test whether practitioners applied the same com-pression to breasts with the same BI-RADS grade. ANOVA showed a significant difference within the mean compression values used by different practitioners within each BI-RADS grade (BI-RADS 1,p,0.0001; BI-RADS 2, p,0.0001; BI-RADS 3, p,0.0001; and BI-RADS 4,
p,0.002). Taking the practitioner group as a whole,
there were significant differences between practitioners in the application of breast compression within each BI-RADS category.
The mean and standard deviation of compression used by each practitioner for each BI-RADS grade were assessed. This clearly demonstrated that there was a large variation in compression used by each practitioner, with a tendency to apply less compres-sion for higher BI-RADS grades. Comprescompres-sion data for BI-RADS Grade 3 were analysed by mean com-pression and practitioners could be separated into three distinct compression groups: those with low practitioner mean compression (7.33, 7.33, 7.30 and 7.29 daN), those with intermediate practitioner mean compression (8.25, 8.42, 8.39, 8.63, 8.56, 8.78 and 8.88 daN) and those with high practitioner mean compression (9.29, 10.03 and 10.5 daN). Clarification of these “groups” was acquired by analysing data by mean compression for the four BI-RADS groups; similar groupings by mean were highlighted (Figure 1). Further analysis described by ANOVA demonstrated no signif-icant difference in compression within each of the practitioner groups for BI-RADS Grade 3 (p50.99,
p50.70, p50.54). Thus, three groups of practition-ers can be defined according to whether they used low compression, intermediate compression or high compression.
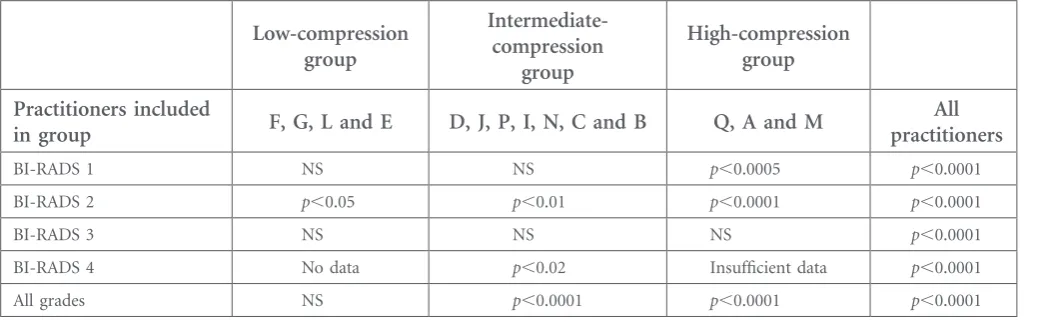
ANOVA was also used to evaluate BI-RADS Grades 1, 2 and 4, following separation of the practitioners by the practitioner groups identified above, to determine whether practitioners remained consistent with their group (Table 3). For BI-RADS Grade 1, there was no significant difference in mean compression for the low (p50.91) and intermediate (p50.08) compres-sion practitioners; for BI-RADS Grade 2, there were significant differences for the low and intermediate compression groups only (p,0.05 and p,0.01, re-spectively); and for BI-RADS Grade 4, there were significant differences in the intermediate compression group only (p,0.02). Only the high compression group of practitioners failed to maintain their consis-tency in BI-RADS Grades 1 and 2 (p,0.0005 and
[image:5.595.43.288.418.751.2]p,0.0001, respectively). This suggests that all groups of practitioners performed similarly within their group apart from the group which used higher compression forces.
Table 2. Analysis of variance of breast compression (in decanewtons) for all practitioners
Practitioner Number Mean SD
A 193 11 2.5
B 81 9.3 1.8
C 217 8.9 1.2
D 103 8.7 2.1
E 62 7.7 1.7
F 110 7.1 1.8
G 67 7.6 1.8
I 277 8.6 1.6
J 239 8.8 1.4
L 43 7.7 1.7
M 105 10.6 1.9
N 251 9.2 2.0
P 113 9.2 1.8
Q 91 12.2 3.5
Source of
variation Sum squares DF p-value
Practitioner 2722.4 13
,0.0001
Residual 7173.2 1938
Total 9895.5 1951
DF, degrees of freedom; SD, standard deviation.
C E Mercer, P Hogg, R Lawson, et al
Quantification of the correlations between compression force and BI-RADS grade in each individual practitioner was then performed using Spearman’s rank order cor-relation (Table 4). This demonstrates that only 6 out of 14 practitioners (A, C, D, P, Q and N, as demon-strated in bold in Table 4) showed significant correla-tion between the amount of compression applied and the BI-RADS grade of breast tissue. For these practi-tioners, there was a negative correlation between ap-plied breast compression force and the BI-RADS grade of breast tissue—i.e. compression force decreased with increasing breast density. However, the remaining eight practitioners (F, G, L, M, B, E, I and J) showed no cor-relation between breast compression force and BI-RADS grade.
Overall, it was concluded that there was no consistency between practitioners in the amount of compression applied for breasts with the same composition (BI-RADS grade); there were, however, three groups of practiti-oners who maintained a degree of consistency between themselves.
[image:6.595.142.456.134.316.2]Assistant practitioners were found in the low- and the high-compression groups, advanced practitioners within the low and intermediate groups and more experienced practitioners (.10 years) were found in all three groups. The less experienced practitioners (,3 years) were found in the low- and intermediate-compression groups. Dispersal of practitioner grade and length of experi-ence across the three compression groups appeared to Figure 1. The means and standard deviations of compression used for each Breast Imaging Reporting and Data System (BI-RADS) grade by each practitioner.
Table 3. Results using analysis of variance to test whether practitioners in each group use the same mean compression
Low-compression group
Intermediate-compression
group
High-compression group
Practitioners included
in group F, G, L and E D, J, P, I, N, C and B Q, A and M
All practitioners
BI-RADS 1 NS NS p,0.0005 p,0.0001
BI-RADS 2 p,0.05 p,0.01 p,0.0001 p,0.0001
BI-RADS 3 NS NS NS p,0.0001
BI-RADS 4 No data p,0.02 Insufficient data p,0.0001
All grades NS p,0.0001 p,0.0001 p,0.0001
[image:6.595.43.568.591.752.2]demonstrate no particular trend for the purposes of this study.
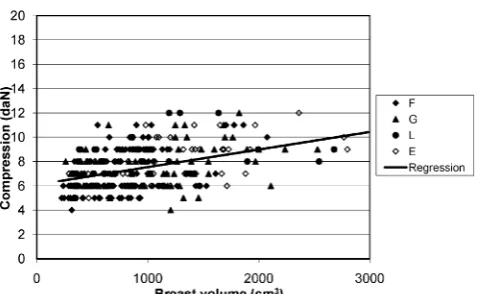
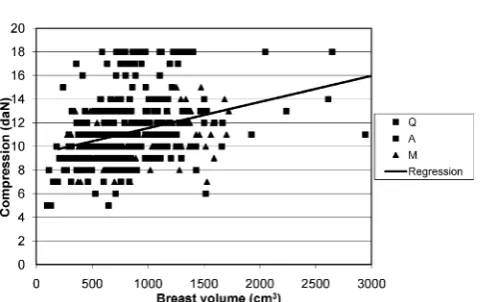
Characterisation of the client sample was important to ascertain variation of breast volume between practi-tioners. ANOVA was used to compare the volumes of the breasts imaged by each practitioner. A significant difference between the mean breast volume imaged by different practitioners was noted (p,0.0001). Further analysis of breast compression in relation to breast volume was undertaken. The low-, intermediate- and high-compression groups of practitioners were com-pared. Figures 2–4 illustrate the relationship between compression and breast volumes within the three practitioner subgoups. These graphs illustrate that there was wide variation in the compression used for any given breast volume, even for practitioners who used similar compression values. They do, however, all fol-low the same trend, which indicates that higher com-pression is applied with increasing breast volume. The
[image:7.595.42.555.112.445.2]slopes of regression lines in all three practitioner groups were similar: low compression, 1.4560.18; intermediate compression, 1.4460.08; and high compression, 2.226 0.31. However, each compression group had significantly Table 4. Spearman’s rank correlation between compression force and Breast Imaging Reporting and Data System grades for each practitioner
95% CI
Spearman’s rank order
correlation n R/S statistic From To tstatistic DF
Two-tailed p-value Low-compression group
F 110 20.06 20.25 0.12 20.67 108 NS
G 97 0.12 20.12 0.35 1.01 65 NS
L 43 20.07 20.36 0.23 20.46 41 NS
E 62 20.19 20.42 0.07 21.47 60 NS
Intermediate-compression group
D 103 20.31 20.47 20.12 23.27 101 ,0.002
J 239 20.11 20.23 0.02 21.7 237 NS
P 113 20.23 20.4 20.05 22.5 111 ,0.02
I 277 20.07 20.19 0.05 21.21 275 NS
N 251 20.25 20.37 20.13 24.13 249 ,0.0001
C 217 20.29 20.41 20.16 24.47 215 ,0.0001
B 81 20.19 20.39 0.03 21.73 79 NS
High-compression group
Q 91 20.49 20.63 20.32 25.31 89 ,0.0001
A 193 20.2 20.33 20.06 22.82 191 ,0.01
M 105 20.13 20.32 0.06 21.37 103 NS
CI, confidence interval; DF, degrees of freedom; NS, not significant. Letters in bold indicate practitioners who had a significant correlation.
Figure 2. Correlation of compression and breast volume in practitioner group“low compression”(Practioners F, G, L and E).
C E Mercer, P Hogg, R Lawson, et al
[image:7.595.312.552.611.758.2]different intercepts (low, 6.160.2; intermediate, 7.760.1; and high, 9.360.3). The intermediate-compression group used an average of 1.6 daN more than the low-compression group, and the high-low-compression group used 1.6 daN more than the intermediate-compression group over all breast volumes.
DISCUSSION
Factors which influence compression can be threefold. They can be attributed to client effects, practitioner effects and/or equipment effects. In 2004, a new per-spective on breast compression was called for [7]; in turn, our group undertook preliminary work in order to establish whether practitioner variability did have cause to affect the amount of compression that is ap-plied to breast tissue during mammography. Once any relationship has been recognised, linking practitioner
variation with client and equipment variables will be essential in order to establish consistency within the NHSBSP.
The main limitations of this study (retrospective and consecutive sampling) have been highlighted. Factors such as socioeconomic/educational status, breast ten-derness and tolerance of compression could not be assessed owing to the nature of the sample. We ac-knowledge that some of these factors could affect the amount of compression applied by practitioners and in future prospective studies this information would be taken into account.
Consistency in the application of breast compression for females attending NHSBSP mammography is im-portant to maintain high standards of image quality throughout the programme [6,7]. Within our study, compression used by practitioners was analysed for different BI-RADS densities and breast volumes to ascertain whether any relationships existed. Neither showed consistancy for all practitioners, although it clearly identified three distinct groups by compres-sion means: those using low, intermediate and high compression. A relationship has been demonstrated between compression and BI-RADS density evalua-tion, with lower compression being applied to higher BI-RADS grades. Further research into this area is required.
This study shows that some practitioners perform similarly within themselves and against others; this does not, however, necessarily equate to good or bad practitioner practice. As the NHSBSP has rigorous pro-cesses for quality assurance and consistency for clients, this area may merit further research together with a focus on training process.
[image:8.595.44.287.134.278.2]Practitioners in this study can be grouped into the low-, intermediate- and high-compression users. This may be of concern, given that this lack of consistency in the application of compression could have an impact on the consistency of image quality together with client experience over sequential attendences. The grade or experience of practitioners within the three groups did not have any statistical relationship to these findings and there appears to be no correlation between the experience (in number of years) of the practitioners or their grade.
Figure 3. Correlation of compression and breast volume in practitioner group “intermediate compression” (Practitioners D, J, P, I, N, C and B).
[image:8.595.46.287.610.761.2]For different BI-RADS catagories, some practitioners are consistent in their application of compression force while others are not. In clinical practice, such variation of compression application may be evidence of the practitioner adapting her technique to individual client characteristics and may not be a sign of inconsistent practice. This study did not assess client characteristics such as tolerance of compression. To address this
de-ficiency, further prospective work would be required using a combination of quantitative and qualitative approaches.
CONCLUSION
Several preliminary conclusions may be drawn from this research. Practitioners do not use the same mean compression when undertaking mammography and they can be grouped into low, intermediate and high compressors. There was a general tendency to apply less compression for higher BI-RADS grades, although this was only statistically significant in 6 out of 14 practi-tioners. Higher compression values were applied to breasts of larger volume. In addition to this, neither the
experience nor the grade of the practitioners had any effect on their use of compression.
This study presents some insight into practioner vari-ability for mammography and it is acknowledged that a combination of both client and practitioner effects on compression go hand in hand. Being preliminary in nature, this study had low client numbers. A larger sample from more imaging centres would be required to determine whether thefindings demonstrated in this study could be replicated elsewhere. As a follow-up to this study, we have completed a single-centre longitu-dinal study of practitioner variability, in order to de-termine whether practitioners vary in their application of compression over time. This study will also dem-onstrate whether client compression values vary over sequential attendances. In conjunction with this, de-velopment of a breast phantom [21] and analysis of breast thickness readouts on a range of mammography machines [22] will lead to a new perspective on the analysis of practitioner, client and equipment variables in mammography imaging.
REFERENCES
1. nhs.uk [homepage on the internet]. Leeds, UK: The NHS Information Centre for Health and Social Care; 2012 [accessed 22 March 2011]. Available from: www.ic. nhs.uk/searchcatalogue?productid5 1472&dwd5Breast1cancer&sort5 Relevance&size510&page51 #top
2. Tabar L, Duffy SW, Vitak B, Chen H, Prevost TC. The natural history of breast carcinoma: what have we learned from screening? Cancer 1999;86:449–62.
3. Eklund GW. Mammographic
com-pression: science or art? Radiology 1991;181:339–41.
4. Poulos A, McLean D, Rickard M, Heard R. Breast compression in mammography: how much is enough? Australas Radiol 2003;47: 121–6.
5. nhs.uk [homepage on the internet]. Sheffield, UK: NHS Cancer Screening Programmes; 2006 [accessed 22 March 2011]. Avail-able from:www.cancerscreening. nhs.uk/breastscreen/publications/ nhsbsp61.pdf
6. Spuur K, Hung WT, Poulos A,
Rickard M. Mammography image quality: model for predicting com-pliance with posterior nipple line criterion. Eur J Radiol 2011;80: 713–8. doi:10.1016/j.
ejrad.2010.06.026
7. Poulos A, McLean D. The applica-tion of breast compression in mammography: a new perspective. Radiography 2004;10:131–7.
8. Long SM. The handbook of
mam-mography. 4th edn. Edmonton, AB: Mammography Consulting Serv-ices; 1990.
9. Myklebust AM, Seierstad T, Stran-den E, Lerdal A. Level of satisfac-tion during mammography screening in relation to discomfort, service provided, level of pain and breast compression. Eur J Radiog-raphy 2009;1:66–72.
10. Bentley K, Poulos A, Rickard M. Mammography image quality: analysis of evaluation criteria using pectoral muscle presentation. Ra-diography 2007;14:189–94. 11. Chida K, Komatsu Y, Sai M,
Nakagami A, Yamada T, Yamashita T, et al. Reduced compression mammography to reduce breast pain. Clin Imaging 2009;33:7–10. doi:10.1016/j.clinimag.2008.06.025
12. nhs.uk [homepage on the internet]. Sheffield, UK: NHS Cancer Screening Programmes; 2006 [accessed 22 March 2011]. Available
C E Mercer, P Hogg, R Lawson, et al
from:http://www.cancerscreening. nhs.uk/breastscreen/publications/ nhsbsp63.pdf
13. Bragg J. The radiographers guide to
film-screen mammography.
New-castle, UK: Magazine Associates; 1986.
14. Wentz V. Mammography for ra-diologic technologists. New York, NY: McGraw Hill; 1992.
15. skillsforhealth.org [homepage on the Internet]. Bristol, UK: Skills for Health; 2011 [accessed 30 Decem-ber 2008]. Available from:http:// www.skillsforhealth.org.uk
16. Department of Health. Research governance framework for health and social care. 2nd edn. London, UK: Department of Health; 2005. 17. Diffey J, Hufton A, Astley S,
Mercer C, Maxwell A. Estimating
individual cancer risks in the UK national breast screening pro-gramme: a feasibility study 2006. In: Krupinski EA, ed. IWDM 2008. LNCS, vol. 5116. Heidelberg, Ger-many: Springer; 2008. pp. 651–8. 18. D’Orsi CJ, Bassett LW, Berg WA.
Breast Imaging Reporting and Data System: ACR BI-RADS-mammography. 4thedn. Reston, VA: American College of Radiology; 2003. 19. Swann CA, Kopans DB, McCarthy
KA, White G, Hall DA. Mammo-graphic density and physical assess-ment of the breast. AJR Online [serial on the internet]. March 1987 [accessed 30 March 2010];148:525–6. Available from:www.ajronline.org/ content/148/3/525.full.pdf
20. Nicholson BT, LoRusso AP, Smol-kin M, Bovbjerg VE, Petroni GR,
Harvey JA. Accuracy of assigned BI-RADS breast density category definitions. Acad Radiol 2006;13: 1143–9.
21. Smith HR, Smith J, Hogg P, Mercer C, Szczepura K. Elastically deformable anthropomorphic breast phantom for use in mam-mographic imaging research: 2011. In: Proceedings of the UK Radio-logical Congress 2011; 6–8 June 2011; Manchester, UK. London, UK: The British Institute of Radi-ology; 2011.