IJPSR (2014), Vol. 5, Issue 4 (Research Article)
Received on 06 November, 2013; received in revised form, 20 January, 2014; accepted, 10 March, 2014; published 01 April, 2014
BOX-BEHNKEN DESIGN FOR DEVELOPMENT AND OPTIMIZATION OF
ACETAZOLAMIDE MICROSPHERES
Marwa H. Abdallah
Department of Pharmaceutics and Industrial Pharmacy, Faculty of Pharmacy, Zagazig University, Zagazig, Egypt
ABSTRACT: This study describes a Box-Behnken experimental design to optimize the formulation of Acetazolamide (ACZ) loaded microspheres by solvent evaporation method using Eudragit RS100 as a polymer. The prepared microspheres were evaluated for their production yields, particle size distribution, morphology, entrapment efficiency % and drug release characteristics. Box-Behnken design produced fifteen formulations containing specified amounts of the independent variables, drug: polymer ratio (X1), surfactant
concentration % (X2) and stirring rate (rpm) (X3), the dependent
factors studied were entrapment efficiency % (Y1), % drug released
after 6 hrs (Y2) and particle size (µm) (Y3). Acetazolamide-loaded
microspheres were spherical in shape and had a smooth surface. The results showed that the production yield of the prepared microspheres was found to be between 70.45 and 92.98%. The formulated microspheres exhibited acceptable entrapment efficiency % values in the range of 34.84 to 76.19%. The computer optimization process, surface and contour plots predicted the levels of independent variables X1, X2 and X3 (1:5, 0.5 and 890, respectively), for maximized response
of EE% (80.25%), controlled release of drug (39.11%) and optimized particle size (1043.05 µm). The Box-Behnken factorial design illustrated the role of the derived polynomial equations and surface plots in predicting the values of dependent variables for the formulation and optimization of acetazolamide microspheres. This study proved that Box-Behnken factorial design could efficiently be applied for modeling of acetazolamide microspheres.
INTRODUCTION: A well designed controlled drug delivery system can overcome some of the problems of conventional therapy and enhance the therapeutic efficacy of a given drug.
QUICK RESPONSE CODE
DOI:
10.13040/IJPSR.0975-8232.5(4).1228-39
Article can be accessed online on:
www.ijpsr.com
DOI link: http://dx.doi.org/10.13040/IJPSR.0975-8232.5(4).1228-39
To obtain maximum therapeutic efficacy, it becomes necessary to deliver the agent to the target tissues in the optimal amount in the right period of time thereby causing little toxicity and minimal side effects. There are various approaches in delivering a therapeutic substance to the target site in a sustained controlled release fashion. One such approach is using microspheres as carriers for drugs 1. Microspheres are one of the multi-particulate drug delivery systems and are prepared to obtain prolonged drug delivery, to improve
Keywords:
Microspheres, Acetazolamide, Eudragit RS100, Box-Behnken,
Microencapsulation
Correspondence to Author:
Marwa H. Abdallah
Department of Pharmaceutics and Industrial Pharmacy, Faculty of Pharmacy, Zagazig University, Zagazig, Egypt
Email:
bioavailability or stability and to target drug to specific sites 2. Microspheres can be defined as solid, approximately spherical particles ranging from 1 to 1000μm, containing dispersed drug in either solution (or) microcrystalline form 3. Emulsion-solvent evaporation is one of the microencapsulation methods that can be used to coat a water insoluble drug with a water insoluble polymer for sustaining the drug release 4.
Microspheres are formed by the evaporation of an organic solvent from dispersed oil droplets containing both polymer and drug 5. Eudragit (Rohm Pharma) are series of acrylate and methacrylate polymers available in different grades and possessing a range of physicochemical properties 6. Some dissolve rapidly at clearly defined pH values, whereas two grades, Eudragit® RL100 and RS100, are insoluble in aqueous media and digestive juices, but swell and are permeable, which means that the drugs can be released by diffusion 7.
Acetazolamide (the most effective carbonic anhydrase inhibitor, CAI) is used orally in large doses for the reduction of intraocular pressure (IOP) in patients suffering from glaucoma. This treatment leads to unpleasant systemic side effects such as central nervous system (CNS) depression, renal failure, diuresis, vomiting, anorexia, and metabolic acidosis, therefore, there is an urgent need to develop new drug delivery systems 8. Various experimental designs are useful in developing a formulation requiring less experimentation and providing estimates of the relative significance of different variables 9. In this study, a Box-Behnken design was used to optimize microspheres containing acetazolamide. The independent variables selected were drug: polymer ratio (X1), surfactant concentration % (X2) and
stirring rate (rpm) (X3) to evaluate their separate
and combined effects on entrapment efficiency (Y1), % drug released after 6 hrs (Y2) and particle
size (µm) (Y3).
The aim of the present research was to develop a controlled drug delivery system of acetazolamide for oral administration using Eudragit RS100 as a polymer and emulsion solvent evaporation technique applying Box-Behnken design to choose the optimum formulation which exhibit maximum entrapment efficiency and controlled drug release.
MATERIALS AND METHODES:
Materials: Acetazolamide (ACZ) was a gift sample kindly supplied by Chemical Industries Development (CID) Pharmaceutical Company, Cairo, Egypt. Eudragit® RS100 (ERS100) was kindly supplied by Rohm Pharma, Darmstadt, Germany. Dichloromethane, ethanol, and sodium lauryl sulphate (SLS) were purchased from El-Gomhorea Chemical Company, Cairo, Egypt. All other chemicals were obtained from El-Nasr Pharmaceutical Chemical Co., Cairo, Egypt.
Methods:
Preparation of Acetazolamide-loaded Micro-spheres: The acetazolamide-loaded Eudragit microspheres were prepared by the conventional emulsion solvent evaporation method which was adapted from the process described by Patel et al. (2013) 10. The required amount of Eudragit® RS100 (ERS100) was dissolved in 10ml of a mixture of dichloromethane and ethanol (1:1 v/v). The calculated amount of ACZ powder was dissolved in the polymeric solution. The prepared dispersion was slowly poured into 100 ml aqueous solution containing (0.5-1.5% w/v) sodium lauryl sulphate (SLS) aqueous solution and was emulsified by vigorous stirring at (800, 1000, and 1200 rpm) at room temperature using a three-blade mechanical stirrer (Heidolph PZP –200, Germany).
The dispersed drug and polymer were immediately transformed into fine droplets, which were subsequently solidified into rigid microspheres due to solvent evaporation. Stirring was continued for 3-4 hrs until all solvent was evaporated. The formed microspheres were allowed to settle, filtered and washed several times with distilled water 11. The microspheres were dried and stored in air tight containers until further analysis.
Particle size analysis: Microspheres (50 mg) were suspended in distilled water (5mL) containing 2%w/v of tween 80, to prevent microspheres aggregation, the above suspension was sonicated in water bath and the particle size was expressed as volume mean diameter in micrometer using laser diffraction technique (Mastersizer 2000 Ver. 5.22, Malvern instruments Ltd., UK) 13.
Production yield determination: The yield of the microspheres was determined by dividing the weight of the prepared microspheres by the original amount of the polymer and drug used, the results were expressed as a percentage according to the following equation 11:
Entrapment efficiency determination: The entrapment efficiency % of the prepared microspheres was evaluated using the method of Gangadhar et al (2010)14 with certain modification. About 25mg of the obtained microspheres were crushed into powder and were completely dissolved in 100ml of PBS (pH 7.4) and agitated in mechanical shaker for 6 hrs then kept for 24 hrs. Then 5ml of the solution was filtered and the concentration of the drug was determined spectrophotometrically at 265 nm. The actual drug loading and entrapment efficiency (EE %) were calculated using the following equations 15:
In- vitro dissolution studies of acetazolamide-loaded microspheres: In- vitro dissolution studies were carried out on the microspheres at (37 ± 0.5
o
C) at 100 rpm with USP Dissolution Apparatus II (Type II, rotating paddle, Pharma test, West Germany). Since the permeability of a drug through Eudragit® RS100 is independent on the pH, the pH value of the tested dissolution medium was set at 7.4 16. Dissolution of ACZ from the prepared microspheres was carried out using microspheres equivalent to 125mg of the drug; 500 ml of PBS (pH 7.4) was used as a dissolution medium and maintained at (37 ± 0.5oC). At various time intervals, 3ml samples of the dissolution medium were taken and replaced with an equal volume of pre-warmed fresh medium to maintain constant
volume. The drug concentration and the percentage drug released were determined with respect to time spectrophotometrically at max 265 nm 17. The in-vitro dissolution studies were performed in triplicate for each of sample and the results were reported as means ± SD.
Box-Behnken experimental design: Traditional designing of pharmaceutical formulations are based on time consuming approach of changing one variable at a time which doesn't take into consideration the joint effects of independent variables. Thus, factorial design can serve as an essential tool to understand the complicity of pharmaceutical formulations 18. The design of experiments (DOE PRO XL) technique was used to provide an efficient means to optimize the emulsion solvent evaporation process for microspheres preparation. DOE is an approach for effectively and efficiently exploring the cause and effect relationship between numerous processes variables and the output.
A sequence of experiments were performed that would yield the most information about the factors and their interactions in as few experiments as possible (15 runs). A 3-factor 3-level factorial Box-Behnken experimental design technique was employed to investigate the variables 19. Independent variables with their levels and the dependent variables selected are listed in the
(Table 1). An interactive second order polynomial model was utilized to evaluate both the response variables. The polynomial equation generated by this experimental design using Microsoft Excel is described as equation 1:
Yi = b0 + b1X1 + b2X2 + b3X3 + b12X1X2 + b13X1X3
+ b23X2X3 + b11X12 + b22X22 + b33X32 (1)
Where Yi is the dependent variable while b0 is the
intercept; b1 to b33 are the regression coefficients
which were determined from the results of the experiment to identify the statistically significant terms, X1, X2 and X3 are the independent variables
and levels of independent variables were selected from the preliminary experiments. Coefficients with more than one factor term (b12, b13, and b23)
and those with higher order terms (b11, b22, and b33)
TABLE 1: INDEPENDENT AND DEPENDENT VARIABLES AND THEIR LEVELS IN BOX-BEHNKEN DESIGN.
Independent variables Levels
Low Medium High
X1= Drug: polymer ratio.
X2= Surfactant concentration (%).
X3= Stirring rate (rpm).
Transformed values
1:5 0.5 800 -1
1:3 1.0 1000
0
1:1 1.5 1200
1
Dependent variables Constraints
Y1= Entrapment Efficiency (%).
Y2= % Drug released after 6 hrs.
Y3= Particle size (µm).
Maximize Minimize Optimize
Statistical analysis: All data were expressed as mean ± SD. The number of experiments (n) used to calculate a mean value was at least 3. An analysis of variance (ANOVA test) was used to compare sample means and to determine statistical significance. All the results were considered statistically significant if P < 0.05 20.
RESULTS AND DISCUSSION:
Morphology of the Acetazolamide Micro-spheres: The particles obtained by emulsion solvent evaporation were generally nearly spherical in shape with smooth surface as shown on the picture in Figure 1.
A
[image:4.612.75.264.398.737.2]B
FIGURE 1: PHOTOMICROGRAPHS OF
ACETAZOLAMIDE-LOADED ERS100 MICROSPHERES, (A, FORMULATION NO 4 AND B, FORMULATION NO 11) (X=40).
Production yield determination: The range of the production yield of the prepared ACZ microspheres was found to be between 70.54%±1.98 and 92.98±1.23 (the results are not shown). The highest microspheres yield was obtained in case of formulation no 9 in which stirring rate was low (800 rpm) in combination with lower surfactant concentration (0.5%). In addition, at the highest stirring rate (1200 rpm) but at the same surfactant concentration (0.5%), a lowest microspheres yield was obtained as case of formulation no 10, due to the loss of smallest and lightest particles during filtration and washing processes 11.
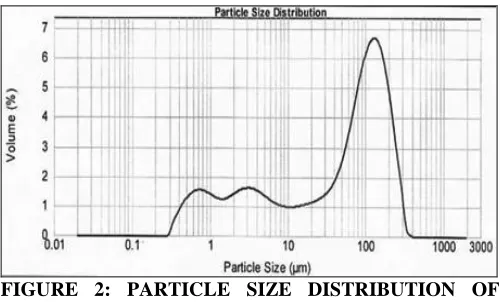
Particle size distribution: The mean diameter of microspheres was determined by laser diffractometer (Figure 2). The mean diameter ranged from 172.58±5.69µm to 1062.91±13.78µm
(Table 2).Stirring rate is the maximum parameters for controlling the drug/matrix dispersion's droplets size in the continuous phase during preparation of microspheres 21. It was shown that increasing the stirring rate results in a marked decrease in the microspheres size, as it produces smaller emulsion droplets through stronger shear forces. In this study high stirring rate (1200 rpm) produced Eudragit RS100 microspheres with small particle size while low stirring speed (800 rpm) produced microspheres with large particle size.
[image:4.612.314.564.592.743.2]Entrapment efficiency % determination:
Entrapment efficiency % values of different microspheres formulations showed wide variation, ranging from 34.84±1.48% to 76.19±1.18% (Table 2). The maximum entrapment efficiencies of acetazolamide into microspheres were 76.19% for formulation 5, they were found to be significantly different (p<0.05) depending on the variation of drug concentration and stirring rate. The highest entrapment efficiency of formulation 5 can be explained due to the increased amount of ACZ per unit polymer 22. Microspheres formulated by using lower stirring rate (800 rpm) in combination with lower surfactant concentration were found to have higher EE% (formulation 9) (Table 2). On the other hand, the formulations prepared by using higher stirring rate and higher surfactant concentrations have lower drug EE%, as the case of formulation 12 (47.41 %).
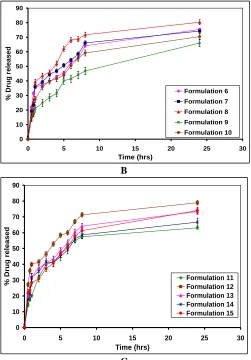
In- vitro dissolution studies of acetazolamide-loaded microspheres: The percent of the drug released after 6 hrs ranged from 41.48±2.54 % to 68.06±1.24%. The percent release of ACZ from different formulations is shown in Figure 3. Drug release from all the formulations was slow and sustained over 6 hrs. The drug release rate was increased on increasing the stirring rate. Acetazolamide release was higher in case of microspheres prepared at a higher stirring rate (formulation 8) but at low stirring rate the release rate was slow (formulation 9), at a higher stirring rate microspheres had a smaller particle size and larger surface area exposed to release medium, giving rise to faster drug release 23. The difference in drug release was statistically significant (P< 0.05) at different stirring rate.
0 10 20 30 40 50 60 70 80 90
0 5 10 15 20 25 30
Time (hrs)
% Drug
r
ele
as
ed
Formulation 1 Formulation 2 Formulation 3 Formulation 4 Formulation 5
A
0 10 20 30 40 50 60 70 80 90
0 5 10 15 20 25 30
Time (hrs)
%
D
ru
g
r
el
eased
Formulation 6 Formulation 7
Formulation 8 Formulation 9
Formulation 10
B
0 10 20 30 40 50 60 70 80 90
0 5 10 15 20 25 30
Time (hrs)
%
D
ru
g
r
el
eased
Formulation 11 Formulation 12 Formulation 13 Formulation 14 Formulation 15
C
FIG. 3: IN VITRO RELEASE OF ACETAZOLAMIDE FROM MICROSPHERES FORMULATIONS 1-15
Experimental Box-Behnken Design: Box–
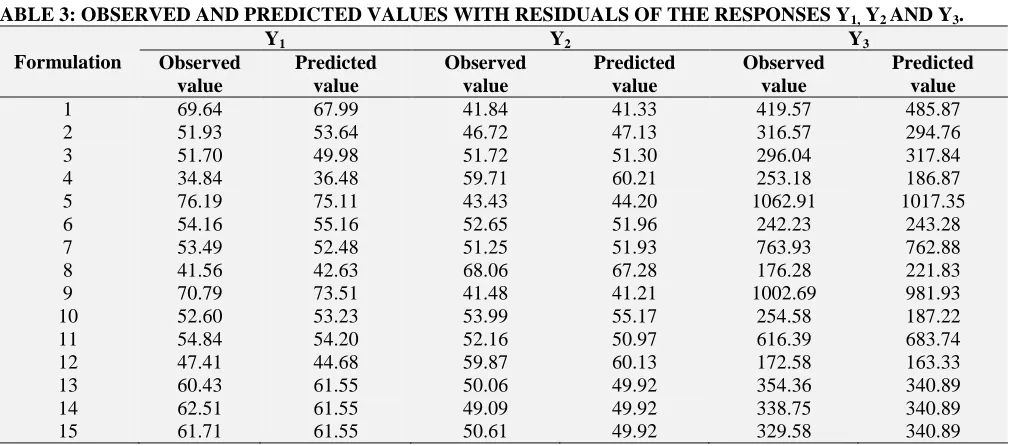
Behnken experimental design was applied in this study to optimize the formulation parameters of acetazolamide microspheres for maximum entrapment percent, optimum particle size and controlled percent drug release. The Box-Behnken design was specifically selected since it requires fewer treatment combinations than other design in cases involving three or four factors. Transformed values of all the formulations along with their responses are shown in Table 2.
[image:5.612.315.566.41.401.2]TABLE 2: BOX-BEHNKEN EXPERIMENTAL DESIGN WITH MEASURED RESPONSES FOR ACETAZOLAMIDE MICROSPHERES.
Formulation
Independent Variables Dependent Variables
X1 (Drug: polymer ratio) X2 (Surfactant conc.) X3 (Stirring rate) Y1 (EE% ± SD)
Y2 (% release after
6 hrs ± SD)
Y3 (MD± SD) 1 2 3 4 5 6 7 8 9 10 11 12 13 14 15 1:5 1:5 1:1 1:1 1:5 1:5 1:1 1:1 1:3 1:3 1:3 1:3 1:3 1:3 1:3 0.5 1.5 0.5 1.5 1 1 1 1 0.5 0.5 1.5 1.5 1 1 1 1000 1000 1000 1000 800 1200 800 1200 800 1200 800 1200 1000 1000 1000 69.64±1.31 51.93±1.12 51.70±0.31 34.84±1.48 76.19±1.18 54.16±0.75 53.49±0.91 41.56±1.34 70.79±1.88 52.60±1.31 54.84±1.99 47.41±0.94 60.43±1.03 62.51±1.38 61.71±1.42 41.84±1.16 46.72±1.08 51.72±0.39 59.71±0.47 43.43±0.55 52.65±0.54 51.25±1.01 68.06±1.24 41.48±2.54 53.99±0.74 52.16±1.19 59.87±0.39 50.06±1.46 49.09±1.75 50.61±0.57 419.57±8.28 316.57±3.84 296.04±7.83 253.18±2.75 1062.91±13.78 242.23±5.39 763.93±3.40 176.28±7.55 1002.69±4.06 254.58±3.96 616.39±4.67 172.58±5.69 354.36±3.78 338.75±5.85 329.58±7.43 The polynomial equations relating the responses
Y1, Y2, Y3 and the independent variables were:
Y1= 61.55 – 8.79X1 – 6.96X2 − 7.45X3 + 0.21X1X2
+ 2.52X1X3 +2.69X2X3 – 4.79X12 − 4.73X22 –
0.41X32 (2)
Y2= 49.92 + 5.76X1 + 3.68X2 + 5.78X3 + 0.78X1X2
+1.89X1X3 –1.19X2X3 +1.03X12 – 0.95X22 +2.91
X32 (3)
Y3=340.90 – 68.98X1 – 80.52X2 − 328.78X3 +
15.03X1X2 + 58.26X1X3 +65.57X2X3 +18.86X12 −
38.42X22 +201.58X32 (4)
These equations represent the quantitative effect of process variables (X1, X2, and X3) and their
interactions on the three responses (Y1, Y2 and Y3).
The values of X1, X2 and X3 were substituted in the
equation to obtain the theoretical values of Y1, Y2
and Y3. The theoretical (predicted) values and the
observed values were in reasonably good agreement as seen from (Table 3).
TABLE 3: OBSERVED AND PREDICTED VALUES WITH RESIDUALS OF THE RESPONSES Y1, Y2 AND Y3.
Formulation
Y1 Y2 Y3
Observed value Predicted value Observed value Predicted value Observed value Predicted value 1 2 3 4 5 6 7 8 9 10 11 12 13 14 15 69.64 51.93 51.70 34.84 76.19 54.16 53.49 41.56 70.79 52.60 54.84 47.41 60.43 62.51 61.71 67.99 53.64 49.98 36.48 75.11 55.16 52.48 42.63 73.51 53.23 54.20 44.68 61.55 61.55 61.55 41.84 46.72 51.72 59.71 43.43 52.65 51.25 68.06 41.48 53.99 52.16 59.87 50.06 49.09 50.61 41.33 47.13 51.30 60.21 44.20 51.96 51.93 67.28 41.21 55.17 50.97 60.13 49.92 49.92 49.92 419.57 316.57 296.04 253.18 1062.91 242.23 763.93 176.28 1002.69 254.58 616.39 172.58 354.36 338.75 329.58 485.87 294.76 317.84 186.87 1017.35 243.28 762.88 221.83 981.93 187.22 683.74 163.33 340.89 340.89 340.89 In order to obtain a formulation having higher
entrapment efficiency, controlled release and optimized particle size, optimization was used to
[image:6.612.55.560.472.695.2]Concerning the P-values of the coefficients, X1, X2,
X3, X1X3, X2X3, X12 and X22 were found to have
significant effects on the performance of the model for the prediction of the entrapment efficiency (%), X1, X2, X3, X1X3, X2X3, X12, X22 and X32 of the
percent release and X1, X2, X3, X1X2, X1X3, X2X3,
X22 and X32 of the particle size. The value of the
correlation coefficient (R2) for EE%, % of ACZ released after 6 hrs and mean diameter of microspheres was found to be 0.970, 0.972 and 0.980 respectively, indicating good fit.
A coefficient with positive sign represents a synergistic effect of the factor on the response, while a negative sign indicates an antagonistic effect. Coefficients with P-value less than 0.05 had a significant effect on the prediction efficacy of the model for the measured response. As illustrated in
(Table 4), a P value of 0.05 for independent
variables and their interaction in analysis of variance (ANOVA) indicates significant effect of the corresponding factors on the Y1, Y2 and Y3.
Observed significance probabilities of less than 0.05 (P0.05) are often considered evidence of a regression effect. A Prob > F of 0.00 indicated a significant effect of the independent factors on the responses (Y1, Y2 and Y3), respectively. As shown
in (Table 5), the test for lack of fit does not yield statistical significance (P> 0.05) for Y1, Y2 and Y3,
and hence, we can be assured that the current model provides a satisfactory fit to the data (there is no lack of fit). For lack of fit P value was obtained 0.070 for EE%, 0.062 for % drug released after 6 hrs and 0.423 for particle size, and hence the current model provided a satisfactory fit to the data (P>0.05) and had no lack of fit.
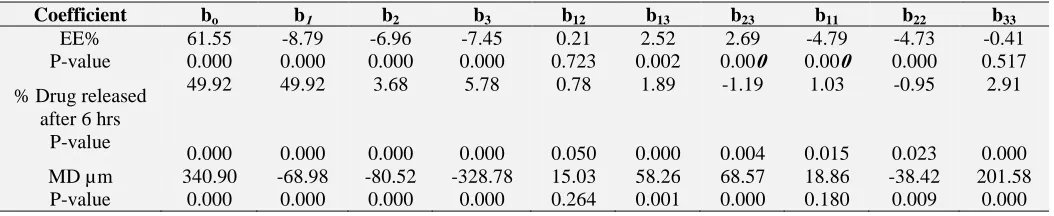
TABLE 4: SUMMARY OF RESULTS OF REGRESSION ANALYSIS FOR THE DEPENDENT VARIABLES OF ACETAZOLAMIDE MICROSPHERES
Coefficient bo b1 b2 b3 b12 b13 b23 b11 b22 b33
EE% P-value 61.55 0.000 -8.79 0.000 -6.96 0.000 -7.45 0.000 0.21 0.723 2.52 0.002 2.69 0.000 -4.79 0.000 -4.73 0.000 -0.41 0.517 % Drug released
after 6 hrs P-value 49.92 0.000 49.92 0.000 3.68 0.000 5.78 0.000 0.78 0.050 1.89 0.000 -1.19 0.004 1.03 0.015 -0.95 0.023 2.91 0.000 MD µm P-value 340.90 0.000 -68.98 0.000 -80.52 0.000 -328.78 0.000 15.03 0.264 58.26 0.001 68.57 0.000 18.86 0.180 -38.42 0.009 201.58 0.000
TABLE 5: SUMMARY OF RESULTS OF ANALYSIS OF VARIANCE (ANOVA) THE DEPENDENT VARIABLES OF ACETAZOLAMIDE MICROSPHERES.
Regression Df SS MS F value Sig F (P value) FLOF Sig FLOF
EE% 9 4981.1 553.5 129.0612 0.000 17.72 0.070
% Drug Released after
6 hrs 9 2109.5 234.4 133.1793 0.000 4.33 0.062
Mean Diameter 9 3447124.7 383013.9 181.9076 0.000 346.33 0.423 ANOVA indicates analysis of variance; EE % indicates entrapment efficiency percentage of drug; Df, degrees of freedom; SS, sum of squares; MS, mean of squares; F, Fischer's ratio andFLOF lack of fit.
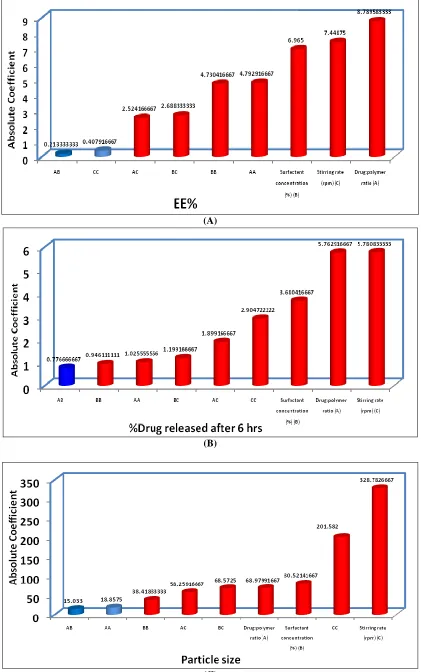
The relationship between the dependent and independent variables was further studied using surface, contour and pareto plots. The standardized pareto charts depict the main effect of the independent variables on the entrapment efficiency, percentage of drug released after 6 hrs and particle size of the microspheres as shown in Figure 4. The length of each bar in graph indicates the effect of these factors on the responses. The highest effect was observed for X1 (drug: polymer ratio), X3
(stirring rate, rpm) and X2 (surfactant concentration
%) on the entrapment efficiency, on the other hand, the highest effect was observed for X3 (stirring rate,
rpm), X1 (drug: polymer ratio) and X2 (surfactant
concentration %) on the percentage of drug released after 6 hrs. Also, the highest effect was observed for X3 (stirring rate, rpm) on the particle
size.
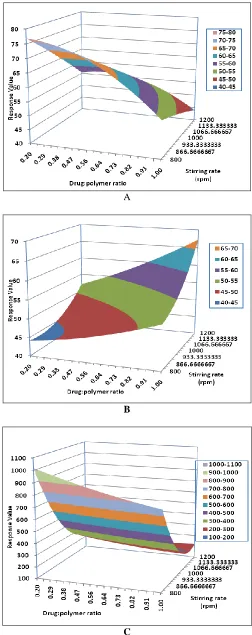
The effects of X1 and X2 and their interaction at a
middle level of X3 (X3= 1000) on Y1, Y2 and Y3 are
given in Figure 5. It was clear that, Y1 increased
from 65-70 % when X1 increased from 0.2 to 0.5
and surfactant concentration, X2 increased from 0.5
to 0.9%. It was determined that a lower value of Y2
(40 to 45%) could be obtained with an X1 level
range from 0.2 to 0.78 and an X2 level range from
[image:7.612.44.571.324.432.2](A)
(B)
(C)
[image:8.612.118.539.43.715.2]Also, the mean diameter of prepared microspheres (Y3) increased from 450 to 500 µm when X1 level
increased from 0.2 to 0.33 and X2 level increased
from 0.5 to 0.82 %. Low concentration of polymer resulted in a low viscosity of the polymer solution which in turn resulted in smaller emulsion droplets in the aqueous phase resulting in a marked decrease in the particle size of the prepared microspheres 24. It is evident from the contour plot that the low level of both X1 and X2 favors EE%,
controls the % of ACZ released from microspheres and optimize the particle size.
The results are in agreement with those of Gangadhar et al (2010) 14 who reported that, the increase in the polymer concentration, the rate and amount of indomethacin released was found to decrease, which can be attributed to the greater binding of the drug with the polymer.
A
B
C
FIGURE 5: Y-HAT SURFACE PLOT SHOWING THE EFFECT OF THE INDEPENDENT FACTORS ON Y1 (a), Y2 (b) AND Y3 (c) OF ACETAZOLAMIDE
MICROSPHERES AT CONSTANT X3= 0.
The effects of X1 and X3 with their interactions on
Y1, Y2 and Y3 at a medium level of X2 (X2= 1 %)
are shown in Figure 6. At low levels of X1, Y1
increased from 75% to 80% when X1 increased
from 0.2 to 0.55 and X3 ranged from 800 to 890
rpm. It was determined from the surface plot that a low value of Y2 (40% to 45%) could be obtained
for a combination of the two independent variables, the X1 level in the range of 0.2 to 0.69, and the X3
level in the range of 800 to 1089 rpm.
In addition to, the mean diameter of prepared microspheres (Y3) increased from 850 to 1000µm
when X1 level increased from 0.2 to 0.65 and X3
level increased from 800 t0 844 rpm. It was evident from the surface plots that the low levels of both X1 and X3 improved the EE% and sustained
the % drug released after 6 hrs of ACZ from ERS100 microspheres.
The results are in accordance with those of Chaisri et al (2009) 12 who reported that, the encapsulation of the drug increased with decreasing the stirring rat.
Similar results were reported by Patel et al (2012)
25
[image:9.612.49.299.313.755.2]Figure 7a shows the surface plot for Y1 plotted at a
0 level of X1. The high value of EE% can be
obtained from a combination of the 2 independent variables, at the X2 level in the range of 0.5 to
0.87%, and the X3 level in the range of 800 to 844
rpm. But above these values, EE% decreased to 40%. Similarly, Figure 7b illustrates the surface plot for Y2 drawn at a 0 level of X1.
Microspheres formulation of controlled release can be obtained by a combination of the 2 independent variables, at the X2 level in the range of 0.5 to
1.1%, and the X3 level in the range of 800 to 1067
rpm. But above these values Y2 increased to 63%.
It is evident from the surface plots that, the low level of X2 and low level of X3 decreased the %
drug released after 6 hrs.
Also, the mean diameter of prepared microspheres (Y3) increased from 900 to 1000µm when X2 level
increased from 0.5 to 0.85 and X3 level increased
from 800 to 822 rpm, Figure 7 c.
Optimum formulation: After establishing the relationship between the dependent and independent variables, the process was optimized. A computerized optimization procedure was used to obtain the levels of drug: polymer ratio, surfactant concentration and stirring rate at which a maximized EE%, optimized particle size and controlled released could be obtained.
The combination of factor levels leading to attainment of optimized responses were 1:5, 0.5% and 890.82 rpm for drug: polymer ratio, surfactant concentration % and stirring rate (rpm), respectively. The predicted optimum values found were 80.25%, 39.11% and 1043.05 µm for entrapment efficiency %, percent released of ACZ after 6 hrs and mean particle size, respectively.
Microspheres were prepared at the optimum levels and the resultant microspheres were evaluated for the responses. The observed value of EE% and % ACZ released after 6 hrs were found to be 79.01%, 41.89 and 1096 µm respectively, which were in close agreement with the theoretical values.
A
B
C
FIGURE 6: Y-HAT SURFACE PLOT SHOWING THE EFFECT OF THE INDEPENDENT FACTORS ON Y1 (a), Y2 (b) AND Y3 (c) OF ACETAZOLAMIDE
A
B
C
FIGURE 7: Y-HAT SURFACE PLOT SHOWING THE EFFECT OF THE INDEPENDENT FACTORS ON Y1 (a), Y2 (b) AND Y3 (c) OF ACETAZOLAMIDE
MICROSPHERES AT CONSTANT X1= 0.
CONCLUSION: Eudragit RS microspheres
containing acetazolamide can be prepared successfully by using an emulsion solvent evaporation technique. The surface structure of the microspheres was spherical and smooth. The prepared microspheres exhibited a good entrapment efficiency % and the release rate of Eudragit RS100 microspheres was slower. Box-Behnken experimental design, regression analysis, and contour plots were used in optimizing formulation variables in the preparation of acetazolamide microspheres. The optimized formulation prepared using the predicted levels of factors provided the desired observed responses with Y1, Y2 and Y3
values of 80.25%, 39.11% and 1043.05 µm for entrapment efficiency %, released percent and mean particle size, respectively.
REFERENCES:
1. Alagusundaram M, Chetty MS, Umashankari K, Badarinath AV, Lavanya C, Ramkanth S: Microspheres as a novel drug delivery system. International Journal ChemTech Research 2009; 1(3): 526-534.
2. Sudhamani T, Reddy KN, Kumar VRR, Revathi R, Ganesan V: Preparation and evaluation of ethyl cellulose microspheres of ibuprofen for sustained drug delivery. International Journal of Pharmaceutical Research and Development 2010; 2(8): 119-125.
3. Vyas SP, Khar RK: Targeted and controlled drug delivery- Novel carrier systems, 1st edition, CBS publishers & distributers, Delhi, 2000: 414-458.
4. Obeidat WM, Price JC: Preparations and evaluation of Eudragit S 100 microspheres as pH sensitive release preparation for piroxicam and theophylline using the emulsion solvent evaporation method. Journal of Microencapsulation 2006; 23:195-202.
5. Upendra P, Ragin S, Ghanshyam P, Dhiren daslaniya: Preparation and evaluation of lamivudine microspheres with Eudragit® polymers by solvent evaporation method. International Journal of Research and BioSciences 2013; 2(3): 89-106.
6. Kibbe AH. Handbook of Pharmaceutical excipients. 3rd edn. Washington, D.C., USA, American Pharmaceutical Association, 200; 401-406.
7. Chandra D, Yadav IK, Jaiswal D, Ghosh N, Singh HP, Mishra A, Bhattacharya A, Bajpai M, Jain D A: Formulation and evaluation of satranidazole microspheres for colon targeted drug delivery. Journal of Pharmaceutical Research 2009; 2(7):1230-1233.
8. Duarte AR, Roy C, Vega-Gonz´alez A, Duarte P, Paternau S: Preparation of acetazolamide composite microparticles by supercritical anti-solvent techniques. International Journal of Pharmaceutics. 2007; 332:132-139.
9. Box GEP, Behnken DW: Some new three level designs for the study of quantitative variables. Technometrics 1960; 2: 455-475
[image:11.612.51.298.37.689.2]solvent evaporation technique. Journal of Drug Delivery and Therapeutics 2013; 3(2): 125-130.
11. Abdallah MH, Sammour OA, El-Ghamry HA, El-Nahas HM, Barakat W: Development and characterization of controlled release ketoprofen microspheres. Journal of Applied Pharmaceutical Science 2012; 02(03); 60-67. 12. Dua K, Trivedi P: Formulation and evaluation of
mucoadhesive microspheres of ranitidine hydrochloride using chitosan and sodium carboxy methyl cellulose as polymers. International Journal of Pharmaceutical Biomedical Research 2013; 4(2): 140-144.
13. Philo MS, Badarinath AV, Gopinath C: Formulation and evaluation of octreotide acetate loaded PLGA microspheres. International Journal of Pharmacy and Pharmaceutical Science 2013; 5(3): 615-621.
14. Gangadhar CB, Sunder SR, Vimal KVM, Raju SM, and Kiran SM: Formulation and evaluation of indomethacin microspheres using natural and synthetic polymers as controlled release dosage forms. International Journal of Drug Discovery 2010; 2(1): 8-16.
15. Badhana S, Garud N, Garud A: Colon specific drug delivery of mesalamine using eudragit S100-coated chitosan microspheres for the treatment of ulcerative colitis. International Current of Pharmaceutical Journal 2013; 2(3): 42-48.
16. Apu AS, Pathan AH, Shrestha D, Kibria G, Jalil J: Investigation of in vitro release kinetics of carbamazepine from Eudragit® Rs PO and RL PO matrix tablets. Tropical Journal of Pharmaceutical Research 2009; 8 (2): 145-152. 17. Yerriswamy B, Reddy CLN, Prasad CV, Subha MCS, Rao
KC, reddy V: Controlled release studies of 5-fluorouracil through poly (vinyl caprolactum-co- vinyl acetate) microspheres. Asian Journal of Pharmaceutics 2010 4(3): 200-204.
18. Bhalekar M, Madgulkar A, Gunjal S, Bagal A: Formulation and optimisation of sustained release spray-dried microspheres of glipizide using natural
polysaccharide. PDA Journal of Pharmaceutical Science and Technology 2013; 67(2):146-154.
19. El-Nahas HM: Optimization of Eudragit RS microspheres for controlled release of theophylline using response surface methodology. Journal of Pharmaceutical Sciences and Research 2010; 2 (10): 663-671.
20. Shazly GA, Tawfeek HM, Ibrahim MA, Auda SH, El-Mahdy M: Formulation and evaluation of fast dissolving tablets containing taste-masked microspheres of diclofenac sodium for sustained release. Digest Journal of Nanomaterials and Biostructures 2013; 8(3): 1281-1293. 21. Abd El Rasoul S, Ahmed MM, Saleh KI: Emulsion solvent
evaporation method for preparing Eudragit RS100 microparticles loaded ketorolac tromethamine. Asian Journal of Pharmaceutical Health Science 2013; 3(1):627-639.
22. Dhakar R, Maurya SD, Saluja: Formulation variables to drug entrapment efficiency of microspheres: a technical review. Journal of Drug Delivery and Therapeutics 2012; 2(6): 128-133.
23. Ganesh S, Kumar DS, Kumar BS, Abhilash R, Bharadwaj PS, Raj KP, Pravalika IM: Controlled release formulation and evaluation of idarubicin microsphere using biodegradable hydrophilic and hydrophobic polymer mixtures. Asian Journal of Pharmaceutical Clinical Research 2010; 3(3): 179-182.
24. Maheshwari RK, Karawande VU: Application of novel concept of mixed solvency in the design and development of floating microsphers of furosemide. International Journal Pharmacy and Pharmaceutical Sciences 2013; 5(2):167-175.
25. Patel B, Modi V, Patel K, Patel M: Preparation and evaluation of ethyl cellulose microspheres prepared by emulsification - solvent evaporation method. International Journal for Research in Management and Pharmacy 2012; 1(1):82-91.
All © 2013 are reserved by International Journal of Pharmaceutical Sciences and Research. This Journal licensed under a Creative Commons Attribution-NonCommercial-ShareAlike 3.0 Unported License.
This article can be downloaded to ANDROID OS based mobile. Scan QR Code using Code/Bar Scanner from your mobile. (Scanners are available on Google Playstore)
How to cite this article:
Abdallah MH: Box-Behnken design for development and optimization of Acetazolamide Microspheres. Int J Pharm Sci Res