ISSN: 1992-8645 www.jatit.org E-ISSN: 1817-3195
MULTIMODAL BIOMETRIC AUTHENTICATION SYSTEM
USING LDR BASED ON SELECTIVE SMALL
RECONSTRUCTION ERROR
1SAVITHA G, 2DR. VIBHA L., 3DR. VENUGOPAL K. R.
1
B.N.M. Institute of Technology, Bangalore, Computer Science and Engineering 2
B.N.M. Institute of Technology, Bangalore, Computer Science and Engineering 3
University Visvesvaraya College of Engineering, Bangalore, Computer Science and Engineering
E-mail: [email protected], [email protected], [email protected]
ABSTRACT
In Biometrics, physiological or behavioral features are utilized to validate an individual's identity. Though, a substantial amount of research has carried out in this field, unimodal biometric frameworks regularly experience some limits because of non-universal biometrics attributes, vulnerability to biometric spoofing or lack of accurateness. In this paper, the accuracy problem is addressed through multimodal biometric fusion. Our proposed multimodal biometric fusion methodology offers face and fingerprint as biometric traits as an input for sanctuary purpose that are not unique to each other of the human body. Here, we include Wiener filter for preprocessing phase and Discrete Wavelet Transform (DWT) for the fusion process of the two traits. Also, a linear discriminant regression classification (LDRC) algorithm has been proposed. We propose selective small reconstruction error (SSRE) which helps to select the classes, wherein chances to misclassifies the classes are considered when calculating the between-class reconstruction error (BCRE). After maximizing the ratio of BCRE and within-class reconstruction error (WCRE) an optimum projection matrix is obtained through which a high discrimination value can be achieved for classification. Finally, the experimentations are carried out and our proposed LDRC methodology performance is found better than the existing LRC in terms of accuracy, FAR, FER, EER.
Keywords: Biometric Authentication, Between-Class Reconstruction Error, Discrete Wavelet Transform, Wiener Filter, Within-Class Reconstruction Error.
1. INTRODUCTION
Biometric identification has gained popularity because of the unreliability & inconvenience of conventional techniques, for example passwords, pin numbers, key cards, & smart cards. In recent years, biometric authentication has seen significant enhancement in dependability & precision. Some biometric systems offer good person identification performance [1], [6], [7], [8]. However, the most progressive biometric systems are facing several issues, due to the inheritance of the kind of data & others due to the methodology itself. Hence, it is often not possible to achieve a higher identification rate & attempting to improve the performance of single matchers in such situations may not prove to be beneficial due to inherent problems. Generally, biometric systems functioning on a single biometric feature have several boundaries like Distress with data sensors, Distinctiveness ability, Lack of universality [17].
In spite of a substantial research work, uni-modal biometric systems regularly suffer from different type of drawbacks because of non-universal biometric traits, susceptibility to inadequate accuracy because of noisy data [2]. Therefore, uni-modal biometric systems might not be capable of achieving the expected performance requirement in real-world usage. This accuracy issue has in recent times been addressed through multimodal biometric (multi-biometric) fusion, which integrates the information that is output, by individual biometric. Multimodal biometric fusion has been presented in many past research empirically to enhance the accuracy of biometrics based verification & identification [3], [4], [5]. Multimodal biometric systems are those that utilize over one physiological or behavioral feature for verification [20].
ISSN: 1992-8645 www.jatit.org E-ISSN: 1817-3195
multi source information [9], [10]. For instance, face recognition, fingerprint, & speech recognition sorts to different at a time. The level of fusion & integration strategies that can be adopted group of information. In addition, various levels of fusion are sensor level fusion, feature level fusion, matching score level, decision level fusion [11], [12]. Its evidence & fusion is utilized to improve the overall decision accuracy & performance. It mainly used for reducing the false acceptance ratio & false rejection ratio [12], [13], [14], [15].
2. LITERATURE REVIEW
In this section, we have made discussion on some of recent researches focused on multi-model biometric authentication systems.
A. Muthukumar et al. [15] presented the security of the biometric system, because compromised biometric templates cannot be revoked or reissued since they achieved security of biometric system through a multimodal system that is built on an evolutionary algorithm, Particle Swarm Optimization that adjusts for differing security condition. For these two things, they had established a design, including adaptability, authenticity & security.
G. A. Khuwaja [16] presented a multimodal biometric identification system by combining both physical (face) and behavioral (handwritten signature) traits for authentication purpose. They derived an adaptive learning vector quantization (LVQ) neural network architecture for automatic recognition of humans using novel features-level fusion approach. The learning time per fused image of the recognition system was constant regardless of the size of data.
V. Yano et al. [17] presented a multimodal biometric authentication technique that combined the use of dynamic characteristics of the human reflex & the iris pattern recognition for a better performance. A prototype framework was implemented and examined with 59 volunteers. The outcomes of the experiment presented an EER of 2.44%.
B. Ma et al. [18] proposed a watermarking-based two-stage authentication system to make sure the validity of biometric data. At the time of data collection, face characteristic were integrated into a fingerprint image of the
similar person due to the data integrity token & secondary authentication source. In the initial phase of authentication, the credibility of input data was established through examination the validity of extracted patterns. Because of the particular feature of face watermarks, the face detection based classification methods were presented for reliable watermark verification in place traditional correlation based watermark detection. If authentic, the face patterns can further assist as additional identity information to enable sub-sequential biometric authentication. Their proposed method’s one major problem was to assure the robustness & capacity of watermark during maintaining the discriminating characteristics of host fingerprints. So, a wavelet quantization based watermarking method was suggested to adaptively distributed watermark energy on significant DWT coefficients of fingerprint images.
H. Saevanee et al. [19] presented text-based multimodal biometric method by using linguistic analysis, keystroke dynamics & behavioral profiling. They concentrated on the utilization of three behavioral biometric methods: linguistic profiling, keystroke dynamics & behavior profiling to develop an authentication mechanism that can give a less costly, non-intrusive & uninterrupted solution to the problem of user authentication. The system was designed by utilizing a variety of single and multimodal biometric techniques without any additional hardware. The users can benefit from the framework with regards to both device security and convenience of use. The outcomes of the simulation clearly exhibited that the proposed authentication framework could give continuous and transparent authentication to protect mobile devices.
3. PROPOSED METHODOLOGY FOR CHANNEL ESTIMATION
ISSN: 1992-8645 www.jatit.org E-ISSN: 1817-3195
3.1 Wiener Filter
The goal of wiener filter is to remove the noise from signal or images based on a statistical approach and it is characterized by a conjecture that picture noise is stationary linear random processes and their spectral characteristics are calculated. The Functioning extent using Minimum Mean-Square Error.
The Wiener filter is implemented as represented in the following equation 1 and 2:
)
,
(
1
i
j
W
)
,
(
p
)
,
(
p
|
)
,
(
)
,
(
j)p
(i,
*
D
n s
2 s
j
i
j
i
j
i
D
j
i
+
=
(1))
,
(
2
i
j
W
)
,
(
p
)
,
(
p
|
)
,
(
)
,
(
j)p
(i,
*
D
n s
2 s
j
i
j
i
j
i
D
j
i
+
=
(2)Dividing through by
p
sgiven in the equation 3.)
,
(
i
j
W
)
,
(
)
,
(
p
p
|
)
,
(
j)
(i,
*
D
n s 2
j
i
p
j
i
j
i
D
s
+
=
(3)Where,
)
,
(
1
i
j
W
= wiener filter for noise removal in fingerprint image)
,
(
2
i
j
W
= wiener filter for noise removal in face imageD (i, j) = Degradation function on image
D*(i, j) = Complex conjugate of degradation function on image
)
,
(
p
ni
j
= Power Spectral Density of Noise on image)
,
(
p
si
j
= Power Spectral Density of un-degraded image.4. DISCRETE WAVELET TRANSFORM
To solve the fraudulent attack and to build the biometric efficient authentication system, each of the image accepting the fusion process which combines the two or more images into a single image. In order to make the fusion of images initially, every image is converted to wavelet representation to remap an image without any information loss based on Discrete Wavelet Transform (DWT) which makes the image become expedient for image fusion. Subsequently wavelet coefficients are fused based on the cultivated fusion rule of wavelet transform domain. The fused images are constructed based on inverse DWT.
5. PRINCIPLE COMPONENT ANALYSIS
Here, Principle Component Analysis (PCA) based feature extraction is utilized to extract the global features from multimodal images. Moreover, PCA is utilized to decrease the dimensionality of an image. Initially the 2D images are converted into 1D images and indicated as
j
i
×
1
by merging the pixels in the original image. Then, subtract the row wise mean from each dimension and place the result in matrix R. Construct thej
×
j
covariance matrix for building the matrix become square, which is used for calculation of Eigen vectors and Eigen values. Construction of a covariance matrixj
×
j
by equation 4.R
R
'×
(4)
Find the eigenvalues and eigenvectors of the images by solving equation 5,
(
R
−
λ
)
V
=
0
(5)Where,
λ
is an Eigen value andV
is an eigenvector. The components, which are very less significant, are ignored in order to reduce the dimensionality. Thus, selecting the firstv
Eigen vectors(
v
<
j
)
. By considering the selectedv
Eigen vectors feature vectors are designed and construct the matrix with Eigen vectors as columns represents in equation 6.
(
eig
eig
eig
j)
ISSN: 1992-8645 www.jatit.org E-ISSN: 1817-3195
The transpose of the vector is taken after the feature vector
F
is constructed and multiply the transpose of the vector with the original data set which gives the original data set in terms of vectors.6. PROPOSED LINEAR DISCRIMINANT REGRESSION CLASSIFICATION
The linear regression classification (LRC) algorithm can be improved by using a linear discriminant regression classification (LDRC) algorithm through integrating fisher criterion into LRC that leads to maximize the ratio of the between-class reconstruction error (BCRE) over the within-class reconstruction error (WCRE). Through applying discriminant analysis, we want to discriminate patterns of different classes by choosing the projection directions on which the patterns of different classes are far from each other while keeping the patterns of the same classes be as close to each other as possible. Therefore, the proposed LDRC could estimate an optimal projection in such a way that the ratio of the between-class reconstruction error over the within-class reconstruction error achieved by the LRC is maximized. An optimal projection matrix is found to project the original image to a more discriminating low-dimensional space. In the new low-dimensional space, LDRC can achieve better recognition performance.
Generally, classification error happens when the true class and false class have similar small reconstruction errors. So, if only the classes with small reconstruction errors are considered when evaluating BCRE, the reconstruction error difference between the true class and false class will be increased. This helps to correctly classify the probe image. In LDRC, when calculating the BCRE value, all other classes are considered except the class from which the probe image comes from. In our proposed methodology, we propose a method based on Selective Small Reconstruction Error (SSRE) that takes the classes with a small reconstruction error rather than use all those classes for calculating the BCRE. The reason is that when classifying the probe image, we only care about the classes with small reconstruction error. Those classes with large reconstruction error are easily excluded out. After the estimation of channel
matrixH^(n), MMA is introduced to optimize
estimation error
(
e
MMA)
. SMMA, an algorithm foruse to digital transmission has been proposed. In SMMA, cost function integrates dispersion constant & slicer output. Several desirable features, comprising of multiple-modulus, symmetry, & (almost) uniformity fulfils by SMMA cost function. The SMMA cost function shows a much lower misadjustment compared to other algorithms, for example, CMA & MMA.
6.1 Linear Regression Classification (LRC)
Consider
S
subjects withg
itrainingimages from the
i
thclass where1
≤
i
≤
S
. Through the projection of the image space into the multimodal space, the matrixF
contains featurevectors from
S
subjectsand
F
=
[
F
1,...,
F
i...,
F
S]
. In order to apply regression analysis to estimate class specific model and grouping the column vectorsf
i,j regarding theclass-membership
i
th class represents as equation 7,i i
g L g i j i i
i
f
f
f
F
=
[
,1,...,
,...,
,]
∈
ℜ
* (7)Where the vector
f
i,j is a column vectorin size of L*1. Thus, in the training stage, the th
i
class is represented by a vector spaceF
i, represents the predictor for each subject.If
d
belongs to thei
th class, which represented as a linear combination of the training pictures from thei
th class and it defined as equation 8.,
e
F
y
=
iβ
i+
i=1,2,…,S, (8)Where
β
i∈
ℜ
gi*l is the vector ofregression parameters and
e
is an error vector that is an i.i.d. random variable with zero mean and varianceσ
2. Major aim of the linear regression isto obtain ∧
i
ISSN: 1992-8645 www.jatit.org E-ISSN: 1817-3195
,
||
||
min
arg
F
i id
22i
i
−
=
∧
β
β
β
i=1,2,…,S. (9)
The estimate of the regression parameter vectors can be computed through equation 10
.
)
(
F
iTF
i 1F
iTd
i
− ∧
=
β
(10)The estimated parameters ∧
i
β
andpredictors
F
i, used to predict the response vector∧
i
d
for thei
thclass as equation 11,
∧ ∧
=
i ii
F
d
β
i=1,2,…,S. (11)By substituting (10) into (11), by using following equation 12
,
)
(
F
F
1F
d
F
d
i i iT i − iT∧
=
i=1,2,…,S. (12)Therefore, class specific projection expressed in equation 13
,
d
H
d
i=
i∧
i=1,2,…,S. (13)
Where ∧
i
d
is the projection of d onto thesubspace of the
i
th class by the class projection matrix,H
iF
iF
iTF
i 1F
iT)
(
−=
. Here theprojection matrix
(
H
i)
is a symmetric matrix and also idempotent.The linear regression actually based on the minimum distance between the original vector and
the projected vector. The predicted vector ∧
i
d
will be the closest vector to the original vector. The Euclidean distance measure between the predicted response vectors and the original vector by using*
i
given in equation 14.||,
||
min
arg
*
d
d
i
ii
−
=
∧
i=1,2,…,S. (14)
6.2 Linear Discriminant Regression Classification
Arithmetically, a set of M training images is given and each gray scale training pictures is in size of a*b and is represented as
v
m a*bℜ
∈
m =1,2, …,M. Each image is transformed to a column vector,
x
m∈
ℜ
L*1, whereL
=
a
*
b
. By load upall
x
m, the collected data is given as X =[
x
1,...,
x
m,...,
x
M]
∈
ℜ
L*M and thecorresponding class label of
x
m is denoted as})
,...,
2
,
1
{
(
x
c
l
m∈
, where c is the total number of classes.6.2.1 Linear Discriminant Regression Analysis
The proposed LDRC method formulation helps to find the optimization problem to maximize the objective function given as in the equation 15.
),
(
max
)
(
max
WC BC U
U
E
E
U
J
=
(15)Where, U is the optimal projection matrix and
E
BC,E
WC denote between-class and within-class reconstruction errors from LRC, respectively. Hence, the proposed method aims at finding an optimal mappingU
=
[
u
1,...,
u
n,...,
u
q]
from theoriginal space
x
m to the subspacem T
m
U
x
y
=
that is effective for linear regression classification. The samples from specific object classes known to recline on a linear subspace is used to improve the LDRC algorithm that noted by usingl
(
x
m)
=
l
(
y
m)
. so the feature vectors are used to estimate the class-specific projection matrixH
iji for each class i. The objective functionexpressed in equation 16.
WC BC
E
E
U
ISSN: 1992-8645 www.jatit.org E-ISSN: 1817-3195 2 int 1 2 int ) ( , 1 1
||
||
1
||
||
)
1
(
1
ra i i M i er ij i c x l j j M id
d
M
d
d
c
M
i ∧ = ∧ ≠ = =−
∑
−
∑
∑
−
=
∧ (16) Where, i d j erij H d
d∧ =
int
denotes the
inter-class projection of
d
iby the LRC in (13) with thepatterns from the different th
j class, (i.e., j≠l(di)
and
i d i ra ij H d
d =
∧int denotes the intra-class
projection of
d
iby the LRC in (13) with theremaining patterns in the same class (i.e., i=l(di)
represents in 17,
2 1 2 ) ( , 1 1
||
||
1
||
||
)
1
(
1
)
(
i
y
i
d
M
i
d
j
d
c
M
U
J
d
H
d
H
i M i i c x l j j M i i−
∑
−
∑
∑
−
=
= ≠ = = ∧ 2 1 2 ) ( , 1 1 || || 1 || || ) 1 ( 1 i T i T M i i T i T c x l j j M i x U d j x U M x U d j x U c MH
H
i − ∑ − ∑ ∑ − = = ≠ = = ∧ (17)With some algebraic deduction, equation 17 can be rewritten as 18.
] ) )( ( [ 1 ] ) )( ( [ ) 1 ( 1 ) ( int int 1 int int ) ( , 1 1 U x x x x U tr M U x x x x U tr c M U J T er ij i er ij i T M i T er ij i er ij i T c x l j j M i i − − ∑ − − ∑ ∑ − = = ≠ = = ∧
)
(
)
(
U
E
U
tr
U
E
U
tr
w T b T=
(18)Where, value of
E
b andE
wis given by equation 19 and 20 respectively.b
E i ij er i ij er T
c x l j j M i
x
x
x
x
c
M
i)
)(
(
)
1
(
1
int int) ( , 1 1
−
−
∑
∑
−
=
∧ ≠ = = (19) wE
er Tij i er ij i M
i
x
x
x
x
M
(
)(
)
1
int int1
−
−
∑
=
=
(20)
denote inter-class and intra-class reconstruction error matrices achieved by the LRC, respectively. Finally, the objective function depicted in (15) can be expressed in equation 21.
U
E
U
U
E
U
U
J
w T b T UU
(
)
arg
max
max
=
. (21)In addition, LRC is usually much smaller than the dimensionality of the sample space that number of samples per class for computing the intra-class reconstruction error. As a result to address this problem is called “small sample size” (SSS) problem, so the term
ε
I
is added without affecting the subspace. The objective function stated in (21) then becomes equation 22.,
)
(
max
arg
)
(
max
arg
U
I
E
U
U
E
U
U
J
w T b T UU
+
ε
=
(22)Where,
ε
is a small positive number and I is an identity matrix of proper size. Equation (22) can be solved by maximizing the numerator while keeping the denominator constant, so (22) can be reformulated as the following constrained optimization problem represented in 23,U
max
arg
U
E
bU
T
s.t
U
E
wI
U
k
T
=
+
)
(
ε
(23)where k is a constant. Equation (23) can be accomplished by using Lagrange multipliers. Therefore, the transformation matrix
]
,...,
,...,
[
u
1u
nu
qU
=
are maximizes the objective function that obtained by solving the generalized eigenvalue problem as given in 26.
,
)
(
w k kk
b
u
E
I
u
E
=
λ
+
ε
k=1,2,….,q, (26)ISSN: 1992-8645 www.jatit.org E-ISSN: 1817-3195
,
)
(
w k kk
b
u
E
I
u
E
=
λ
+
ε
is eigenvalue of the proposed LDRC, which is used to evaluate the effectiveness of the multimodal image. After classification, measures rate of FAR and FRR for calculates the total performance. By using training image is greater than testing image, which help to improve the accuracy and performance.7. EXPERIMENTAL SET UP
In this section, we evaluate our proposed LDRC multi-model methodology by using Unimodel methodology. Thus, in this research we have considered standard benchmark ORL face dataset and CASIA fingerprint dataset. Here we have taken 40 persons considered and for each person 10 images of face and fingerprint are taken for implementation. We evaluate our proposed methodology in terms of FAR, FRR and accuracy. The ORL face dataset has distinct face images of a person differentiated by various factors such as lightening, pose and expressions. The CASIA fingerprint dataset has distinct images of a person differentiated by different angles of left and right hand images.
7.1 Factors for Comparative Analysis
The brief notes for the factors used in comparative analysis is discussed in this section.
7.1.1 False Acceptance Rate (FAR)
It is used to measure of a biometric security system that will wrongly grant an access effort made by an unauthorized user.
database
of
out
persons
of
number
Total
images
Accepted
Falsely
of
Number
FAR
=
7.1.2 False Rejection Rate (FRR)
It is used to measure of biometric security system that will wrongly reject an access effort made by an authorized user.
images
rejected
Falsely
of
Number
databese
in the
persons
of
number
Total
FRR
=
Using this formulas, to calculates FAR, FRR for increasing successive rate of verification and identification.
7.1.3 Equal Error Rate (EER)
The rate at which both acceptance and rejection errors are equivalent. The value of the EER can be effortlessly gained from the ROC curve. Generally, the device with the least EER is the most accurate.
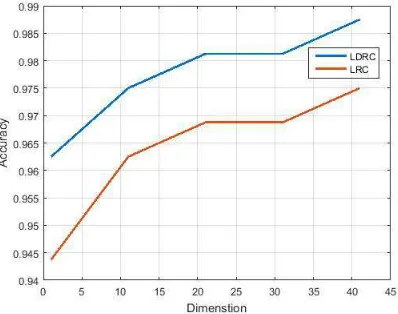
7.2 Comparative Analysis of Accuracy
[image:7.612.315.514.470.627.2]In this section, we evaluate our proposed LDRC methodology by comparing with LRC in terms of accuracy. We obtain values of accuracy for LRC and LDRC for various values of dimensions. The following figure 1 indicates the comparative analysis of accuracy for fusion images. The figure 2 represents the accuracy of the LRC and LDRC for face images and the figure 3 depicts that evaluation of accuracy of the fingerprint images. By analyzing the figures 1, 2, 3, it can be said that our proposed LDRC methodology achieves better results than the LRC methodology. The reason behind this is our proposed SSRE concept is incorporated with LDRC, which only considers the classes with small reconstruction error when calculating BCRE, the reconstruction error difference between the true class and false class will be increased which leads to increase the accuracy of classification.
ISSN: 1992-8645 www.jatit.org E-ISSN: 1817-3195
Figure 2: Face image 60
Figure 3: Finger image 60
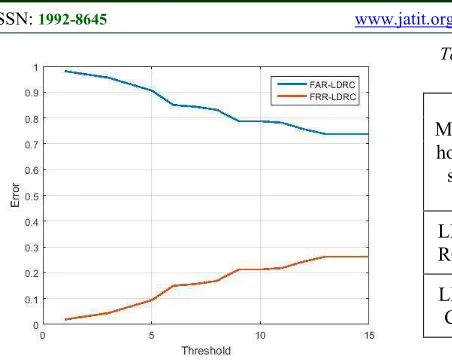
7.3 Comparative Analysis of FRR and FAR
In this section, we evaluate our proposed LDRC methodology by comparing with LRC in terms of FRR, FAR and EER based on varying the threshold values. The following figure 4 indicates the comparative analysis of error factors for fusion images. The figure 5 represents the error factors of the LRC and LDRC for face images and the figure 6 depicts that evaluation of error factors for the fingerprint images. When the threshold value becomes same for more than one class, the threshold value of selected class will be decreased to differentiate the threshold values for proper classification. If the threshold value is less FAR value will be increased and if the threshold value is high, then the FRR value will be increased which is stated in the following figure 4 and 5. The selection of proper threshold determined by the EER and it leads to attain the better classification accuracy. Selection of the EER is determined by the values of FAR and FRR, which is, represented in the figure 4
[image:8.612.91.300.79.446.2]and 5 for fusion images and face images respectively. For the fingerprint images, the selection of the EER is not found because of the dimensions of fingerprint images are improper stated in figure 6, moreover, this is the main reason for leading us to make the proposed fusion methodology.
[image:8.612.320.516.191.353.2]Figure 4: Selection of EER for fusion images
[image:8.612.318.510.393.552.2]ISSN: 1992-8645 www.jatit.org E-ISSN: 1817-3195
Figure 6: Selection of EER for fingerprint images
7.4 Comparative Analysis for Various Training Data
The table 1 describes the accuracy of proposed LDRC and LRC for various training data. By analyzing the table 1, our proposed LDRC methodology performed better than the existing LRC method in terms of accuracy for multi-model images and Unimodel images.
Table 1: Represents the accuracy of LDRC and LRC for various training data
Accuracy
Met hod s
Multi Model Unimodel
Fusion Face Fingerprint 60 Tr ai n 40 Tr ai n 20 Tr ai n 60 Tr ai n 40 Tr ai n 20 Tr ai n 60 Tr ai n 40 Tr ai n 20 Tr ai n LD RC 98 .8 5 94 .1 6 85 .1 4 98 .8 8 93 .8 1 84 .4 4 26 .3 0.1 99 0.1 53 7 LR C 97 .5 0 90 .4 1 75 .7 1 97 .5 7 92 .0 5 82 .9 0 26 .9 0.1 67 5 0.1 38 7
[image:9.612.96.322.72.253.2]The table 3 represents the values of FAR, FER, EER of proposed LDRC and LRC for various training data. Our proposed LDRC methodology performed better than the existing LRC method in terms of FAR, FRR and EER for multi-model images and Unimodel images.
Table 2: depicts values of FAR, FER, EER of LDRC and LRC for various training data
Met hod s
Multi Model Unimodel
Fusion Face Fingerprint
F A R F R R E E R F A R F R R E E R F A R F R R E E R LD RC 0.1 55 8 0.8 44 1 1.7 09 7 0. 14 8 0. 85 2 1.6 80 5 0. 83 0 0. 17 0 0 LR C 0.1 99 5 0.8 00 1.9 30 2 0. 20 0 0. 79 9 1.8 90 1 0. 86 0 0. 13 8 0 8. CONCLUSION
We have introduced EKF-SMMA for the blind equalization of OFDM signals that lessens a cost function which is composed of equalized and sliced symbols. Steady-state mis-adjustment analysis was done to compare existing and proposed technique. The outcomes of the analysis and simulations show the benefit of using the proposed BER over the traditional multi-modulus BER associated with the conventional SMMA, MMA & CMA. The experiment based on simulation showed that the EKF-SMMA shows a superior efficiency in contrast with the MMA, yielding a better BER, without compromising the convergence rate.
REFRENCES:
[1] A. K. Jain, A. Ross, and S. Prabhakar, “An introduction to biometric recognition”, IEEE Transactions on Circuits and Systems for Video
Technology, Vol. 14, No. 1, 2004, pp. 4-20.
[2] A. K. Jain, and A. Ross, “Multibiometric systems”, Communications of the ACM, Vol. 47, No. 1, 2004, pp. 34-40.
[3] R. Raghavendra, B. Dorizzi, A. Rao, and G. H. Kumar, “Designing efficient fusion schemes for multimodal biometric systems using face and palmprint”, Pattern Recognition, Vol. 44, No. 5, 2011, pp. 1076-1088.
[4] N. Poh, and J. Kittler, “A unified framework for biometric expert fusion incorporating quality measures”, IEEE Transactions on Pattern
Analysis and Machine Intelligence, Vol. 34, No.
1, 2012, pp. 3-18.
ISSN: 1992-8645 www.jatit.org E-ISSN: 1817-3195
International Conference on Biometrics (ICB),
2012, pp. 390-395.
[6] U. Uludag, S. Pankanti, S. Prabhakar, and A. K. Jain, “Biometric cryptosystems: issues and challenges”, Proceedings of the IEEE, Vol. 92, No. 6, 2004, pp. 948-960.
[7] W. J. Scheirer, and T. E. Boult, “Bio-cryptographic protocols with bipartite biotokens”, Proceedings of Biometrics
Symposium, 2008, pp. 9-16.
[8] A. Mishra, “Multimodal biometrics it is: need for future systems”, International journal of
computer applications, Vol. 3, No. 4, 2010, pp.
28-33.
[9] A. Ross, and A. K. Jain, “Multimodal biometrics: An overview”, Proceedings of 12th
European In Signal Processing Conference,
2004, pp. 1221-1224.
[10] S. Sheena, and S. Mathu, “A Study of Multimodal Biometric System”, IJRET:
International Journal of Research in
Engineering and Technology, Vol. 3, No. 14,
2014, pp. 93-97.
[11] K. Sasidhar, V. L. Kakulapati, K. Ramakrishna, and K. KailasaRao, “Multimodal biometric systems-Study to improve accuracy and performance”, International Journal of Computer Science & Engineering Survey
(IJCSES), Vol. 1, No. 2, 2010.
[12] M. Soltane, and M. Bakhti, “Multi-modal biometric authentications: concept issues and applications strategies”, International Journal
of Advanced Science and Technology, Vol. 48,
2012.
[13] M. Pathak, and N. Srinivasu, “Analysis of Multimodal Biometric System Based on Level of Fusion”, International Journal of Inventive
Engineering and Sciences (IJIES), Vol. 3, No.
8, 2015.
[14] Y. Li, M. Shi, E. Zhu, J. Yin, and J. Zhao, “A Multimodal Fusion Algorithm Based on FRR and FAR Using SVM”, International Journal of
Security and Its Applications, Vol. 7, No. 3,
2013, pp. 65-74.
[15] A. Muthukumar, C. Kasthuri, and S. Kannan, “Multimodal Biometric Authentication using Particle Swarm Optimization Algorithm with Fingerprint And Iris”, ICTACT Journal on
Image and Video Processing, Vol. 2, No. 3,
2012.
[16] G. A. Khuwaja, “Features-Level Fusion of Face and Handwritten Signature in Multimodal
Biometric Identification System”, Cybernetics
and Systems, Vol. 44, No. 5, 2013, pp. 422-443.
[17] V. Yano, A. Zimmer, and L. L. Ling, “Multimodal biometric authentication based on iris pattern and pupil light reflex”, Proceedings of 21st International Conference on In Pattern
Recognition (ICPR), 2012, pp. 2857-2860.
[18] B. Ma, Y. Wang, C. Li, Z. Zhang, and D. Huang, “Secure multimodal biometric authentication with wavelet quantization based fingerprint watermarking”, Multimedia tools
and applications, vol. 72, No. 1, 2014, pp.
637-666.
[19] H. Saevanee, N. Clarke, S. Furnell, and V. Biscione, “Continuous user authentication using multi-modal biometrics,” Computers &
Security, Vol. 53, 2015, pp. 234-246.
[20] F. Wang, Q. Zheng, and W. Meng, “Efficient multimodal fusion for person authentication combining three biometric modalities”,
Proceedings of International Conference on
Computer Science and Service System, 2014.