Journal of Chemical and Pharmaceutical
Development and Validation of HPTLC
Phosphate in
B. A. Patel*
1, S. J. P
1
P.G. Department of Pharmaceutical Science, Sardar Patel University
2SICART, Vallabh Vidyanagar, Gujarat, India.
3A. R. College of Pharmacy
_____________________________________________________________________________________________
ABSTRACT
A simple, accurate, and precise HPTLC method has been developed and validated for the estimation of Carvedilol Phosphate (CP) from bulk drug and tablet formulations.
silica gel 60 GF 254 as the stationary phase. The solvent s
v/v/v). This system was found to give
integration was performed at a wavelength of 243nm. concentration range of 100ng/spot to 200ng/spot relationship with r2 = 0.990. The method was validated
method was successfully applied for determination of drug in tablets, wherein no interference from tablets excipients was observed, indicating the specificity of the developed method. Thus, the proposed method can be used successfully for routine analysis of Carvedilol
Key Word: Validation, HPTLC, Carvedilol
_____________________________________________________________________________________________
Carvedilol-Phosphate,Figure.1,(2RS)
ol, is a non cardioselective beta-adrenoceptor antago its blocking activity at alpha1 receptor
prescribed as an antihypertensive agent and an angina agent and for treatment of congestive heart
Several analytical techniques are availab
Journal of Chemical and Pharmaceutical Research, 2012, 4(
Research Article
CODEN(USA) : JCPRC5
ISSN : 0975
alidation of HPTLC Method for Estimation of Carvedilol
Phosphate in Bulk and Pharmaceutical Dosage Form
, S. J. Parmar
1, G. R. Chauhan
2and A. D. C
P.G. Department of Pharmaceutical Science, Sardar Patel University, Guja
SICART, Vallabh Vidyanagar, Gujarat, India.
. College of Pharmacy, Vallabh Vidyanagar, Gujarat, India.
_____________________________________________________________________________________________
precise HPTLC method has been developed and validated for the estimation of Carvedilol from bulk drug and tablet formulations. The method employed TLC aluminum
as the stationary phase. The solvent system comprised n-hexane: ethyl acetate: methanol (3:5:2 give good result for Carvedilol (Rf value: 0.36cm). Spectrodensitometric scanning integration was performed at a wavelength of 243nm.The calibration curve was found t
concentration range of 100ng/spot to 200ng/spot. The regression data for calibration curve shows good linear method was validated in accordance with the requirements of ICH
method was successfully applied for determination of drug in tablets, wherein no interference from tablets excipients was observed, indicating the specificity of the developed method. Thus, the proposed method can be used
lysis of Carvedilol Phosphate from bulk and formulation.
on, HPTLC, Carvedilol Phosphate
_____________________________________________________________________________________________
INTRODUCTION
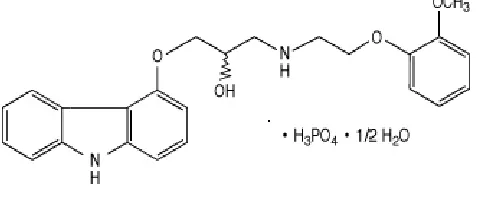
(2RS)-1-(9H-Carbazol-4-yloxy)-3-[[2-(2-methoxyphenoxy)ethyl]
adrenoceptor antagonist and arteriolar vasodilating properties, attributed mainly to its blocking activity at alpha1 receptor [1]. Carvedilol is official drug in British Pharmacopoeia
[image:1.595.180.419.600.701.2]prescribed as an antihypertensive agent and an angina agent and for treatment of congestive heart
Fig. 1 Carvedilol phosphate
Several analytical techniques are available for estimation of Carvedilol in bulk dosage form by HPLC
Research, 2012, 4(10):4570-4574
ISSN : 0975-7384
CODEN(USA) : JCPRC5
stimation of Carvedilol
ulk and Pharmaceutical Dosage Form
Captain
3Gujarat, India.
, Vallabh Vidyanagar, Gujarat, India.
_____________________________________________________________________________________________
precise HPTLC method has been developed and validated for the estimation of Carvedilol aluminum plates precoated with hexane: ethyl acetate: methanol (3:5:2 Spectrodensitometric
scanning-found to be linear within the The regression data for calibration curve shows good linear in accordance with the requirements of ICH guidelines. The method was successfully applied for determination of drug in tablets, wherein no interference from tablets excipients was observed, indicating the specificity of the developed method. Thus, the proposed method can be used
_____________________________________________________________________________________________
methoxyphenoxy)ethyl] amino]propan-2-and arteriolar vasodilating properties, attributed mainly to
Pharmacopoeia[2]. It has been prescribed as an antihypertensive agent and an angina agent and for treatment of congestive heart failure[3].
aspects of the analysis, accuracy, precision, recovery, and the limits of detection and quantification etc. have been measured as per ICH Guidelines [16].
EXPERIMENTAL SECTION
Chemicals and Reagents
The working standard of Carvedilol was procured from Torrent Reaserch Center, Ahmedabad, India. HPLC grade n-hexane, acetonitrile and methanol were purchased from Merck (Darmstadt, Germany). Deionized and ultra-pure water used in all experiments was obtained from Milli-Q System (Millipore). Glacial acetic acid of AR (Analytical Reagent) grade was procured form S. D. Fine Chemicals (India).
Equipment
The HPTLC system employed in the method development and validation was Camag Linomat V applicator (Muttenz, Switzerland), a Camag twin trough chamber of appropriate size, Camag TLC scanner III, Wincats (version 1.2.2) software as data integrator and a Hamilton syringe (Switzerland) of 100µl capacity.
HPTLC was performed on 10 cm ×10 cm precoated silica gel GF 254 pre-coated HPTLC plates from E. Merck
(Darmstadt, Germany).
METHOD
Preparation of standard solution
A stock solution of Carvedilol Phosphate (CP) (1mg/ml) was prepared in methanol. A standard solution was prepared by dilution of the stock solution with methanol to give solution in of 100µg/ml. Further dilutions were made with methanol to give a solution in concentration range of 100-200ng/ml.
A methanolic solution of carvedilol phosphate (1 mg/ml) was prepared. This solution was further diluted with methanol to yield a solution containing 100 µg/ml. Different concentrations of CP in a concentration range of 100-200ng/ml were applied on plates as 3 mm bands, 3 mm apart and 1 cm from edge of the plate, by means of Camag Linomat V automatic sample applicator fitted with 100 µl Hamilton syringe. The mobile phase, n-hexane: ethyl acetate: methanol (3:5:2 %v/v) was poured into the Camag twin trough glass chamber and the mobile phase was left to equilibrate in the chamber for 20 min at room temperature. The plate was then put in the chamber containing the mobile phase and developed to a distance 75 mm. After development, the plate was removed from the chamber, dried in current of hot air, and scanned at 243 nm, using a deuterium lamp, by means of Camag TLC scanner III densitometer. Densitograms were obtained by HPTLC of CP at various concentrations. This method was followed for all quantitative analysis. The Wincats software (version 1.2.2) was used for data acquisition and processing of the plate. The scanning speed was 20 mm/s, the offset was 10%, and the sensitivity (SPAN) was optimized to 20 min. Peak height and peak area were integrated for the entire track. The calibration curve was established by plotting the obtained peak area on ordinate against corresponding concentration on abscissa. The reproducibility of this method was ascertained by repeating the experiment five times.
Validation
The method was validated for specificity, accuracy, and precision by use of calibration standards of CP. Limit of detection and limit of quantitation were determined by the visual method by spotting different concentration of CP. The lowest concentration that could be detected for three replicate spots was regarded as the limit of detection. The lowest concentration for which the RSD [%] of five replicate spots less than 5 % was regarded as the limit of quantitation. LOD was calculated using formula LOD = 3.3 × ó/S, where ó is the residual standard deviation of regression line and S is the slope of corresponding line. Accuracy was determined by measurement of the recovery of CP standard added at three different levels, each being analyzed as described for the assay. Intraday and interday precisions were determined by applying 140ng/spot standard CP solution. After the development and densitometric scanning of the plates the peak-area response was measured and precision was calculated as RSD (%). The method was validated as per ICH guidelines.
Application of the validated method
RESULTS AND DISCUSSION
While choosing a solvent for HPTLC, the chemical nature and polarity of the drug molecule must take into account. Carvedilol Phosphate is practically insoluble in water and in the pH range of 3-9, freely soluble in methanol, soluble in strong base. Methanol: ethyl acetate (1:1) was used as the solvent system initially, but it was observed that the spot moved along with the solvent front and thus was not retained on the plate. When n-hexane was added, the Rf decreased but tailing was observed. Finally, the solvent system comprising n-hexane: ethyl acetate: methanol (4:5:1 v/v/v) gave good separation and there was no interference around the drug Rf value but it was less than 0.2cm. Thus, after many experiments, the system was developed which consisted of n-hexane: ethyl acetate: methanol (3:5:2 v/v/v). The optimized system gave a good separation and resolution of Carvedilol Phosphate.
The plate material employed was silica gel 60 GF 254 and scanning of CP on HPTLC plate at UV max at 243 nm.
Hence, quantification was carried out at 243 nm using Camag TLC scanner III.
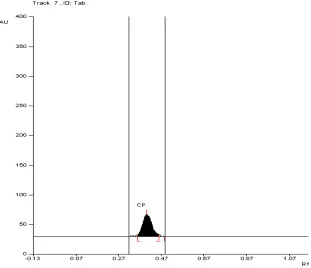
The optimized solvent system yielded a symmetrical peak for the drug with Rf 0.36. A typical chromatogram of CP was shown in Figure 2.
Figure.2 A Typical Chromatogram of Carvedilol phosphate
The developed method was then validated and successfully applied for quantification of CP from the formulation. To ensure accuracy of the method, recovery studies were performed by standard addition method at three different levels I, II and III (80%, 100%, and 120%), to the panalyzed samples and the subsequent solutions were re-analyzed. At each level, three determinations were performed and the results obtained are shown in Table 1.
TABLE: 1 ASSAY AND RECOVERY STUDY DATA FOR CP
Level Labeled amount ( mg per tablet)
Amount obtained
(mg per tablet)
Average assay recovery (%)
Assay % (RSD)
Level I 10 10.4 100.8 0.58
Level II 10 9.9 100.4 0.34
Level III 10 10.2 101.5 0.72
TABLE: 2 PRECISION DATA FOR CP
Intra day (140ng/spot)
Inter Day (140ng/spot) 1699.54 1699.54 1689.18 1658.9
The results of recovery studies were within the specified limits of ICH guidelines. Lower values of %RSD reflect the accuracy of the method. Precision, expressed in terms of %RSD was determined in terms of intra-day and inter-day precisions, analyzing the drug at three different concentrations, determining each concentration thrice summarized in Table 2.
[image:4.595.215.400.201.291.2]The sample solutions were analyzed using the method for three consecutive days, repeating the process twice a day at different periods. The results of regression analysis obtained are summarized in Table 3 which reflect high degree of precision. Two different analysts performed assay on marketed tablets of the drug, in similar operational and environmental conditions, using the developed method to determine its ruggedness.
TABLE: 3 REGRESSION ANALYSIS DATA FOR CP
Regression analysis data
Linearity range (ng/spot) Slope
100 to 200 ng/spot 15.09
Intercept -375.3
Standard deviation of slope 15.04 Standard deviation of intercept -368.9 Regression (R2) 0.99
Correlation coefficient 1.2
The Chromatogram of the marketed formulation was shown in Figure 3 and that was identified by comparing the RF and also comparing its absorbance spectrum with that obtained with the standard drug
Figure 3: Typical HPTLC Chromatogram of Carvedilol phosphate in Tablet dosage form
[image:4.595.149.460.337.605.2]Figure 4: Purity Comparison Spectra of Bulk drug and Marketed formulation
CONCLUSION
The developed and validated HPTLC method reported here is rapid, simple, accurate, sensitive, and specific. The method was also successfully used for quantitative estimation and analysis of Carvedilol Phosphate from formulation. Thus, the reported method is of considerable importance and has great industrial applicability for quality control and analysis of carvedilol phosphate from bulk drug and formulations.
Acknowledgment
I hardly thankful to TRC – Torrent Research Center [Gujarat, India] for providing the drug sample. I also thankful to SICART –Sophisticated Instrumentation Center for Applied Research and Testing who had helped me throughout the entire work.
REFERENCES
[1]Martindale; The complete drug reference; edited by Sean Sweetman, Thirty fifth edition,1114. [2]British Pharmacopoeia Vol. 1, The stationary office London,2010,387
[3]AI Paul, AG Gilman, TW Rall, AS Nies, P TayloR, Goodman and Gilman's, The Pharmacological Basis of Therapeutics, 8th Edn., McGraw Hill, New York, 1996, 239.
[4]R Rathod , PP Cloths , M Navsarkar , S Rani, H Padh, Journal of pharmaceutical and Biomedical Analysis,
2003, 31(3),407-412.
[5]L Cloths and KM McErlane, Journal of pharmaceutical and Biomedical Analysis, 2001, 24(4), 545-554. [6]L Cloths and KM McErlane, Journal of pharmaceutical and Biomedical Analysis, 2004, 36(3), 609-615. [7]E Yang, S Wang, J Kraatz, M Cyronak, Journal of Chromatogrpahy Science, 2004, 36, 609-615. [8]G Lamprecht, K Stoschitzky, Chromatographia, 2004, 59, 551-554.
[9]F Behn, S Laer , H Scholz, Journal of Chromatography Science, 2001,39, 121. [10]Behn, F, Laer S, Scholz H, Journal of Chromatography Science, 2001, 53,641-644. [11]JK Verma, HA Syed, Indian Journal of Pharmaceutical Science, 2007, 69 (2), 303-304.
[12]LJ Patel, BN Suhagia, PB Shah, RR Shah, Indian Journal of Pharmaceutical Science, 2006, 68(3),170-193. [13]PS Jain, GS Talele, SG Talel, SJ Surana, Indian Journal of Pharmaceutical Science, 2005 67(3),358-359. [14]B.S. Venkateswarlu1, R.Margret Chandira, Talele Ajay, Debjit Bhowmik, Chiranjib,B. Jayakar , K. P. Sampath Kumar, J. Chem. Pharm. Res., 2010, 2(1): 196-210.
[15]I. Sarath Chandiran, K. N. Jayaveera, Raghunadha Reddy, J. Chem. Pharm. Res., 2011, 3(2):341-353.