Abstract— There is evidence from the literature that suggests erythrocyte rouleaux, seen to form under favourable conditions (such as reduced blood flow) in vitro, may also occur in vivo, leading to a possibility of rouleaux influencing the transmission of light through tissue. This pilot study investigates the transmission of light through occluded tissues of human subjects, horses and sheep with a view to greater understanding of rouleaux formation in vivo, and its effect on light transmission through tissue.
The paper supports the evidence that occlusion may cause rouleaux formation in vivo, but the association between rouleaux formation and light transmission changes during occlusion is complex, and occlusion may have effects on light transmission beyond the formation of rouleaux.
Index Terms—red blood cells, light transmission, rouleaux,
occlusion
I. INTRODUCTION
OULEAUX (Fig. 1) are aggregates of red blood cells (RBCs) that normally form in the blood of humans and some other animals in vitro at low shear rates [1-4], and they separate as shear rate increases [5]. When blood is flowing in vitro and the flow is suddenly stopped, the majority of individual rouleaux form within 10 seconds of flow cessation [6]. Beyond the first 10 seconds, larger aggregates continue to form as rouleaux collide into each other and stick together following collision [7].
While rouleaux formation is clearly visualised in vitro, this is not easy in vivo. However some studies have generated results which provide evidence that rouleaux can form in vivo, particularly when blood is at stasis or flowing slowly. Several researchers have investigated the presence of rouleaux in blood using ultrasound, finding that ultrasound
Manuscript received March 06, 2012; revised 02 April, 2012.
M. P. McEwen is with the School of Computer Science, Engineering & Mathematics, Flinders University, and the Biomedical Engineering Department, Flinders Medical Centre, South Australia (phone: +618-8204-4063; fax: 618-8204-5840; e-mail: [email protected]).
K. J. Reynolds is with the School of Computer Science, Engineering & Mathematics, Flinders University, South Australia (email: [email protected]).
echogenicity of human blood appears to increase as a result of rouleaux formation [8-10] (which results in the presence of effectively larger particles in blood). Images recorded from rats have provided further evidence for the formation of rouleaux in vivo [11-13].
Rouleaux formation in vitro has been studied in detail by a number of authors using optical methods [6, 14-17] Syllectometry, as originally described by Zjilstra [15, 18], is a technique in which blood is illuminated, and subjected to shear flow. Light transmission (or reflection) through the blood is recorded, when flow is abruptly stopped, and plotted against time as a syllectogram.
A syllectogram reveals a distinctive pattern resulting from the behaviour of the RBCs [19]. With human blood, an initial rapid decrease in light transmission results from the disalignment of the RBCs, previously aligned during flow. This is followed by a subsequent increase in light intensity, rapid at first (as rouleaux form in the blood) and then slowing down to a plateau (with increasing aggregation of the cells). When rouleaux formation is negligible (eg sheep [2]) or is so strong that rouleaux are present in flowing blood (eg horse [20]) little or no increase in light intensity, corresponding to the formation of rouleaux when blood flow stops, may be expected.
A role for rouleaux has been proposed in photoplethysmography [14, 17] and in the time course of light transmission through tissue during blood flow occlusion. Differences in the vasculature and the blood of different species enable the influence of these factors on the transmission of light through tissue to be investigated. This pilot study aimed to investigate light transmission through tissue during blood flow occlusion in animals of three different species, with different degrees of rouleaux formation. Specifically, the paper compares the transmission of light through the occluded tissues of humans, sheep and horses. The Aggregation Index for human, sheep and horse blood is 0.09, 0.01 and 0.30 respectively [2], indicating that while sheep blood does not readily form rouleaux, horse RBCs aggregate very strongly.
II. METHODS A. Ethics
Ethical approval was obtained from the Flinders Clinical Research Ethics Committee for all testing involving human subjects - who all gave informed written consent. Ethics approvals were obtained from the Flinders University Animal Welfare Committee and the Institute of Medical and Veterinary Science Animal Ethics Committee for all testing
Light Transmission Patterns in Occluded Tissue:
Does Rouleaux Formation Play a Role?
Mark P. McEwen, Karen J. Reynolds
R
conducted on sheep and horses. B. Test Subjects
11 volunteer human subjects, eight sheep and five horses were involved in this study. In the case of sheep and horses, tests were conducted on anaesthetised animals to avoid unwanted movement. To reduce the impact on animal wellbeing, only animals being anaesthetised for other purposes were involved.
C.Light transmission measurement
A custom device, containing a Light Emitting Diode (LED) probe and a light sensor probe, was used to measure the transmission of light through tissue (Fig. 2). The nominal centre wavelengths of the LEDs used were 660, 810, and 940 nm. Note, the custom device also contained 8 other wavelengths of light as part of a bigger study, but these are not included in the current paper.
D.Anatomical measurement sites
When measuring light transmission through human tissue, the finger was used as the measurement site (Fig. 2), as is usual practice in pulse oximetry. Human patients rested in a sitting or supine position during testing. The external ear and
the tongue were the most convenient measurement sites for testing animals. In the case of horses with dark fur, the signal-to-noise-ratio was very low when the ear was used, hence the tongue, with its absence of fur, was used for all horses (Fig. 2).
E. Occluding blood flow
To achieve the condition of blood flow occlusion, a blood pressure cuff was used. The LED and light sensor probes were positioned at a measurement site and the occlusion cuff was positioned proximally to the probes, adjacent to the measurement site (Fig. 2). When performing tests on human fingers, the occlusion cuff was inflated around the proximal end of a finger, without distorting the finger. However, when the cuff was inflated around an animal's ear, the ear could fold - possibly damaging the ear and preventing complete blood flow occlusion. Therefore to maintain the natural curved shape of the ear, a bung consisting of some silicone wrapped around a piece of rubber hose (Fig. 3) was placed inside the ear and the occlusion cuff was placed outside the ear, such that when the cuff was inflated, the ear was squeezed between the bung and the cuff - resulting in the occlusion of blood flow without folding of the ear.
When using the tongue as the measurement site, to maintain the natural, approximately flat, shape of a tongue when occlusion pressure was applied, “tongue clamps” (Fig. 4) were placed over an occlusion cuff when it was positioned around the proximal end of a tongue. Although called clamps, these devices were not used to apply any force to the tongue. They were positioned over occlusion cuffs, and adjusted to reduce the clearance between the tongue, cuff and clamp before occlusion was applied, to minimise distortion of the tongue when the cuff was inflated.
[image:2.595.47.279.278.685.2]Occlusion cuff pressures between 200 and 300 mmHg were used to occlude blood flow. This range is well above Fig. 4. Tongue ‘clamps’ for maintaining natural tongue shape during occlusion.
Fig. 3. Cuff and bung for measuring light transmission through a sheep ear during occlusion.
[image:2.595.305.539.344.438.2] [image:2.595.305.537.600.718.2]the normal systolic blood pressure for humans, sheep and horses [21-23]. These pressures are well tolerated by test subjects for short periods - being equivalent to the pressures at the bottom of a 3 to 4 metre deep swimming pool.
F. Occlusion procedure
Occlusion tests were performed, involving the following steps:
˗The light transmitting through tissue was measured for approximately 10 - 20 seconds under normal perfusion conditions
˗The pressure cuff was quickly inflated from zero to 200 – 300 mmHg using a hand operated pump, and the intensity of light transmitting through tissue was measured for approximately 60 seconds
˗The pressure cuff was deflated and the intensity of light transmitting through tissue was measured for another 20 - 30 seconds
G.Analysis of results
Individual light transmission signals were observed. To make comparisons of the light transmission changes during occlusion for the different species, the mean light intensity measured during occlusion was determined and plotted for each species. This involved dividing the value of light intensity at all times during the occlusion period, by the value of light intensity at the point occlusion was applied (normalising), and multiplying the result by 100, then calculating the arithmetic mean value (and standard deviation) of light transmission at all times during occlusion for all the signals recorded for each species.
III. RESULTS
A. Light transmission signal patterns - human
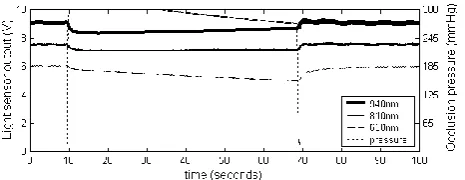
Measurements of the light transmission through the fingers of human subjects during blood flow occlusion resulted in signals which generally followed the pattern of initial sharp decreases, followed by a relatively rapid exponential type increase, steadying to an approximately linear increase/decrease in transmission (Fig. 5).
In some cases, signals did not match this pattern, and the initial exponential increase was not observed. Close examination of the signals revealed that the pattern of light transmission during occlusion was not affected by the timing of the application of occlusion pressure with respect to the cardiac cycle.
B. Light transmission signal patterns - sheep
Signals measured from sheep also showed some
variability. Fig. 6 shows a signal measured from a sheep ear. In general, the exponential type increase of Fig. 5 (human) was not observed.
C. Light transmission signal patterns - horses
Signals measured from horses also varied but in general, the exponential type increase of Fig. 5 (human) was not observed.
D.Mean transmission signals
Fig. 7 shows the mean and standard deviations of light transmission at the three wavelengths recorded during occlusion from human subjects (left), sheep (centre) and horses (right). Time zero corresponds to the point of occlusion. Table I compares the basic features of those signals, including the slope of the mean signals during the latter part of occlusion periods.
IV. DISCUSSION
The mean light transmission signals for the different species (Fig. 7) show a number of features:
˗All showed an immediate decrease in light transmission at the start of occlusion.
˗Following this initial decrease, the transmission of all colours of light increased in decaying exponential fashion for a short time through human tissue, and decreased in decaying exponential fashion for a short time through sheep tissue. Mean signals from horses did not have obvious exponential type components. ˗Signals beyond the first few seconds in all species were
approximately linear. In this region, the red (660 nm) light transmission decreased in all three species (see
TABLEI
DIFFERENCES IN MEAN LIGHT TRANSMISSION BETWEEN SPECIES
Human Sheep Horse Rouleaux formation: Moderate No Strong Exponential type
transmission change at start of occlusion:
Increase Decrease No Slope of 660 nm
transmission 20-50 s after occlusion onset (%/s):
-0.19 -0.22 -0.31 Slope of 810 nm
transmission 20-50 s after occlusion onset (%/s):
0.05 -0.01 0.02 Slope of mean 940 nm
transmission 20-50 s after occlusion onset (%/s):
[image:3.595.305.538.96.186.2] [image:3.595.46.279.559.654.2]0.07 0.03 0.06 Fig. 6. Light transmission through a sheep ear.
Table I), while infrared (940 nm) light transmission increased slightly. 810 nm light transmission remained approximately constant in sheep and horse tissue, whilst increasing in human tissue, as occlusion time increased.
The mean pattern seen in human subjects was in agreement with that reported by Shvartsman and Fine [16, 17, 24] who stated that “the transmission always grows during a certain initial time interval, which is different for different wavelengths of incident radiation, and then, in an asymptotic time interval, it monotonously grows or falls, depending upon the wavelength of incident light”. It should be noted however, that not all signals recorded from human subjects in our study clearly displayed this pattern.
Dobbe et al [7] described two phases of aggregation; an initial phase of one-dimensional (as in Fig. 1) rouleaux formation with a time constant of 1-3 s, followed by three-dimensional (3-D) aggregate formation during which rouleaux connect end-to-end as well as side-to-end, creating larger aggregates. In normal human blood, the formation of these aggregates is a slower process with a time-constant of about 10–25 s.
The decaying exponential increase seen in the mean signals from human subjects could be due to the initial formation of rouleaux following blood flow cessation. This early increase in transmission was not observed in the mean signals for sheep (which do not form rouleaux), neither was it observed in horses, whose blood shows a very strong tendency to form aggregates. This may be interpreted as an indication that rouleaux formation was not responsible for the decaying exponential-type increase seen in the mean signals from humans. However the extremely strong tendency of horse RBCs to aggregate means that rouleaux do not disperse fully even at high shear rates [20]. Thus it is feasible that horse blood is aggregated to some degree during normal blood flow in which case halting blood flow may not result in a rapid process of rouleaux formation.
Following the initial exponential changes in light transmission, further changes were more linear (Fig. 7). These changes (decrease in red (660 nm) and increase in infrared (940 nm) light transmission) may be at least partly due to deoxygenation of the blood, during occlusion, as oxygen moved from haemoglobin in the RBCs to the nearby tissues. Light at 810 nm is absorbed approximately equally by oxygenated and reduced haemoglobin (an isobestic wavelength), hence would not be expected to change due to deoxygenation. Fig. 7 and Table I show that 810 nm transmission changed little in sheep or horses after the first 20 seconds of occlusion, however there was a small increase in 810 nm light transmission in the mean signals from humans. Continued rouleaux formation and aggregation may be an explanation for the presence of this mean increase.
There was considerable variation in the time course of
light transmission through tissue during occlusion, as indicated by the large standard deviation compared to the overall change in mean transmission during occlusion (Fig. 7).
Mechanisms that could have contributed to the large variation in light transmission included:
˗The transfer of occlusion pressure to deep blood vessels. Although occlusion pressure was applied to the outside of tissue quickly, it may not have been transferred to the deeper blood vessels at the same rate for all individuals due to variations in tissue viscoelasticity.
˗Vasoactive mechanisms, such as capillary dilation. Gregory and Mars showed that capillaries can dilate in response to compressed air massage of muscles [25]. If capillaries can dilate in response to tissue being occluded, there could be a movement of blood from within large vessels to capillaries. Such a movement of blood could enable light to more easily transmit through large vessels, whilst decreasing the transmission of light through capillaries, which may result in a change in overall light transmission through tissue.
˗Differences in the rate of rouleaux formation between individuals. Aggregation is affected by some plasma protein concentrations [26], by the blood haematocrit [27], and is increased in a number of diseases [28]. This work has not considered all the possible differences between humans, sheep and horses. It is possible that species dependent parameters, other than those considered here, may be involved in the differences found, in the measurements of light transmission, from humans, sheep and horses.
V. CONCLUSION
Human Sheep Horse
6
6
0
n
m
8
1
0
n
m
9
4
0
n
[image:5.595.44.552.61.438.2]m
Fig. 7. Mean light transmission during occlusion for human subjects (left), sheep (centre) and horses (right).
REFERENCES
[1] J. Derganc, B. Bozic, S. Svetina, and B. Zeks, "Equilibrium shapes of erythrocytes in rouleau formation," Biophys J, vol. 84, pp. 1486-92, Mar 2003.
[2] U. Windberger, A. Bartholovitsch, R. Plasenzotti, K. J. Korak, and G. Heinze, "Whole blood viscosity, plasma viscosity and erythrocyte aggregation in nine mammalian species: reference values and comparison of data," Exp Physiol, vol. 88, pp. 431-40, May 2003.
[3] X. Weng, G. Cloutier, P. Pibarot, and L. G. Durand, "Comparison and simulation of different levels of erythrocyte aggregation with pig, horse, sheep, calf, and normal human blood," Biorheology, vol. 33, pp. 365-77, Jul-Oct 1996. [4] X. Weng and G. Cloutier, "Comparison and simulation of
different levels of erythrocyte aggregation with pig, horse, sheep, calf, and normal human blood (vol 33, pg 365, 1996),"
Biorheology, vol. 33, pp. 509-509, Nov-Dec 1996.
[5] J. Adam, "(A note on)² the shape of the erythrocyte,"
Mathematical and Computer Modelling, vol. 27, pp. 73-77, Apr
1998.
[6] H. Schmid-Schonbein, K. A. Kline, L. Heinich, E. Volger, and T. Fischer, "Microrheology and light transmission of blood. III. The velocity of red cell aggregate formation," Pflugers Arch,
vol. 354, pp. 299-317, 1975.
[7] J. G. Dobbe, G. J. Streekstra, J. Strackee, M. C. Rutten, J. M. Stijnen, and C. A. Grimbergen, "Syllectometry: the effect of aggregometer geometry in the assessment of red blood cell shape recovery and aggregation.," IEEE Trans Biomed Eng.,
vol. 50, pp. 97-106, Jan 2003.
[8] R. S. Finkelhor, W. E. Lamont, S. K. Ramanavarapu, and R. C. Bahler, "Spontaneous echocardiographic contrast in the thoracic
aorta: factors associated with its occurrence and its association with embolic events," Am Heart J, vol. 130, pp. 1254-8, Dec 1995.
[9] G. Cloutier, X. Weng, G. O. Roederer, L. Allard, F. Tardif, and R. Beaulieu, "Differences in the erythrocyte aggregation level between veins and arteries of normolipidemic and hyperlipidemic individuals," Ultrasound Med Biol, vol. 23, pp. 1383-93, 1997.
[10] H. Kitamura and S. Kawasaki, "Detection and clinical significance of red cell aggregation in the human subcutaneous vein using a high-frequency transducer (10 MHZ): a preliminary report," Ultrasound Med Biol, vol. 23, pp. 933-8, 1997.
[11] S. Kim, A. S. Popel, M. Intaglietta, and P. C. Johnson, "Aggregate formation of erythrocytes in postcapillary venules,"
Am J Physiol Heart Circ Physiol, vol. 288, pp. H584-90, Feb 2005.
[12] M. Tomita, N. Tanahashi, H. Takeda, I. Schiszler, T. Osada, M. Unekawa, and N. Suzuki, "Capillo-venous flow in the brain: significance of intravascular RBC aggregation for venous flow regulation," Clin Hemorheol Microcirc, vol. 34, pp. 51-7, 2006. [13] S. Kim, J. Zhen, A. S. Popel, M. Intaglietta, and P. C. Johnson, "Contributions of collision rate and collision efficiency to erythrocyte aggregation in postcapillary venules at low flow rates," Am J Physiol Heart Circ Physiol, Jul 6 2007.
[14] I. Fine, B. Fikhte, and L. D. Shvartsman, "RBC-aggregation-assisted light transmission through blood and occlusion oximetry," Proc. SPIE, vol. 4162, pp. 130-139, Nov 2000. [15] N. J. Jansonius and W. G. Zijlstra, "Various Factors Influencing
[16] L. D. Shvartsman and I. Fine, "RBC aggregation effects on light scattering from blood," Proc. SPIE, vol. 4162, pp. 130-139, Nov 2000.
[17] L. D. Shvartsman and I. Fine, "Optical transmission of blood: effect of erythrocyte aggregation," IEEE Trans Biomed Eng,
vol. 50, pp. 1026-33, Aug 2003.
[18] W. G. Zijlstra, "Syllectometry, a new method for studying rouleaux formation of red blood cells," Netherlands Soc. Phyiol.
Pharmacol., vol. 18, pp. 153-154, Oct 1957.
[19] R. Brinkman, W. G. Zijlstra, and N. J. Jansonius, "Quantitative evaluation of the rate of rouleaux formation of erythrocytes by measuring light reflection (“Syllectometry”)," in Proc. Roy.
Dutch Academy Science, Series C, 1963, pp. 236-247.
[20] H. J. Klose, E. Volger, H. Brechtelsbauer, L. Heinich, and H. Schmid-Schonbein, "Microrheology and light transmission of blood. I. The photometric effects of red cell aggregation and red cell orientation," Pflugers Arch, vol. 333, pp. 126-39, 1972. [21] H. Hornicke, W. von Engelhardt, and H. J. Ehrlein, "Effect of
exercise on systemic blood pressure and heart rate in horses,"
Pflugers Arch, vol. 372, pp. 95-9, Nov 25 1977.
[22] P. Segers, P. Steendijk, N. Stergiopulos, and N. Westerhof, "Predicting systolic and diastolic aortic blood pressure and stroke volume in the intact sheep," J Biomech, vol. 34, pp. 41-50, Jan 2001.
[23] A. Vander, J. Sherman, and D. Luciano, Human Physiology
The mechanisms of body function, 7th ed.: WCB/McGraw-Hill,
1998.
[24] I. Fine and L. Shvartsman, "US Patent 6,587,704 Method for non-invasive optical measurements of blood parameters ", U. P. T. Office, Ed. United States: Orsense Ltd., 2000.
[25] M. A. Gregory and M. Mars, "Compressed air massage causes capillary dilation in untraumatised skeletal muscle: a morphometric and ultrastructural study," Physiotherapy, vol. 91, pp. 131-137, Feb 2005.
[26] H. Schmid-Schonbein, E. Volger, and H. J. Klose, "Microrheology and light transmission of blood. II. The photometric quantification of red cell aggregate formation and dispersion in flow," Pflugers Arch, vol. 333, pp. 140-55, 1972. [27] K. J. Reynolds, "An optical sensor for blood haematocrit." vol.
MSc: University of Oxford, 1990.
[28] H. Zhao, X. Wang, and J. F. Stoltz, "Comparison of three optical methods to study erythrocyte aggregation," Clin