400
©IJRASET: All Rights are Reserved
Optimization of Distributed Generation using Elephant
Herding Optimization (EHO) Techniques and
Improvement in Multi-Objective Function
Preeti Bala Sukhwal1, Pushpendra Singh2
1
M.tech Student, 2Assistant Professor, EE Department, Govt Women Engineering College, Ajmer, India
Abstract: In Power System the Distribution network has the maximal no. of losses, basically these losses occurs in distribution system due to high concentration of inductive loads and demand .The placement of distributed generation resources and shunt compensation capacitors are used to one of the method for reducing losses in power system. But in this paper Distribution System, Distributed Generators are frequently used to provide active and reactive power for reducing active power losses and improves voltage profile So, proper installation of Distributed generators are necessary with optimal size and site. For DG installation in distribution system used some parameter like: DG location, DG size, Capacity and Numbers of DG units, type of system connection, DG technology etc. The power imparts from DG units located near to load centre provide an opportunity for system power loss reduction ,improvement in voltage stability and voltage profile , environmental friendliness and increasing reliability. In this paper presents Elephant Herding Optimization Techniques for finding Optimal Size and Site of DG in Radial distribution system .The main Objectives of this technique is Reduction in active power losses ,better voltage profile and Improvement in voltage stability index with operating security constraints in radial distribution network and performed in MATLAB R2015a Software . The proposed EHO techniques implemented for 33- bus and 69-bus standard test radial distribution system.
Keywords: EHO (Elephant Herding Optimization), VSI (Voltage Stability Index ) , DG (Distributed Generation), RDS (Radial Distribution System ), RDN (Radial Distribution Network), MOF (Multi-Objective Function), DER(Distributed Energy Resources), DS (Distribution System) .
I. INTRODUCTION
The Electrical Power System used in the past time was conventional centralized generation units ranges from 100MW to GW at remote location connected to loads with availability of renewable resources but as an alternative of using conventional generation units , now a day’s distributed generator is used recently developed technology ranges from few watts to MW located nearby load centre with distributed Energy resources and DG technologies (like PV system ,wind turbines ,micro-turbines , fuel cells and battery system , combustion gas turbines etc.) [1][18].Generally the Distribution System uses radial and meshed (or network) type in rural and urban areas simultaneously with properly designed generation units. These generation units can distinctively effects on power system performances like power flow losses, voltage profile, voltage stability and reliability. The effects may be either positive or negative according to using DG technology and distribution system operating characteristics. Positive effect basically supported to electrical power system i.e. considered as improvement in system stability and reliability, better voltage profile, reduction in losses and environmental benefits etc. [2].For the Number of Electrical network user ( or customer) increases rapidly with time also rise in network losses so, proper designing and utilization of network provided by distribution companies. In distribution system DG changes power flow and also changes the power losses. [3][4].Conventionally, placement of Distributed Generation and Capacitor are in power system to resituate for voltage profile improvement, power loss reduction and voltage stability improvement.[5].DG mainly classified in four types according to power flow i.e. shown in below :-
(A).DG supplying only active power (P.F. DG=unity, examples:-fuel cells, battery storage system and micro turbines) (B).DG supplying only reactive power (P.F. DG =zero, examples:-Synchronous Compensators, KVAR and capacitors) (C).DG inserting both active and reactive power (0<P.F.DG <1/+ve, examples:-Synchronous Generators)
(D).DG supplying active and drawing reactive power (0<P.F.<1/-ve, examples: - Wind Turbines connected with Induction Generator)[6].
401
©IJRASET: All Rights are Reserved
But In Distribution System capacitor placement not uses distributed energy resources because in our country resources scattered naturally with small sizes. Transmission and Distribution costs are reduced when DG unit connected nearby consumer’s .So using EHO for optimal sizing and location of distributed generation with better voltage profile, improvement in voltage stability index, reduction in active power losses and high penetration level of DG discuss in this paper. The locations of DG in distribution network determined on the basis of active power supply by the nodes in system [8].
II. PAGELAYOUT
In this paper sequentionally defines the problem formulation for single objective function (like: reduction in active power losses, improvement in node voltage fluctuation and maximization of voltage stability index) and multi-objective function (like: system operating constraints), EHO method, Flow chart for EHO, For 33-bus and 69-bus System Case Studies, Fig of node voltage profile, Table respectively, Applications of EHO, Conclusion, References etc.
III.PROBLEMFORMULATION
This Section defined the objective function with single and multi objective, system operating constraints for optimal placement of DG using Elephant Herding Optimization Techniques [9]. In this study following assumptions to be taken into account i.e.-
A. Unity Power Factor of the DGs.
B. Balanced Radial Distribution network to be considered.
C. Load level to be considered as Nominal.
D. DER is not considered uncertainty [10].
1) Objective Function: For DG placement in Radial Distribution System the objective function is reduction in active power losses, Improvement in node voltage fluctuation, maximization of voltage stability index and DG penetration with all system operating constraints defined in below:-
a) Single Objective Function: Generally this objective function is defined by a single number of function like: reduction in active power losses ,improvement in node voltage fluctuation ,maximization of voltage stability index etc.
i) Reduction in Active Power Losses: During power dispatch in distribution system maximum no. of power losses take place in power system. So, the main aim of power system is to be power distributed at minimum losses and considered as objective of system:-
F1=Minimum (PLoss) (1)
In radial distribution system where PLoss is active power losses and given by:-
(2)
Where :- =rijcos(δi-δj)/ViVj ,bij=rijsin(δi-δj)/ViVj ),Pi= injected active power at node i ,Qi= injected
reactive power at node i ,N=total numbers of nodes in system ,rij=resistance of branch between i and j ,δi=Angle of ith node ,
Vi=voltage magnitude at ith node .
ii) Improvement in Node Voltage Fluctuation: The voltage quality measured across system nodes i.e. known as node voltage fluctuation. For improvement in node voltage fluctuation DG connected nearby load centre and considered as an objective
function defined by:- 2 (3)
iii) Maximization of Voltage Stability Index: In distribution system the improvement in node voltage deviation is not sufficient measure for security purposes .so the VSI is supported to maximize Voltage Stability Margin (VSM) of the system. Generally VSI is a capability to maintain voltage profile at increasing loading condition with permissible limits of nodes. For radial distribution network VSI is given by:-
2
(4)
b) Multi-objective Function: A number of functions to be optimized concurrently within various system constraints. Multi objective function combines reduction in active power losses, improvement in node voltage fluctuation and maximization of voltage stability index in this paper.
MOF = (α1F1+α2F2+α3F3) (5)
Where: - function F1 =reduction in active power losses, F2 = improvement in node voltage fluctuation, F3=maximization of voltage
402
©IJRASET: All Rights are Reserved
2) Operating System Constraints: Following constraints are used in single and multi objective function described in below:-
a) Equality Constraints
i) Power Balance Constraints: Total active and reactive power supplied by DG with satisfying power balance constraints distinctively.
(6)
(7)
Where: = Impedance angle between ith and jth node, =Elements of Y bus matrix, =Voltage at ith node and Voltage
at jth node.
b) Inequality Constraints
i) Thermal limits:-The current at particular branches with allowable limits is defined as:- Iij≤ Iijmaximum (8)
a. Where: Iij=current flowing through ith and jth branch, Iijmaximum =maximum loading of distribution system connected between
ith and jth node.
ii) Bus Voltage Limits:-In distribution system voltage constraints within upper and lower permissible limits of voltage imbalances at various nodes.
Viminimum<Vi<Vimaximum (9)
a. Where: Viminimum =minimum value of bus voltage limits i.e. 0.95 p.u.
Vimaximum=maximum value of bus voltage limits i.e.1.05 p.u.
iii) Active Power Limits:-The active power limits of DG at ith bus with specified various limits is given by:- PDG,iminimum≤PDG,i≤PDG,imaximum (10)
a. Where: PDG,iminimum =minimum value of active power at ith bus of DG, PDG,imaximum = maximum value of active power at ith bus
of DG.
iv) Reactive Power Limits:-The reactive power limits of DG at ith bus with specified various limits is given by:- QDG,iminimum≤QDG,i≤QDG,imaximum (11)
a. Where: QDG,iminimum=minimum value of active power at ith bus of DG, QDG,imaximum = maximum value of active power at ith bus
of DG [5][11].
v) DG penetration limits:-The Existing Distribution system is generally uses load 0.5MW, 3MW, 6MW, 10MW with this capacity 4KV, 12KV, 25KV, 34KV respectively. DG penetration with allowable limits is defined as:-
SDG≤ SDGmaximum (12)
a. Where: SDGmaximum=maximum allowable limits of DG can be placed at a single node [10].
IV.ELEPHANTHERDINGOPTIMIZATION(EHO)
A newly developed nature inspired method i.e. EHO techniques proposed by Gai –Ge Wang et.al. In 2015.The principle inspired of this algorithm is “Herding behaviour of elephants” [12].
Elephant Herding Behaviour:-Generally on our land Elephants are one of the largest mammals .Traditionally American elephant and African elephant are two type species recognized .A long trunk is an indication of elephant and i.e. multi-uses like: holding objects, lifting water and breathing etc. Elephants are social animals in nature and Elephant herding combines the female elephant and claves. Each clan follows the matriarch (leader elephants).Female Elephant always selected to live together with their family groups but the male elephants isolated or not contact with their family groups when male elephants grow up and using low frequency vibrations they live in connect with their family groups. Basically two types operators used for this global optimization method that is clan updating and clan separating operator. The following rules used for this optimization method:-
1) The population of elephant is consists of some clans and fixed number of elephant or equal number of elephant in each clan to
be considered.
2) In each clan elephant live together with leadership of matriarch and considered the fittest elephant in each clan.
3) Male elephant considered to be fixed number and isolated from their main family groups at a time of start of generation.
This Algorithm is mathematically modelled and classified into different steps which are shown in below section:-
403
©IJRASET: All Rights are Reserved
Where =Present position of ith elephant in cjth clan, = New position of ith elephant in cjth clan, rand=random number
between 0 and 1, =scale factor between 0 and 1.
Step: 2-(In each clan position update of fittest elephant):-Matriarch or leader elephant is considered to be fittest elephant and updated this position given by:-
(14)
Where: - , =total no. of elephant in each clans , i=individual
elephant in each clan.
Step: 3-(In each clan separating the worst elephant):- Male elephant or worst elephant separated from their family group in each clan and gives worst solution which is modifying by:-
(15)
Where: - =Minimum permissible limits for the each clan elephants, = Maximum permissible limits for the each
clan elephants, =male or worst ith elephant in cjth clan, r=random number between 0 and 1.
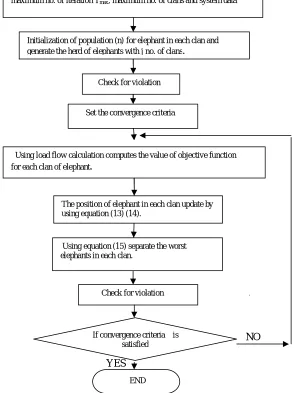
Step: 4-(Check Convergence):-When Convergence criteria not satisfied then repeated step1 to step 3. The Flow chart of EHO (Elephant Herding Optimization) technique in below fig.
NO
[image:4.612.150.446.325.718.2]YES
Fig. 1. flow chart of EHO (Elephant herding optimization) algorithm
Define and read the control and design parameters of algorithm like as α, β, maximum no. of iteration Tmax, maximum no. of clans and system data
Initialization of population (n) for elephant in each clan and generate the herd of elephants with j no. of clans.
Using load flow calculation computes the value of objective function for each clan of elephant.
The position of elephant in each clan update by using equation (13) (14).
Using equation (15) separate the worst elephants in each clan.
Check for violation
If convergence criteria is satisfied
END Check for violation
404
©IJRASET: All Rights are Reserved
V. SYSTEMCASESTUDIES
EHO method is applied on two 33-bus and 69-bus IEEE Standard test Distribution System .The Controlling Parameters used in this
method for 33-bus radial distribution system are given by:- maximum number of iteration (Tmax)=100, α = 0.5(scaling
factor),β=0.1(scaling factor),population size(n)=50 and 69-bus radial distribution system are given by:- maximum number of
iteration (Tmax)=100, α = 0.5(scaling factor),β=0.1(scaling factor),population size(n)=150 . In this paper numerous optimization
techniques provide for various case studies and compared simulation result and performance of EHO with other optimization techniques.
1) System-1 Studies:-For the optimal sizing and location problem of 33-bus radial distribution system used with suitable problem formulation and this solution .The simulation results attained are analysed and compared with different cases. In this method uses Active power demand=3.715MW, Reactive power demand=2.3000KVAr, Base Voltage=12.66KV for Systm-1 studies.
a) Case-I (Base Case):-For this case not used any type of DG and Table1. Combines the Optimal DG Site, Optimal DG Size,
objective function values i.e.F1,F2,F3, Multi-objective function values (using weight or penalty co-efficient) and DG Penetration.
b) Case-II(Three DG Operated at Unity Power Factor (UPFs)):-In this case three different nodes used for three DG installation in Distribution System .The simulation result attained by EHO method and compared to different existing method explained in
Table1 in this paper. Table1 combines the Optimal DG Site, Optimal DG Size, objective function values i.e.F1,F2,F3,
Multi-objective function values (using weight or penalty co-efficient) and DG Penetration and Proposed method represented by bold values in this table. The Proposed EHO method compared to PSO, GA/PSO, TLBO, QOTLBO, GA with changes in objective function.
c) Case-III (Four DG operated at Unity Power Factor):- In this case four different nodes used for four DG installation in Distribution System .The simulation result attained by EHO method and compared to different existing method explained in
Table1 in this paper. Table1 combines the Optimal DG Site, Optimal DG Size, objective function values i.e.F1,F2,F3,
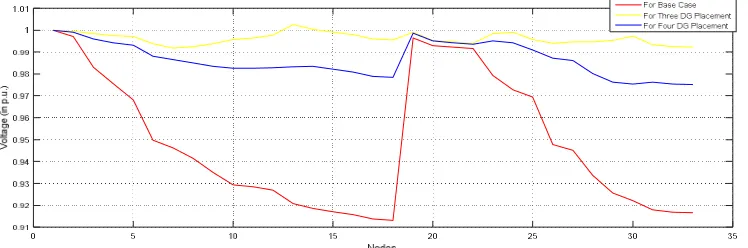
Multi-objective function value (using weight or penalty co-efficient) and DG Penetration and Proposed method represented by bold values in this table. The Proposed EHO method compared to PSO, GA/PSO, IMOHS, GA with changes in objective function. In this System Studies Case-II gives best or optimal solution as compared to Case-I and Case-III. Voltage Profile of system obtained better for all cases w.r.t. base case shown in Fig 2. And improves the value of voltage stability index for Case-II as compared to Case-I and Case-III.
2) System-2 Studies: For the optimal location and sizing problem of 69-bus radial distribution system used with suitable problem formulation and this solution .The simulation results attained are analysed and compared with different cases. In this method uses Active power demand=3.715MW, Reactive power demand=2.3000KVAr, Base Voltage=12.66KV for Systm-2 studies.
a) Case-I (Base Case):-For this case not used any type of DG and Table2. Combines the Optimal DG Site, Optimal DG Size,
objective function values i.e.F1,F2,F3, Multi-objective function values (using weight or penalty co-efficient) and DG Penetration.
b) Case-II (Three DG Operated at Unity Power Factor (UPFs)):-In this case three different nodes used for three DG installation in Distribution System .The simulation result attained by EHO method and compared to different existing method explained in
Table2 in this paper. Table2 combines the Optimal DG Site, Optimal DG Size, objective function values i.e.F1,F2,F3,
[image:5.612.128.502.587.711.2]Multi-objective function values (using weight or penalty co-efficient) and DG Penetration and Proposed method represented by bold values in this table. The Proposed EHO method compared to PSO, GA/PSO, TLBO, GA with changes in objective function. In this System Studies Case-II gives best or optimal solution as compared to Case-I .Voltage Profile of system obtained better for all cases w.r.t. base case shown in Fig 3 and Improves the value of voltage stability index for Case-II as compared to Case-I.
405
©IJRASET: All Rights are Reserved
Fig.3. System-2 Node Voltage Profile for different cases
Table1. For IEEE 33-bus system with proposed EHO method compared to different method
Case Used
method
Optimal
DG site Optimal DG Size(MW)
Value of Objective
Function Multi-
Objective Function
DG Penetration (in %) F1
(MW)
F2 F3
I. BASE
CASE __ __ 0.2025 0.1170 0.6989 0.5232
0.00
II. PSO 8,13,32 1.177,0.982,0.830 0.1053 0.0335 0.9256 0.4510 50.27
GA/PSO 11,16,32 0.925,0.895,1.200 0.1034 0.0124 0.9508 0.4442 50.27
TLBO 12,28,30 1.183,1.191,1.186 0.1247 0.0011 0.9503 0.4580 59.90
QOTLBO 13,26,30 1.083,1.188,1.199 0.1034 0.0011 0.9530 0.4376 58.38
GA 25,30,13 0.9090,1.6840,1.1658 0.0958 0.0007 0.9701 0.4359 53.76
EHO 24,30,13 1.2630,1.6432,1.1400 0.0948 0.0006 0.9715 0.4353 57.92
III. PSO 6,15,25,31 0.830,0.833,0.541,0.648 0.0713 0.0109 0.8776 0.3855 47.98
GA/PSO 14,24,26,32 0.663,1.023,0.867,0.664 0.0682 0.0130 0.8903 0.3878 54.12
IMOHS 6,14,24,31 0.937,0.667,1.012,0.731 0.0678 0.0111 0.8891 0.3862 56.31
GA 7,15,24,31 0.8884,0.6810,0.9420,0.7760 0.0670 0.0080 0.9049 0.3889 47.02
EHO 7,14,24,31 0.9802,0.6690,0.9698,0.7510 0.0667 0.0079 0.9058 0.3888 48.20
Table2. For IEEE 69-bus system with proposed EHO method compared to different method
Case Used
Method
Optimal DG Site
Optimal DG Size (MW)
Value of Objective Function Multi-
Objective Function
DG Penetration
(in %)
F1(MW) F2 F3
I. BASE
CASE __ __ 0.2274 0.0993 0.6870 0.5296
0.00
II. PSO 17,61,63 0.9925,1.1998,0.7956 0.0832 0.0049 0.9676 0.4250 40.113
GA/PSO 21,61,63 0.9105,1.1926,0.8849 0.0811 0.0031 0.9768 0.4249 40.115
TLBO 13,61,62 1.0134,0.9901,1.1601 0.0821 0.0008 0.9745 0.4237 42.47
GA 16,61,62 0.8002,1.17240.9974 0.0806 0.0006843 0.9784 0.4233 39.90
406
©IJRASET: All Rights are Reserved
VI.APPLICATIONOFEHO(ELEPHANTHERDINGOPTIMIZATION)
Proposed EHO method also used for solving real world problems i.e. Dynamic Economic Dispatch Problem and Optimal Control of Non linear Stirred Tank Reactor. Both of problems explain in below section:-
1) Dynamic Economic Dispatch(DED) Problem: This problem considered the hourly dispatch problem and at a time problem fluctuates the power demand with passing hour and also defined the one day power generation schedule. Using Static Economic Load Problem for optimization of DED problem considered 24times dimensions.
2) Optimal Control of Non linear Stirred Tank Reactor: Standard test meta-heuristics algorithm used for a continuous stirred non-linear i.e. multi-model optimization problem .The first order chemical reaction for this process is mathematically modelled and given by:-
(16)
And similarly for dx2,
(17)
Where:-u(t)=Rate of flow of the cooling fluid, =Steady state temperature for dimensionless quantity, = deviation from
dimensionless quantity at steady state concentration .To minimize the performance index determined the suitable value of u is given
by:- (18)
VII. CONCLUSIONS
Elephant group is consists of Female, Male, Matriarch (leader elephant) and several claves in nature. The herding behaviour of elephant in nature classified in two operator i.e. clan updating and clan separating operator and also EHO is newly developed swarm optimization method for solving global optimization problems. In this paper proposed EHO method applied on 33-bus and 69-bus radial distribution system with solving of optimal location and sizing problem of DG. For 33-bus System with 3 DG placement Optimization technique is compared to GA,PSO,GA/PSO,TLBO,QOTLBO and33-bus System with 4 DG placement Optimization technique is compared to GA,PSO,GA/PSO,IMOHS . For 69-bus System with 3 DG placement Optimization technique is compared to GA, PSO, GA/PSO, TLBO, but proposed method is superior to other existing method for 33-bus and 69-bus system. Proposed EHO method gives reduction in active power losses and improvement in node voltage profile and voltage stability index as compared to before DG Installation when DG installed in Distribution system improvement in objective function and multi-objective functions. The best DG Site for 33-bus system at 3 DG placement is analysed by EHO method at nodes 24,30,13 with node capacity 1.2630,1.6430,1.1400, than reduces active power from 0.2025 MW to 0.0948 MW and improves node voltage profile from 0.1170 p.u.to 0.0006 p.u. and also increases the value of voltage stability index i.e.0.6989 to 0.9715 at normal load condition. The best DG Site for 33-bus system at 4 DG placement is analysed by EHO method at nodes 7,14,24,31 with node capacity 0.9802,0.6690,0.9698,0.7510, than reduces active power from 0.2025 MW to 0.0667 MW and improves node voltage profile from 0.1170 p.u.to 0.0079 p.u. and also increases the value of voltage stability index i.e.0.6989 to 0.9058 at normal load condition. The best DG Site for 69-bus system at 3 DG placement is analysed by EHO method at nodes 15,60,61 with node capacity 0.7812,0.5197,1.6973, than reduces active power from 0.2247 MW to 0.0800 MW and improves node voltage profile from 0.0993p.u.to 0.0006432 p.u. and also increases the value of voltage stability index i.e.0.6870 to 0.9058 at normal load condition.
REFERENCES
[1] W El- Khattam ,M.M.A Salama “Distributed generation technologies ,definitions and benefits” Electric Power System Research Volume 71,Issue 2,Page no.119-128,October 2004.
[2] Philip P.Barker, Robert W.DE Mello “Determining the impact of distributed generation on power system: Part 1-Radial Distribution Systems Conference Power Engineering Society Summer Meeting, IEEE, Volume: 3, February 2000.
[3] N.Jenkins, J.B. Ekanayake and G.Strbac Book of “Distributed Generation” London Institute of Engineering and Technology –IET renewable energy series -1, Pages 278, 30 August 2010.
[4] S.M.Sajjadi, M.RHaghifam, Javad Salehi “Simultaneous Placement of Distributed Generation and Capacitors in Distribution Networks Considering Voltage Stability Index” Elsevier publication, International Journal of Electric Power & Energy System, Volume.46, March 2013.
[5] S. Sultana and P.K.Roy,”Mult-objective Quasi –Oppositional Teaching Learning based optimization for Optimal location of DG in radial Distribution System”, International Journal of Electric Power and Energy System, Volume 63, Dec.2014.
[6] U. Sultana, Azhar B.Khairuddin.M.M.Zareen “A review of Optimum DG placement based on Minimization of power losses and Voltage stability enhancement of Distribution System”, Elsevier publication, Journal Renewable and Sustainable Energy Reviews, Volume 63, September 2016.
407
©IJRASET: All Rights are Reserved
[8] M.H.Moradi and M. Abedini, “A combination of Genetics Algorithm and Particle Swarm Optimization for optimal DG Location and sizing in Distributed Systems”, International Journal Electric Power and Energy System, Volume 34, January 2012.
[9] N.K.Meena, Sonam Parashar, Anil Swarnkar, Nikhil Gupta, K.R.Niazi,”Improved Elephant Herding Optimization for Multi-Objective DER Accommodation in Distribution System”IEEE Transactions on Industrial Informatics, March 2018.
[10] Imran Ahmad Quadri .S.Bhowmick, D.Joshi, “A Comprehensive Technique for Optimal allocation Of DER in Radial Distribution Systems”, Elsevier publication, Journal Applied energy, February 2018 Volume 211.
[11] Preeti Bala Sukhwal, Pushpendra Singh “Optimization of Distributed Generation using Genetics Algorithm and improvement in multi-objective function”, International Research Journal of Engineering and Technology, Volume:6 Issue 9, September 2019.
[12] Gai-Ge Wang, Suash Deb , Xiao Zhi Gao ,Leandro Coelho “A new meta-heuristic optimization algorithm motivated by elephant herding behavior”, International Journal of Bio-Inspired Computation, Volume:8,No.6, January 2016.
[13] Sonam Parashar, Anil Swarnkar, Khaleequr Rehman Niazi, Nikhil Gupta “Modified elephant herding Optimization for economic generation co-ordination of DERs and BESS in grid connected micro grid” Published on: The Journal of Engineering, 3 November 2017.
[14] Priya Kashyap, Pushpendra Singh, “optimal placement and Size of DG and DER for Minimizing power loss and AEL in 33-Bus Distribution System by various Optimization Techniques” International Research Journal of Engineering and Technology (IRJET) Volume: 05, 10 Oct 2018.
[15] P.S.Georgilakis and N.D.Hatziargyriou, “Optimal DG placement in Power Distribution Network models, methods and future research”, IEEE Transactions Power System, Volume 28, 28 Aug.2013
[16] Pushpendra Singh, N.K.Meena, S. K. Bishnoi “Moth Search Optimization for Optimal DERs Integration in Conjunction to OLTC Tap Operations” IET System Journal Page No. 1-9, April 2019.
[17] “A PDF for Optimal Placement and Sizing of Capacitor -Shodhganga” shodhganga.inflibnet.ac.in>bitstream>16_chapter 4.
[18] S. N. Singh Jacob Ostergaard, Naveen Jain “Distributed Generation in power system: An overview and Key issues”IEC, published in: 24rth Indian Engineering Congress, January 2009.
[19] “A PDF for Optimal Placement and Sizing of Distributed Generator (DG) and Capacitor” shodhganga.inflibnet.ac.in>bitstream>18_chapter 6. [20] “A PDF for Optimal Placement and Sizing of Distributed Generator (DG)” shodhganga.inflibnet.ac.in>bitstream>17_chapter 5.