©IJRASET: All Rights are Reserved
454
Educational Data Mining-Students Performance
Prediction
Tanuja Sharma1, Rajendra Kumar Gupta2
1, 2
Department of Computer Science & Information Technology, MITS, Gwalior (M.P.) 474005, India
Abstract: Educational Data Mining is a prediction technique which extracts information of students from educational institutes like schools, colleges, universities. The whole idea of focusing on educational sector is the one related to discover new reasons or factors involved which are affecting their education. In this research, we conducted feature selection to select high impact characteristic and use techniques of data mining: Linear regression with the help of SPSS. Naïve Bayes, decision tree with the help of WEKA. This research is hold on 206 students by using 17 attributes in Madhav institute of technology and science, Gwalior. The result achieved with the help of the decision tree and naïve Bayes is able to predict the total number of students whose are outstanding, excellent, very-good, good, average, poor. The outcomes of feature selection method showed that 10th percentage and 12th Percentage were ranked top from all features and the result obtained by Naïve Bayes is better because it has a higher accuracy rate. The
result also provides step to improve students’ performance who were predicted to poor. With the help of this prediction, we will identify the students whose are weak and help to gain better CGPA.
Keywords: Educational Data Mining, Prediction, Decision Tree, Academic Performance, Data mining Application.
I. INTRODUCTION
©IJRASET: All Rights are Reserved
455
in further semesters. These relations can be discovered through a set of predictive models inculcating the whole ideas that are to be implemented in the dataset. To analyse the data and present a higher accuracy model for performance prediction. The accuracy models or the data represented in further sections shows the past background, abilities and their habits. By predicting, the performance we can show the higher predictive models that can be used for higher predictions and formulations that can enhance their future performances. To formulate a hypothesis, to check the factors responsible for their performance issues, the regression model helps in plotting predictive graphs, that can help in switching from educational background to their abilities and habits by which, we check what is a eating more and which one is more responsible.This paper shows the comparison of different data mining technique which are decision tree, naïve bayes and linear regression to predict student performance. This paper has divided in to six sections. Second section shows the various literature review. Third section presented description about three data mining methods that are decision tree, naïve bayes, linear regression. Fourth section focuses on data collection and representation. Fifth section shows the implementation of different data mining technique and comparison of different classifier. Sixth section concludes the results.
II. LITERATURE REVIEW
The background of this research is totally based on educational data mining and its classification techniques. The research paper used here are generally, based on students’ performance prediction conducted in various institutes. They have used various classifications methods like LR (linear regression), naïve bayes, SVM (support vector machine), K-nn, decision tree, ANN (artificial neural networks), ARM (association rule mining) etc. Attributes are general things that have to be chosen variably to perform predictions. The research paper have used their academic career, psychometric factors, past and present background of career including assessments, course details, etc. the whole thing was carried out in various software like WEKA, Rapid Miner, SPSS etc. These are represented below:
Pauziah Mohd Arsad,et al. [1], conducted a research on matriculation and diploma students to predict their academic performance at semester eight by using comparison between ANN (artificial neural network and LR (linear regression). Academic achievement of 8th semester was measured in the form of CGPA. This research was conducted in Universiti Teknology MARA (UiTM), Malaysia. The first semester’s result of student was used as input predictor variable or independent variable instead of this the final semester’s result (8th sem.) was used as dependent variable or output. The coefficient of correlation R was used for measuring the performances of the models. The outcomes of ANN and LR show a strong correlation between the first semester CGPA with the final CGPA. It compared the residuals of the methods executed in SPSS that represented actual and predicted values on a graph. It also performed the comparison of the correlation coefficient for both values. Henceforth, it resulted in different cases for different prediction models.
T.Devasia et al. [5], conducted a research by using 19 attributes on 700 undergraduate students in Amrita Vishwa Vidhyapeetham, Mysore using naïve bayes classifier. This proposed system makes use of naïve bayesian technique to extract useful information and this system was a web based application. The main motive behind this research is to increase the success graph of students by using system that maintains the course details, attendance details, subject details, marks details of all students.
Amirah Mohamed Shahiri et al. [7], conducted a review to show an overview of prediction techniques of data mining on a large amount of data in Malaysia for predicting the students’ performance. This study focused on the way in which various algorithms can be implemented to find the most essential attributes in a dataset of student. The whole dataset compared the various data mining techniques. This study also suggested a table with attributes for common methods. These methods are used together to give 100% results. This study presents a scenario for neural network, naïve bayes, K-nn, decision tree and support vector machine. It showed the prediction accuracy which used the classification method grouped by prediction algorithm since 2002 to 2015. Neural network performed to be the best of all. The attributes included the students’ past and present background of academic career, psychometric factors, Internal and external assessments.
©IJRASET: All Rights are Reserved
456
also helpful for enhancing the performance of regression-based system. Finally, we can say that this proposed hybrid method got the excellent RMSE score of 1.871 for targeted elective courses and 1.668 for hybrid approach.Surjeet Kumar Yadav et al. [10], conducted a research on engineering students using multiple decision tree algorithms which resulted in comparative analysis of prediction algorithm to show the better results in their upcoming semester. The multiple decision tree algorithms like CART, C4.5 and ID3 are applied for predicting the performance of student in the end semester or final exam. Their objective clearly stated that the steps included the generation of dataset with predictive variables, identification of the students learning behaviour, construction of predictive model using classification and lastly, validation of the model with universities which can be applied to all the institutions. The outcomes of decision tree found the probability of total students to fail and pass (promoted to next year). The result provides the way to enhance the students’ performance, that were predicted to promoted or fail. The outcomes prove that C4.5 likely, proved to be the best with 67% correctly classified instances compared to CART and ID3. On the basis of this review, we can conclude that mostly paper discussed here presented the different data mining technique in order to improve the student’s performance prediction. The main aim of all papers is to predict that how many students get success or failure. For this, researcher collected the previous academic record, social factors of student. The advantage of educational data mining is that student can identify if they are at risk point or not. This is also beneficial for universities in order to provide the extra tutorial to weak students. Different papers used different technique to perform classification and prediction. The accuracy of different classifier are compared. The algorithm which has achieved high accuracy are selected to perform prediction. Some researchers performed prediction at first semester while some researchers performed at middle semester and end semester. So, the difference is only in duration. All papers used GPA as a main attribute to perform prediction.
III.METHODOLOGY
Before going in to the depth of this study, we will talk about the crucial factors to predict performance of student. There are two important factors which are generally taken to predict the performance of student. First one is attributes and other is methods. Table 1 in section (iv) represents the list of common attributes used to predict students’ performance. The first step will pay attention to essential features to predict students’ performance. The second step will pay attention to the methods of prediction which are implemented to perform prediction.
A. The Important Attributes To Perform Prediction
With the help of systematic literature review, the attributes have great effect can be identify. Mostly papers used the CGPA as most influencing attribute for predicting the performance of student. The reason for choosing the CGPA as main attributes is that the CGPA has a real value to upcoming profession. CGPA can be recognized as a sign of academic achievement. The attributes used mostly are demographic and external assessments of student. Students’ demographic contains age, family background, gender and disability [13, 15, 16, 17, 19, 23, 24, 25] while the external assessments contains the marks obtained for a particular subject in final exam [11, 12, 15, 16, 18, 21, 22]. Mostly researchers used students demographic like gender because female and male students have different way of learning habit. In this study, it is found that mostly female students have different behaviours and positive attitude towards learning than male students [26]. Almost female students are dutiful and sincere in this study, always concentrate on study, self-directed etc. An effective leaning strategy used by female students during study, they have management, self-persuasion and practice which were applied by all female students, effectively [27]. Hence, this is proved that gender is the most significant attribute to influence students’ performance. There are three attributes that make use to predict students’ performance by many researchers. First one is high school background [21, 22], second is extra-curricular activities [13, 14, 15, 18, 28] and third is social interaction network [20, 23, 29]. There are five studies which used each one of these attributes from thirty papers. In another study, psychometric factor is used for predicting the students’ performance by mostly researchers [28, 30, 31, 32]. The psychometric factor is known as engage time of student, studying behaviours and parental support. These attributes are taken to design a system such that it is convenient, very simple, manageable and user friendly.
B. Methods to Perform Prediction
©IJRASET: All Rights are Reserved
457
1) Decision Tree: Decision tree is a compatible classification technique which performed classification and prediction amongresearchers. The tree structured follows the structure of branch node and leaf nodes, attached to it. It generates a top-down tree like a structure by using attributes of dataset. The node, which represent the leaf is the class label chosen by decision tree. This tree contains a root node, internal node and leaf (terminal) node.
a) Root node: Root node is 1st node, which have no incoming edge and have more than one outgoing edge. Root node is chosen by calculating information gain. After calculating information gain, the attribute which has achieved the greatest information gain is designated as root node. It is represented by oval. Example: In students’ dataset of educational data mining, the attribute 12th percentage has greatest information gain among attributes. So, it is represented in the form of root node.
b) Internal node: This is present in the middle which have an incoming edge and have more than one outgoing edges. c) Leaf node: This is the last node which is found at last part of tree. It represents the predicted class of dataset.
Testing is perform to check whether all the possible outcome instances belong to same class or different class. If all instances belong to the same class then node represents by using same name of class otherwise if all the instances belong to same class, the node is represented with single class name, otherwise splitting attribute is chosen for classifying the instances.[34] The classification algorithm for decision tree looks like:
i) Step 1: Node N is created by calculating information gain.
ii) Step 2: The condition when all tuples of partition belong to same class then node N is returning as leaf node and represent the class label.
iii) Step 3: The condition when there is no attribute present then node N is returning in the form of leaf node by using the label highest common class.
iv) Step 4: Find splitting attribute with the help of this partitions achieved at every branch are as clear as possible. v) Step 5: Label node N by using splitting criterion that works as test at that node.
vi) Step 6: If discrete value is achieved by using splitting attribute then remove this attribute from the set of attributes. vii) Step 7: Consider Ci be the partition created on the basis of outcome of ith outcome by using splitting criterion. viii) Step 8: Attach a leaf to node N with majority class in partition if Ci is void.
ix) Step 9: Otherwise implement the complete procedure on each partition recursively. x) Step 10: Return N.
2) Naive Bayes: Naive bayes is the most relied and used technique that follows the trend of predictions with probabilities intact. Bayes theorem gives independent assumptions that can prove some kind of information from huge datasets. Naive bayes can
outperform all the sophisticatedmethods of classification despite its simplicity. In this research work, naive bayes is performed using WEKA that is well known software given by University of Waikato, New Zealand. This classifier is built on the basis of bayes theorem. This model is very convenient to build. There is no involvement of complex iterative parameter estimation in this model that makes it beneficial to huge amount of datasets specially. Naive bayes solves the probabilistic model for each dataset having multiple issues, that gives almost 100% correctly classified instances. Bayes theorem gives a method to calculate the posterior probability, P(a|z) from P(a), P(z) and P(z|a).
Figure 1: Formula for calculating posterior probability
P(a|z): Posterior probability of target class P(a): Prior probability of class.
P(z|a): Likelihood that can be known as probability of predictor given class. P(z): Predictor’s prior probability.
©IJRASET: All Rights are Reserved
458
a) Class probability: The probability for each class in a dataset used for training. The class probability is the frequency ofinstances which belong to each class divided by the total number of instances. When we discuss about binary classification then the probability of an instance which belong to class 1 would be find as:
( = 1) = ( = 1)/( ( = 0) + ( = 1))
The results for a binary classification problem would be 0.5 where you have equal no. of instances. If the class values are pass and fail then the class probability for each class value can be evaluated as:
( = ) = ( = )/( ( = ) + ( = ))
( = ) = ( = )/( ( = ) + ( = ))
b) Conditional probability: The probability for each input given in an attribute with the class specified in a dataset. The conditional probability is the frequency of each attribute value for a given class value divided by the frequency of instances with that class value. For example, if the attributes mother’s qualification have values graduation and post-graduation and the class values are pass and fail then the conditional probability of each qualification value for each class value would be find as: P(mother’s qualification = graduation |class = pass) = count(instances with mother’s qualification = graduation and class = pass)/count(instances with class = pass)
P(mother’s qualification = graduation |class = fail) = count(instances with mother’s qualification = graduation and class = fail)/count(instances with class = fail)
P(mother’s qualification = post-graduation |class = pass) = count(instances with mother’s qualification = post- graduation and class = pass)/count(instances with class = pass)
P(mother’s qualification = post-graduation |class = pass) = count(instances with mother’s qualification = post-graduation and class = pass)/count(instances with Class = Pass)
3) Linear regression and SPSS: Linear regression is used when we have to check the effect of one or more independent variables (10th percentage, 12th percentage, etc.) on a dependent variable (final CGPA). Another name for dependent variable is outcome variable. Another name for independent variable is predictor variable. Hence, linear regression is used for forecasting or predicting the future values and determine the strength of predictor. It is an easy technique to perform prediction for large amount of dataset. Possible relationship between two variables can be identify on the basis of scatter plot. We can implement the linear regression by using statistical package for social sciences (SPSS). Now, SPSS is famous as statistical product and service solutions. The SPSS was proclaimed in 1968. This tool is used to analyse statistical data by business researcher, govt. officer, survey companies, physician and educational institutional researcher various organizations. Data documentation and data management are features of this tool. This software is statistics base. So, it includes descriptive statistics, ANOVA, Means, Correlation and perform prediction to numerical outcome. The linear regression performs with the help of SPSS generate following output:
a) Model Summary: The model summary contains R value is known as correlation coefficient value which show the degree of connectedness and the simple correlation between actual and predicted values. Ranges of R value is from +1 to -1. If the value of this correlation coefficient is 0 then there is no relationship exist between predicted and actual value and if this R value is closer to +1 then it is the indication of stronger relationship.
b) Coefficient table: This provides essential information to predict CGPA from (10th and 12th percentage) and abilities. It also determine whether percentage and abilities contribute statistically significant to model. Regression equation can be found as: R= P1Q1 + P2 Q2 + C
R= Dependent variable Q1= First independent variable Q2= Second independent variable P1, P2= Unstandardized coefficient C= Constant
Regression equation for predicted CGPA by using 10th and 12th percentage as independent variable can be represented as: CGPA = P1 (10th Percentage) + P2 (12th Percentage) + C
©IJRASET: All Rights are Reserved
459
IV.DATA COLLECTION AND REPRESENTATION
This section focus on data collection and representation:
A. Data collection
The dataset of pre-final year and final year students was collected by using google forms and the attributes along with the dataset and the possible values are further shared in the report. Table 1 gives the attributes discrepancy with the possible values initialized with a specific range given to it. It includes the personal details, secondary and higher secondary details with CGPA and including their daily activities by which we can possibly predict their future performance. The hobbies and the programming skills vary personally. So, it can’t be specified but we can classify and build it as parameter so as to predict the analysed behaviour of a particular student. A total of 206 students participated on this whole survey. 113 students of pre-final year and 93 students of final year, internal assessment and cumulative grade point average (CGPA) are used in dataset by most of researchers. The following table refers to type and the attributes that are selected for the research.
TABLE1
Attribute description and possible values
B. Pre-Processing (Attribute selection method)
©IJRASET: All Rights are Reserved
460
1) Attribute evaluator: The attribute subsets are assessed by this method. In this,”InfoGainAttributeEval” is used. It finds theimportance of an attribute by calculating the information gain in relation to class. The information gain is also known as entropy (degree of impurity) which can be calculated as: ( , ) = ( )− ( / )
2) Search method: The space of possible subset is searched by this method. In this “Ranker search method” is used. Figure 2 represents the rank of every attribute. The rank of every attribute lies between 0 and 1. If the value is 0 then attribute contribute not any information and if the value is 1 that means attribute contribute maximum information. The attributes which contribute maximum information gain value are selected while the attributes have minimum information gain value can be removed from the attribute list. After performing the attribute selection on our data, we can achieve the following benefits:
a) Training time: In this, we use ranker search method as attribute selection method. So, the attribute which get low rank or 0 rank can be remove. Hence, algorithms used for prediction train faster.
b) Improve accuracy: Attribute selection method removes the misleading data which improves the modelling accuracy. c) Reduces overfitting: It reduces the redundant data. So, there is no chance to make decision based on noise.
[image:7.612.165.419.239.440.2]
Figure 2: Student dataset
C. Data Representation
The following images would display the no of data imposed for every attribute.
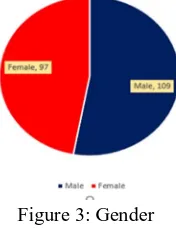
1) There are 109 male and 97 female, when the pre-final year and final year students pursue in graphical chart. Number of male is more than female.
Figure 3: Gender
[image:7.612.263.351.521.635.2]©IJRASET: All Rights are Reserved
461
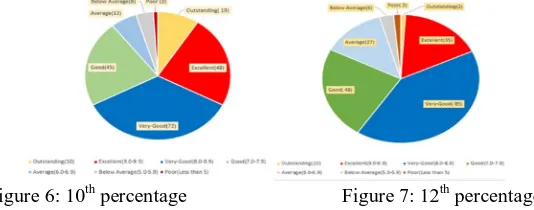
Figure 4: Father’s qualification Figure 5: Mother’s qualification [image:8.612.150.469.76.176.2]3) The dataset represents their past academic performances with their present CGPA evaluating their performances with their aggregate scores along with their grade points. The students are divided into 7 categories based on their present and past records: outstanding (10), excellent (9.0-9.9), very-good (8.0-8.9), good (7.0-7.9), average (6.0-6.9), below average (5.0-5.9), poor (Less than 5). Based on their secondary education, the dataset is divided in: outstanding (19), excellent (48), very-good (72), good (45), average (12), below average (8), poor (2). Based on their higher secondary education, the dataset is divided in: outstanding (2), excellent (35), very-good (85), good (48), average (27), below average (6), poor (3).
Figure 6: 10th percentage Figure 7: 12th percentage
[image:8.612.174.441.268.373.2]4) The current CGPA of students is divided in to 5 categories: excellent (9.0-10), very-good (8.0-8.9), good (7.0-7.9), average (6.0-6.9), poor (less than 6). Based on their CGPA, the dataset is divided in: excellent (2), very-good (33), good (85), average (64), poor (22).
Figure 8: CGPA
[image:8.612.184.431.601.716.2]5) There are three question asked to mention them in hours to focus on their daily work routine. Those are as follows: Hours spend by students on studies in a day? Hours spend by students on social media in a day? Hours spend by students on sleeping in a day? The result specify that most of the students spent (1-4)hours on studying and (4-8)hours on social media per day. Hence, the students are quite more addictive to social network.
©IJRASET: All Rights are Reserved
462
6) The histogram here represents their abilities which is given to them to rate themselves in order of 1-5.There are five things to [image:9.612.203.415.121.262.2]rate: self-study ability, programming knowledge, group working ability, writing speed, English fluency. The students are quite sure about their english fluency while most of the students have good programming knowledge.
Figure 10: Student’s abilities
V. IMPLEMENTATION AND RESULTS
A. Data Classification By Using Naïve Bayes And Decision Tree
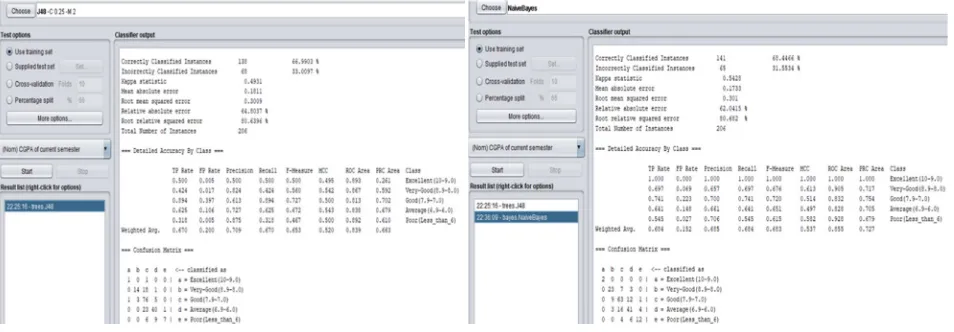
[image:9.612.70.547.348.514.2]The WEKA results are found by using two classification methods i.e. decision tree (J48) and naïve bayes. Firstly, the whole was pre-processed after various transformations, the final dataset was already discussed. The data was firstly trained and the naïve bayes classifier and J48 were implemented on trained the data set, which gave following results.
Figure 11: Decision tree apply on training set Figure 12: Naïve Bayes apply on training set
TABLE2
Results obtained on using training set Methods Results
J48 Decision Tree Algorithm 66.99%
Naïve Bayes Algorithm 68.44%
©IJRASET: All Rights are Reserved
463
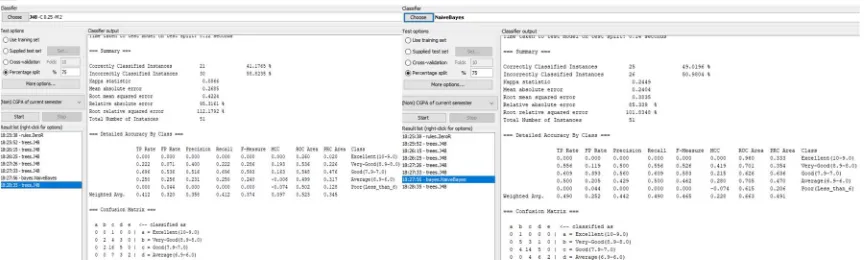
Figure 13: Decision tree apply on testing Set Figure 14: Naïve Bayes apply on testing Set
TABLE3
Results obtained on using 25% data as testing set
Methods Results Total No. of instances J48 Decision Tree Algorithm 41.17% 51
Naïve Bayes Algorithm 49.01% 51
[image:10.612.197.415.357.470.2]Now, we apply the full testing set and compare the result of actual and predicted CGPA. The outcome of decision tree after applying full testing set are as follow:
[image:10.612.90.524.508.628.2]Figure 15: Decision tree after using test set
Figure 16: Compare the actual and predicted CGPA after Figure 17: Compare the actual and predicted CGPA after applying J48 decision tree Algorithm applying naïve bayes Algorithm.
Now, we calculate the efficiency for naïve bayes and decision tree classifier. The efficiency for both classifier can be calculated as: Efficiency = {100-[(Actual CGPA-Predicted CGPA)/Actual CGPA]*100}
With the help of above formula, we can calculate the efficiency for every grade. The overall efficiency of predicted CGPA is calculated by finding the simple average of all efficiency.
©IJRASET: All Rights are Reserved
464
1) Overall efficiency for decision tree: Overall efficiency, E1 = (100+51.51+54.12+85.94+36.36)/5= 65.58%
Hence, overall efficiency of predicted CGPA by using J48 decision tree algorithm is 65.58%
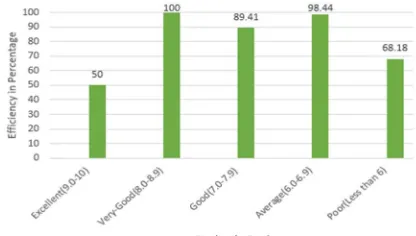
2) Overall efficiency for naïve bayes classifier: Overall efficiency, E2 = (50+100+89.41+98.44+68.18)/5 = 81.21%
Hence, overall efficiency of predicted CGPA by using naïve bayes algorithm is 81.21%.
Graphs given in Figure 18 and Figure 19 represent the efficiency of predicted CGPA by using J48 decision tree algorithm and naïve bayes algorithm:
[image:11.612.315.523.183.301.2] [image:11.612.89.283.183.310.2]
Figure 18: Efficiency of predicted CGPA Figure 19: Efficiency of predicted CGPA
TABLE4
Results obtained on using testing set Methods Results J48 Decision Tree Algorithm 65.58% Naïve Bayes Algorithm 81.21%
Table 4 represents the result obtained for decision tree and naive bayes in WEKA after using test set. The accuracy achieved by naïve bayes is more than J48 decision tree. Hence, naïve bayes showed the best result for the dataset.
B. Linear Regression Using SPSS
Lately, linear regression was applied on the dataset using SPSS (statistical package for social sciences).
[image:11.612.148.463.480.712.2] [image:11.612.149.465.480.708.2]©IJRASET: All Rights are Reserved
465
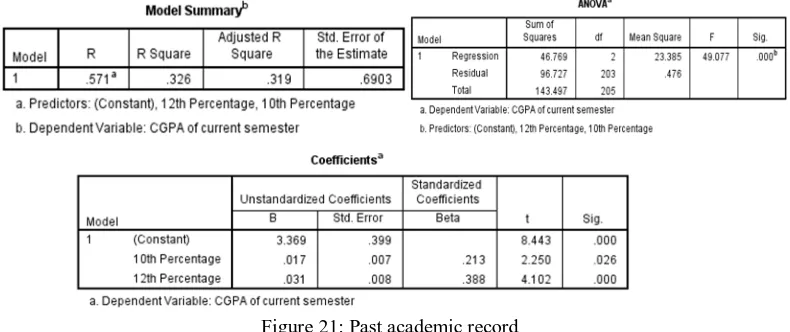
1) Linear regression using SPSS -Past Records: The results for linear regression performed in SPSS are as follow: The figureshere represent the past records as independent variable i.e. 10th and 12th percentage and the dependent variable as CGPA of current semester.
[image:12.612.111.506.119.285.2]
Figure 21: Past academic record
Hence, the correlation coefficient is R=.571 with mean square residual 0.476. With the help of table represented in Figure 21, we can calculate the predicted CGPA and find the regression equation is as follow:
[image:12.612.92.554.306.484.2]Regression equation: CGPA = 3.369 + (0.017*10th percentage) + (0.031*12th percentage)
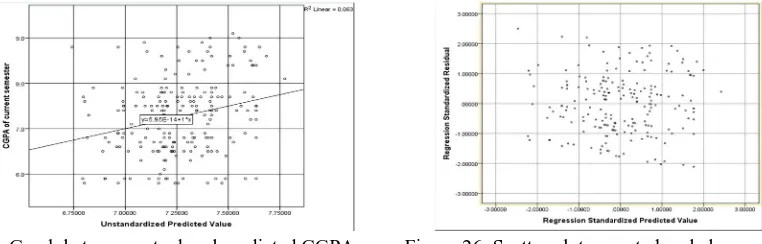
Figure 22 and Figure 23 represent the graph plot for actual and predicted CGPA for current semester using independent variable as their 10th and 12th percentage. The scatter plot represents the expected and observed residual plot.
Figure 22: Graph between actual and predicted CGPA Figure 23: Scatter plot expected and observed residual
2) Linear Regression using SPSS: Abilities: Linear regression as stated follow the dependent variable as CGPA in this case with independent variable as Self study ability, Group working ability, Programming Knowledge, English Fluency.
[image:12.612.41.561.480.723.2]
©IJRASET: All Rights are Reserved
466
Hence, the correlation coefficient is R = 0.252 with mean square residual 0.672. With the help of table represented in Figure 24, we can calculate the predicted CGPA and find the regression equation is as follow:Regression equation: CGPA=7.858 + [(-0.083)*(self study ability)] + [(-0.027)*(Programming knowledge)] + [(0.096)*(Group working ability)] + [(-0.019)*(writing speed)] + [(-0.189) * (English Fluency)]
Figure 25 and Figure 26 represent the graph plot for actual and predicted CGPA for current semester using independent variable as self study ability, group working ability, programming knowledge, english fluency. The scatter plot represents the expected and observed residual plot.
[image:13.612.116.497.169.291.2]
Figure 25: Graph between actual and predicted CGPA Figure 26: Scatter plot expected and observed residual
TABLE5 Comparison of coefficient of correlation R-value Residual Past academic record 0.571 0.476 Abilities 0.252 0.672
As we know that R ranges lies between +1 to -1. When R-value is close to +1 then it shows a strong relation between variables. Reading from Table 5, R-value = 0.571, we can say that relationship exists between the values of past academic record and CGPA is moderate strong. It indicates that student with lower past academic record have lower CGPA and vice versa.
VI.CONCLUSION
After implementing the prediction algorithms on WEKA and SPSS for linear regression for the models and the graphs plotted and discussed before. It implies that the students’ performance prediction has been carried out successfully and results state that naïve bayes and decision tree gave the best result for the proposed research work. Therefore, the multiple classification algorithms and techniques implemented on datasets results in predictive models that can be applied on students with lower grades to enhance their performance. Weka worked wonderfully on both classifiers to achieve 80% results. The platform and datasets may vary accordingly, along with results. The study and analysis provided details of the possible factors which impacts on performance of the students and the particular attributes which is considered to be the most dependent criteria on the basis of their personal and social datasets with their psychological interventions included. The specified test sets, intervened and gave 81.21% results in working with naïve bayes classifier on student dataset. J48 was no bad, it results 65.58% on dataset. The SPSS regression models that appears for the past record marked as highest correlation coefficient R = 0.571 with mean square residual 0.476. Hence, linear regression didn’t perform that well but clearly the dataset can be modified according to give its best result for the regression models.
VII. ACKNOWLEDGMENT
The authors of this research paper thankful to the faculty of MITS, Gwalior for providing the datasets of students.
REFERENCES
[1] Arsad, P. M., Buniyamin, N., & Manan, J. A., “Prediction of engineering students academic performance using artificial neural network and linear regression: A comparison”, IEEE 5th conference on Engineering Education(ICEED), pp. 43-48, 2013.
[2] Berhanu, F., & Abera, A.,“ Students’ Performance Prediction based on their Academic Record”, International Journal of Computer Applications,vol.131(5), pp. 27-35, 2015.
[3] Buniyamin, N., Mat, U. bin, & Arshad, P. M., “Educational data mining for prediction and classification of engineering students achievement” IEEE 7th International Conference on Engineering Education (ICEED), pp. 49-53, 2015.
©IJRASET: All Rights are Reserved
467
[5] Devasia, T., Vinushree T P, & Hegde, V., “Prediction of students performance using Educational Data Mining”, International Conference on Data Mining andAdvanced Computing (SAPIENCE), pp. 91-95, 2016.
[6] Amjad Abu Saa, “ Educational data mining & students performance prediction. International journal of advanced computer science & application” vol.7(5), pp.212- 220, 2016
[7] Amirah Mohamed Shahiri, Wahidah Husain, et al., “A review on predicting student's performance using data mining techniques”, Procedia computer Science vol.72 pp. 414-422, 2015
[8] Thi-Oanh Tran, Hai-Trieu Dang, Viet-Thuong Dinh, Xuan-Hieu Phan, et al, “Performance prediction for students: A multi strategy approach” Cybernatics and Information Technologies, vol.17(2) ,164-182, 2017.
[9] Rui Wang, Fanglin Chen, Zhenyu Chen, Tianxing Li, Gabriella Harari, Stefanie Tignor, Xia Zhou, Dror BenZeev, and Andrew T Campbell, “Student life: Using smartphones to assess mental health and academic performance of college students”, In Mobile Health, pp 7-33, Springer, 2017.
[10] Surjeet Kumar Yadav and Saurabh Pal., “ Data mining: A prediction for performance improvement of engineering students using classification”, world of computer science and information technology(WCSIT) vol.2 pp. 51-56, 2012).
[11] U. bin Mat, N. Buniyamin, P. M. Arsad, R. Kassim, “ An overview of using academic analytics to predict and improve students’ achievement: A proposed proactive intelligent intervention”,IEEE 5th Conference on Engineering Education (ICEED), pp. 126–130, 2013.
[12] Z. Ibrahim, D. Rusli, Predicting students academic performance: comparing artificial neural network, decision tree and linear regression, in: 21st Annual SAS Malaysia Forum, 5th September, 2007.
[13] D. M. D. Angeline, “Association rule generation for student performance analysis using apriori algorithm”, The SIJ Transactions on Computer Science Engineering & it Applications, pp.12–16,2013.
[14] M. Mayilvaganan, D. Kalpanadevi, “Comparison of classification techniques for predicting the performance of students academic environment”, IEEE International Conference on Communication and Network Technologies (ICCNT), pp. 113-118, 2014.
[15] S. Natek, M. Zwilling, “Student data mining solution–knowledge management system related to higher education institutions”, Expert systems with applications vol.41 (14 , 2014.
[16] T. M. Christian, M. Ayub, “Exploration of classification using nbtree for predicting students’ performance”,IEEE International Conference on Data and Software Engineering (ICODSE), pp. 1–6, 2014.
[17] S. Parack, Z. Zahid, F. Merchant, “Application of data mining in educational databases for predicting academic trends and patterns”, IEEE International Conference on Technology Enhanced Education (ICTEE), pp.1–4, 2012.
[18] G. Elakia, N. J. Aarthi, , Elakia et al., “Application of data mining in educational database for predicting behavioural patterns of the students”, International Journal of Computer Science and Information Technologies(IJCSIT), vol.5 (3), 2014.
[19] D. M. S.Anupama Kumar, “Appraising the significance of self regulated learning in higher education using neural networks”, International Journal of Engineering Research and Development,Vol.1 (Issue 1), pp.09–15, 2012.
[20] B. K. P. Conrad Tucker, A. Divinsky, “Mining student-generated textual data in moocs and quantifying their effects on student performance and learning outcomes”, ASEE Annual Conference, Indianapolis, Indiana, 2014,
[21] V. Oladokun, A. Adebanjo, O. Charles-Owaba, “Predicting students academic performance using artificial neural network: A case study of an engineering course”, The Pacific Journal of Science and Technology, vol. 9 (1), pp. 72-79, 2008.
[22] V. Ramesh, P. Parkavi, K. Ramar, “Predicting student performance: a statistical and data mining approach”, International Journal of Computer Applications, vol.63 (8) pp. 35-39, 2013.
[23] A. Bogar´ın, C. Romero, R. Cerezo, M. Sanchez-Santill, “ Clustering for improving educational process mining”, Proceedings of the Fourth International Conference on Learning Analytics And Knowledge, ACM, pp. 11–15, 2014.
[24] C. Coffrin, L. Corrin, P. de Barba, G. Kennedy, “Visualizing patterns of student engagement and performance in moocs”, Proceedings of the fourth international conference on learning analytics and knowledge, ACM, pp. 83–92, 2014.
[25] K. Bunkar, U. K. Singh, B. Pandya, R. Bunkar, “Data mining: Prediction for performance improvement of graduate students using classification”, IEEE Ninth International Conference on Wireless and Optical Communications Networks (WOCN), pp.1–5, 2012.
[26] S. S. Meit, N. J. Borges, B. A. Cubic, H. R. Seibel, “Personality differences in incoming male and female medical students”, Online Submission. [27] A. Simsek, J. Balaban, Learning strategies of successful and unsuccessful university students., Online Submission 1 (1) (2010) 36–45.
[28] T. Mishra, D. Kumar, S. Gupta, “Mining students’ data for prediction performance”, IEEE Computer Society , fourth International Conference on Advanced Computing & Communication Technologies(ACCT), vol.14, pp. 255–262, 2014.
[29] C. Romero, M.-I. Lopez, J.-M. Luna, S. Ventura, “Predicting students’ final performance from participation in on-line discussion forums”, Computers & Education, vol.68, pp. 458-472, 2013.
[30] S. Sembiring, M. Zarlis, D. Hartama, S. Ramliana, E. Wani, “Prediction of student academic performance by an application of data mining techniques”, International Conference on Management and Artificial Intelligence IPEDR, Vol. 6, pp. 110–114, 2011.
[31] G. Gray, C. McGuinness, P. Owende, “An application of classification models to predict learner progression in tertiary education”, IEEE International Advance Computing Conference (IACC), pp. 549–554, 2014,.
[32] I. Hidayah, A. E. Permanasari, N. Ratwastuti, “Student classification for academic performance prediction using neuro fuzzy in a conventional classroom”, IEEE, International Conference on Information Technology and Electrical Engineering (ICITEE), pp. 221–225, 2013.
[33] Jacob, J., Jha, K., Kotak, P., & Puthran, S., “Educational Data Mining techniques and their applications”, International Conference on Green Computing and Internet of Things (ICGCIoT), pp. 1344-1348, 2015.
[34] S.D. Pandya, P.V. Virparia, “ Comparing the Application of Classification and Association Rule Mining Techniques of Data Mining in an Indian University to Uncover Hidden Pattterns”, International Conference on intelligent systems and Signal Processing(ISSP), pp.361-364, 2013