© 2017, IRJET | Impact Factor value: 5.181 | ISO 9001:2008 Certified Journal
| Page 1248
EDUCATIONAL DATA MINING & STUDENTS PERFORMANCE
PREDICTION USING SVM TECHNIQUES
*1
Mrs.M.Jamuna.,
*
2Mrs. S.A.Shoba.,
*1
.M.Phil Research Scholar, PG & Research Department of Computer Science & Information Technology Arcot Sri
Mahalakshmi Women’s College, Villapakkam, Tamil Nadu, India
*2
. Head of the Department, PG & Research Department of Computer Science & Information Technology Arcot Sri
Mahalakshmi Women’s College, Villapakkam, Tamil Nadu, India
---***---Abstract: The educational data mining is emerging fieldthat focuses on analyzing educational data to develop models for improving learning experiences and improving institutional effectiveness. Increasing interest in data mining and educational systems, make educational data mining as a new growing research community. Educational Data Mining means to extract the hidden knowledge from large educational databases with the use of techniques and tools. Educational Data Mining develops new methods to discover knowledge from educational database and it is used for decision making in educational system. In this paper we focus on comparative analysis of various educational data mining techniques with their algorithms. We compare the accuracy of these techniques with their algorithms on weka tool. The compared techniques and algorithms are presented together with some experimental data that give rise to the final conclusion.
Keywords:
Educational Data mining, SVM, Machine learning Programming, Prediction Dataset, Elearning processI. INTRODUCTION
Higher education has gained importance manifolds in the past few decades. The higher educational institutes are forced to revise its scope and objects because of the private participation. The controller of regulatory body has put some guidelines with regard to infrastructure, faculty and other resources. New technologies are being developed in the field of data management and analysis due to large supply of data being present in several companies, including both private and public. The main aim of the techniques of data mining is to discover hidden and insignificant links within the information having diverse characteristics. Various techniques of data mining are being used in different fields including the educational environment. A very encouraging area to attain this objective is the usage of Data Mining (DM). In fact, classification is one of the most helpful DM work in e-learning.
Data mining has been executed well in the business applications, but its use in higher education and
higher learning institutions is still relatively new. In the sector of education, educational data mining proves to be an emerging practice which is very recent and its practice is preconceived to identify and extract new and valuable knowledge from the data. The aim is to resolve problems of research areas of education and improve the whole educational process using various statistical techniques, machine learning programming (MLP) and data mining algorithms. Educational data Mining (EDM) is a prospering practice that can be used for analytics and visualization of data, prediction of student performance, student modelling, grouping of students etc.
Fig1.1: Educational data mining cycle
© 2017, IRJET | Impact Factor value: 5.181 | ISO 9001:2008 Certified Journal
| Page 1249
Performance of the students is calculated so thatthe results can be improved and the future of the student is secured. Therefore, it is very necessary that the marks or grades in each semester be taken into consideration so that the student considers each subject of equal importance. Our research work proposes an effective methodology for measuring the student's overall performance by using the grades of each semester. Different results of the classification algorithms of data mining are analyzed and final outcome is made based on the accuracy of the model.
1.1 Educational Data Mining Methods
EDM not apply only data mining techniques Classification, clustering, and association analysis, but also apply methods and techniques drawn from the variety of areas related to EDM (statistics, machine learning, text mining, web log analysis, etc.). There are so many methods of educational data mining but all kind of methods lie in one of following categories:
1) Prediction: The goal is to develop a model which
can infer a single aspect of the data (predicted variable) from some combination of other aspects of the data (predictor variables). Types of predictions methods are classification, regression (when the predicted variable is a continuous value), or density estimation (when the predicted value is a probability density function).
2) Regression: Regression is an inherently statistical
technique used regularly in data mining. Regression analysis establishes a relationship between a dependent or outcome variable and a set of predictors. Regression is supervised learning data mining technique. Supervised learning partitions the database into training and validation data. There are two type of regression technique.
II. RELATED WORK
Data Mining is very useful in the field of education especially when examining behavior in online learning environment. Knowledge discovery in database (KDD) is known for its powerful role in uncovering hidden information from large volumes of data. The first review was concerned on the application of data mining techniques in educational system from the year 2000 until 2010. The systems reviewed have diverse data source and objectives for knowledge discovering. Another review was about applying data mining techniques to e-learning problems. It can be encountered by integrating the Google Analytics tool into the blog environment and the log data can be exported later for further analysis using the data mining techniques. SitiKhadijahMohamad, ZaidatunTasir, 2015 [1]. The dataset of student academic records is
tested and applied on various classification algorithms such as Multilayer Perception, Naïve Bayes, SMO, J48 and REP Tree. New factors can be applied to improve the student’s performance, learning and retention capabilities among them. It was reported that DT and NN algorithms had the predictive accuracy of 93% and 91% for two-class dataset (pass/fail) respectively. It was also reported that both DT and NN algorithms had the predictive accuracy of 72% for a four-class dataset. ParneetKaur, Manpreet Singh, Gurpreet Singh Josan, [2].
Educational data mining is used to identify and enhance educational process which can improve their decision making process. To identify those students which needed special attention to reduce failing ration and taking appropriate action at right time? Providing higher education to all sectors of a nation’s population means confronting social inequalities deeply rooted in history, culture and economic structure that influence an individual’s ability to compete. Umesh Kumar Pandey S. Pal, 2011 [3]. This study explores multiple factors theoretically assumed to affect students’ performance in higher education, and finds a qualitative model which best classifies and predicts the students’ performance based on related personal and social factors. Multiple data mining tasks were used to create qualitative predictive models which were efficiently and effectively able to predict the students’ grades from a collected training dataset. Study can motivate and help universities to perform data mining tasks on their students’ data regularly to find out interesting results and patterns which can help both the university as well as the students in many ways. Amjad Abu Saa. Surveys the most relevant studies carried out in this field to date. Firstly, it introduces EDM and describes the different groups of user, types of educational environments and the data they provide. E-learning and Learning Management System (LMS). E-learning provides online instruction and LMS also provides communication, collaboration, administration and reporting tools. Web Mining (WM) techniques have been applied to student data stored by these systems in log files and databases. Cristobal Romero.
III. PREVIOUS IMPLEMENTATIONS
1. Massive Open Online Courses
© 2017, IRJET | Impact Factor value: 5.181 | ISO 9001:2008 Certified Journal
| Page 1250
2. Learning Management SystemsLearning Management Systems (LMS) are one of the very special types of Web-based educational platform that offers a wide variety of channels and workspaces to facilitate communication and sharing of information. LMS accumulate large logging data in accordance with student's activities and generally have built-in tracking tools for students that allow the instructor to view statistical data.
3. Intelligent Tutoring Systems
Intelligent Tutoring Systems (ITS) are those systems that provide direct customized instruction or feedback to students. An ITS generates models of student behavior and changes its mode of interaction with each student based on its individual model. ITSs record all student-teacher interaction in log files or databases.
4. Adaptive and Intelligent Hypermedia Systems
Adaptive and Intelligent Hypermedia Systems (AIHS) is one of the special kind of adaptive hypermedia in the development of educational course that is an alternative to the traditional 'just-put-it-on-the-web' approach. AIHs store data regarding student models, domain models and interaction log files.
5. Test and Quiz Systems
Exams and quizzes are one of the most widely used and well-developed tools in the field of education. A test consists of a series of questions for the purpose of collecting information from receivers. The purpose of these systems is to measure the depth of knowledge of the students with respect to concepts and subjects. Test systems store information about questions, student's answers and measured scores
Types of data
Relational data
Transactional data
Temporal, sequence and time series data
Text data
Multimedia data
World Wide Web data
Data mining Technical
Relational data mining
Classification, clustering, association rule mining
etc.
Sequential data mining
Text mining
Multimedia data mining
Web content/structure/usage mining
2. OBJECTIVES OF EDUCATIONAL DATA MINING (EDM)
1. Educational Data
Decision-making in the field of academic planning involves extensive analysis of huge volumes of educational data. Data are generated from heterogeneous sources like diverse and distributed, structured and unstructured data. These data are mostly generated from the offline or online sources:
Offline Data
Offline Data are generated from traditional and
modern classroom, Interactive teaching/learning
[image:3.595.319.555.623.745.2]environments, learner/educators information, students attendance, Emotional data, Course information, data collected from the academic section of an institution etc..
Fig 2.1: offline data Analysis Online Data
Online Data are generated from the
geographically separated stake holder of the education, distance educations, web based education and computer supported collaborative learning used in social networking sites and online group forum.
E.g.: Web logs, E-mail, Spreadsheets, and Tran scripted Telephonic Conversations, Medical records, Legal Information, Corporate contracts, Text data, publication databases etc.
© 2017, IRJET | Impact Factor value: 5.181 | ISO 9001:2008 Certified Journal
| Page 1251
Phases of Educational Data MiningEducational Data Mining is concerned with translation of new hidden information from the raw data collected from educational systems. EDM generally consist of following phases:
The data is collected which is to be mined from different educational system resources i.e. from course management system (different institutes), E-learning environment, web based data (i.e. YouTube, twitter)which is relevant to students activities during learning process(i.e. their academic grades, students posts on social networking sites etc).
IV. PROPOSED ANALYSIS
The first and foremost step is to collect the dataset required for the study. The methodology is applied to a factual data having information about the students who did their graduation in Computer Science and Engineering at Thapar University, Patiala, Punjab (India).
Fig4.1: Workflow of study
Bayesian network
Bayesian network is a graphical model that depicts the probabilistic relation among the various attributes or instances [48]. The variables and their conditional dependencies are represented through directed acyclic graph (DAG). The nodes in the graph represent the random variable and the edges are the conditional dependencies.
Algorithm Implementation
Step1: Designate an optimal hyperplane to maximize the margin
Step2: Widen the above definition for non-linearly separable problems
Step3: Map the data to high dimensional space where it is simple to classify with linear decision and reformulate problem so that data is mapped completely to this space.
SVM kernels: 1.Linear:
If the two classes are separated by a straight line, then those classes are known as linearly separable. The line can be separated by two critical members that define the channel, one for each class. These critical points are known as support vectors. Linear SVM scales linearly with the size of the training data set.
K (x, x') =<x, x’> (1)
2. Sigmoid
Sigmoidal kernels are the hyperbolic functions. The origin of this kernel is from neural networks. The sigmoidal kernel is of the form:
K (x, x') =tanh(r(x,x’)+r) (2)
3. Polynomial
Polynomial kernel in SVM represents the resemblance of vectors containing training samples in a feature space over polynomials of the original variables, therefore allowing learning of non-linear SVM models. Polynomial kernel is quite useful in natural language processing but suffers from numerical instability. The polynomial kernel is of the form:
K (x, x') = (r<x,x’>+r)d (3)
If d=1, it is a linear kernel where'd' is the degree and (x, x') are the input vectors. If d=2, it is a quadratic kernel.
4. Radial Basis Function
The radial basis function is used to find set weights for a curve fitting problem. The learning helps to find out the surface in high dimensional space which provides best fit to the training data. The hidden layers supports a set of functions that comprises an arbitrary basis for input basis, such functions are known as radial basis functions. The RBF kernel is of the form:
K (x, x')=exp(-r|x-x’|2) (4)
Where,y = l/2a2, G is a free parameter |x-x'| is the Euclidean distance.
4.1 Predictive Analytics in Higher Education
© 2017, IRJET | Impact Factor value: 5.181 | ISO 9001:2008 Certified Journal
| Page 1252
C4.5-A2, and C4.5-A1. After that the C5.0 algorithm iscomes out to be best algorithm in accuracy. Then its result is compared with NN (Neural Network) and CRT [13].
4.2 Mining Social Media Data for Understanding Student Learning Experiences
In this paper suggested how social media sites data is helpful in Understanding student learning experience. They collected data about student's problems from twitter. They also developed a workflow to integrate both qualitative analysis and large-scale data mining techniques. They focused on engineering student's twitter posts to understand issues and problems in their educational experiences. They used Naive Bayes Multi-Label Classifiers for tweets classification then after that they compare the result of Naive Bayes Multi-Label Classifiers with the most used and accurate classifier used in many machine learning tasks i.e. Super Vector Machine (SVM) and Max margin Multi Label Classifier [1].
V. EXPERIMENTAL RESULT
The data for the model was collected for four semesters of Computer Science Engineering students, batch 2010-14 studying in Thapar University, Patiala. After eliminating the incomplete and unwanted data, the sample comprised 126 students having 'j' subjects. There are six subjects in first two semesters and seven subjects in semester 3 and 4.So,for semester1 and semester 2, j=6 and for semester 3 and semester 4, j=7. Total number of records Y=i S j * N Total number of records for each student R’= Here, 'i' is the number of semesters. 'Sj' is the number of subjects corresponding to ith semester and 'N' is the total number of students. So, for 126 students there are 6*126 + 6*126 + 7*126 + 7*126 = 3276 data records. Each student is associated with 6+6+7+7=26 records. The outcome of each model is the student's predicted final result, which is then compared with our manual predicted performance result. The comparison of the performance results are analysed in terms of their accuracy and comprehensibility.
The three algorithms and their implementation using IBM SPSS Modeler are illustrated in the figures. There are four inputs: OVERALLGRADE(1) i.e. overallGrade of first semester, OVERALLGRADE (2), OVERALLGRADE (3) and OVERALLGRADE (4) and the target being OVERALLGRADE (F).The type of all the input and output fields is nominal. Represents the implementation of four kernels of SVM: RBF (Radial Basis Function), polynomial, sigmoid and linear. Each kernel elucidates the predictors in a different way so the output is taken in the form of tables. Shows how the decision tree algorithm, C5.0 is implemented and displays the rule set generated for overall performance using grades obtained
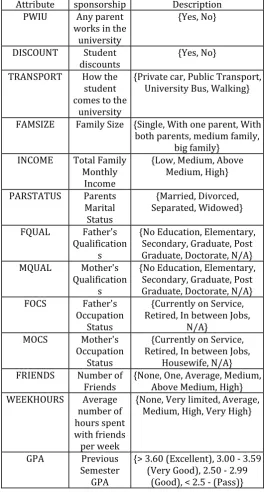
Attribute sponsorship Description
PWIU Any parent
works in the university
{Yes, No}
DISCOUNT Student
discounts {Yes, No}
TRANSPORT How the
student comes to the
university
{Private car, Public Transport, University Bus, Walking}
FAMSIZE Family Size {Single, With one parent, With
both parents, medium family, big family}
INCOME Total Family
Monthly Income
{Low, Medium, Above Medium, High}
PARSTATUS Parents
Marital Status
{Married, Divorced, Separated, Widowed}
FQUAL Father's
Qualification s
{No Education, Elementary, Secondary, Graduate, Post Graduate, Doctorate, N/A}
MQUAL Mother's
Qualification s
{No Education, Elementary, Secondary, Graduate, Post Graduate, Doctorate, N/A}
FOCS Father's
Occupation Status
{Currently on Service, Retired, In between Jobs,
N/A}
MOCS Mother's
Occupation Status
{Currently on Service, Retired, In between Jobs,
Housewife, N/A}
FRIENDS Number of
Friends {None, One, Average, Medium, Above Medium, High}
WEEKHOURS Average
number of hours spent with friends per week
{None, Very limited, Average, Medium, High, Very High}
GPA Previous
Semester GPA
{> 3.60 (Excellent), 3.00 - 3.59 (Very Good), 2.50 - 2.99
[image:5.595.307.572.102.595.2](Good), < 2.5 - (Pass)}
Table 1.1: Attributes Description and Possible
© 2017, IRJET | Impact Factor value: 5.181 | ISO 9001:2008 Certified Journal
| Page 1253
Attribute RangeGPA Very Good (81), Good (68), Pass (61),
Excellent (60)
GENDER Female (174), Male (96)
STATUS Freshman (109), Sophomore (62),
Junior (53), Senior (37)
NATCAT Arab (180), Other (34), Gulf (29), Local
(23), Non-Arab (4)
FLANG Arabic (233), Other (18), Hindi-Urdu
(16), English (3)
TEACHLANG English (248), Arabic (20)
LOC Ajman (123), Shaijah (90), Dubai (18),
University Hostel (13), RAK (11), UAQ (10), Abu Dhabi (3), Fujairah (1),
Al-Ain (1)
TRANSPORT Car (175), University Bus (54), Walking (21), Public Transport (20)
HSP Excellent (100), Very Good (High) (63),
Very Good (50),
Good (High) (33), Good (19), Pass (High) (4), Pass (1)
PWIU No (262), Yes (8)
DISCOUNT No (186), Yes (84)
SPON No (210), Yes (60)
FRIENDS Average (81), High (75), Medium (67),
Above Medium (27), One (13), None (7)
WEEKHOURS Average (122), Very limited (57),
Medium (40), High (21), Very High (16), None (14)
FAMSIZE Big (232), Medium (28), With both
parents (6), With Two Parents (1), Single (1)
INCOME Medium (83), Low (70), Above Medium
(54), High (27)
PARSTATUS Married (243), Widowed (17),
Separated (6), Divorced (4)
FQUAL Graduate (144), Post Graduate (41),
Secondary (37), Doctorate (20), Elementary (11), N/A (10), No
Education (7)
MQUAL Graduate (140), Secondary (60), Post
Graduate (25), No Education (16), Elementary (11), Doctorate (9), N/A (8)
FOCS Service (166), N/A (42), Retired (32), In
Between Jobs (30)
MOCS Housewife (162), Service (65), N/A (22),
In Between Jobs (11), Retired (10)
Table1.2:Ranges of Data in the Dataset
In order to understand the dataset in hand, it must be explored in a statistical manner, as well as, visualize it using graphical plots and diagrams. This step in data mining is essential because it allows the researchers as well as the readers to understand the data before
jumping into applying more complex data mining tasks and algorithms.
There are multiple different classification methods and techniques used in Knowledge Discovery and data mining. Every method or technique has its advantages and disadvantages. Thus, this paper uses multiple classification methods to confirm and verify the results with multiple
Evaluation
Criteria Correctly classified
instances
Wrongly classified instances
Prediction accuracy
RBF 123 3 97.62%
Polynomial 123 3 97.62%
Sigmoid 80 46 63.49%
[image:6.595.306.545.339.491.2]Linear 120 6 95.24%
Table 1.3: Comparison of different kernels of SVM Model
Fig5.1: Graphical representation of correctly classified instances
[image:6.595.314.555.600.730.2]A report based on the confidence values is shown in. All the four kernels of SVM and C5.0 and Bayesian Network values are observed based on their predicted values, as generated by the respective models. Shows graphically the mean correct and mean incorrect values.
© 2017, IRJET | Impact Factor value: 5.181 | ISO 9001:2008 Certified Journal
| Page 1254
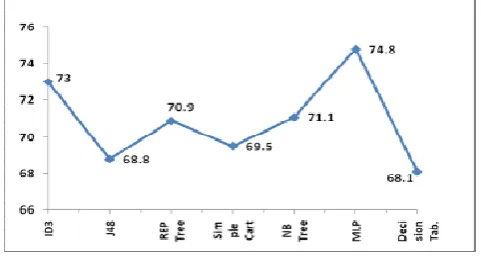
Shows the prediction accuracy of various data miningalgorithms. The results show that MLP, a neural network based classification show best result of 74.8% accurate prediction which is followed by ID3 showing an accuracy of 73%. NBTree and REPTree classification tree based algorithms show an accuracy of around 71% and other Classification algorithms of J48, Simple Cart and Decision Table show a prediction accuracy of 68.8%, 69.5% and 68.1% respectively.
Conclusion
The results achieved by applying selected data mining algorithms for classification on the university sample data reveal that the prediction rates are not remarkable (vary between 52-67 %). Moreover, the classifiers perform differently for the five classes. The data attributes related to the students’ University Admission Score and Number of Failures at the first-year university exams are among the factors influencing most the classification process. The results from the performed study are actually the initial steps in the realization of an applied data mining project at UNWE. The conclusions made from the conducted research will be used for defining the further steps and directions for the university data mining project implementation, including possible transformations of the dataset, tuning the classification algorithms’ parameters, etc., in order to achieve more accurate results and to extract more important knowledge from the available data. Recommendations will also be provided to the university management, concerning the sufficiency and availability of university data and related to the improvement of the data collection process.
References
[1] Baradwaj, B.K. and Pal, S., 2011. Mining Educational Data to Analyze Students' Performance. (IJACSA) International Journal of Advanced Computer Science and Applications, Vol. 2, No. 6, 2011.
[2] Ahmed, A.B.E.D. and Elaraby, I.S., 2014. Data Mining: A
prediction for Student's Performance Using
Classification Method. World Journal of Computer Application and Technology, 2(2), pp.43-47.
[3] Pandey, U.K. and Pal, S., 2011. Data Mining: A prediction of performer or underperformer using classification. (IJCSIT) International Journal of Computer Science and Information Technologies, Vol. 2 (2), 2011, 686690.
[4] Bhardwaj, B.K. and Pal, S., 2012. Data Mining: A prediction for performance improvement using classification. (IJCSIS) International Journal of Computer Science and Information Security, Vol. 9, No. 4,
April 2011.
[5] Yadav, S.K., Bharadwaj, B. and Pal, S., 2012. Data Mining Applications: A Comparative Study for Predicting
Student's Performance. International Journal of Innovative Technology & Creative Engineering (ISSN: 2045-711), Vol. 1, No.12, December.
[6] Yadav, S.K. and Pal, S., 2012. Data mining: A prediction for performance improvement of engineering students using classification. World of Computer Science and Information Technol
[7] Brijesh Kumar Baradwaj&Saurabh Pal, IJACSA, Vol.2, No.6,2011,”Mining Educational Data to Analyze Students’ Performance”
[8] Cesar V., Javier B., liela S., & Alvaro O., Recommendation in Higher Education Using Data Mining Techniques, In Proceedings of the Educational Data Mining Conference, 2009.
[9] Cristobal Romero & Sebastian Ventura, “Educational Data Mining: A Review of the State of the Art,” IEEE Transactions on Systems, Man, and Cybernetics—Part c: Applications and Reviews, vol. 40, no. 6, 2010, pp. 601-618.
[10] Han. J &Kamber. M (2001). “Data mining concepts and techniques”, San Francisco, USA, Morgan Kaufmann. [11] Hijazi S. T., &. Naqvi R. S. M. M, “Factors affecting
student’s performance: A Case of Private Colleges”, Bangladesh e-Journal of Sociology, Vol. 3, No. 1, 2006. [12]http://en.wikipedia.org/wiki/Weka_(machine_learnin
g)ctical Machine Learning Tools and Techniques with Java Implementations,” California: Morgan Kaufmann, 2005