ISSN Online: 2167-9541 ISSN Print: 2167-9533
DOI: 10.4236/jfrm.2019.82004 Jun. 4, 2019 43 Journal of Financial Risk Management
Performance Base Empirical Analysis of Mutual
Fund of Nepal
Tara Prasad Upadhyaya, Sirjana Chhetri
Tribhuvan University, Lumbini Banijya Campus, Butwal, Nepal Email: [email protected], [email protected]
Abstract
The paper analyzes the returns earned by the sample mutual funds ben-chmarking with market return. It also assesses whether they are taking ad-vantages of diversification, market timing and selectivity of securities to their investors. Secondary data of eight sample mutual funds’ have been used from 2015 to 2018 published by Nepal Stock Exchange and respective fund man-ager. Risk adjusted performance measures Jensen alpha, Treynor ratio and Sharpe ratio have been used to analyze return in terms of risk and Co-efficient of Determination (R2), Quadratic Regression of Treynor and Mazuy and Fa-made composition model are employed to assess diversification, market tim-ing and selectivity ability of fund manager. The result explores that funds that are operated from 36 months over-perform benchmark market index and those funds operated for 16 months are suffering from very low return. Fur-ther evidence shows that low amount of diversification, moderate level of se-lectivity and no significant relationship between timing skill and return of funds.
Keywords
Mutual Fund, Risk, Benchmark, Return
1. Introduction
A Mutual Fund is an investment vehicle that pools funds from various investors and invests the funds in stocks, bonds, short-term money-market instruments, other securities or assets or some combination of these investments. The prima-ry goal behind investment in mutual fund is to earn good return with compara-tively low risk.
The popularity of mutual fund investment among private investors has grown dramatically all over the world during last 40 years. Therefore, mutual fund
per-How to cite this paper: Upadhyaya, T. P., & Chhetri, S. (2019). Performance Base Em-pirical Analysis of Mutual Fund of Nepal. Journal of Financial Risk Management, 8, 43-54.
https://doi.org/10.4236/jfrm.2019.82004 Received: March 19, 2019
Accepted: June 1, 2019 Published: June 4, 2019
Copyright © 2019 by author(s) and Scientific Research Publishing Inc. This work is licensed under the Creative Commons Attribution International License (CC BY 4.0).
DOI: 10.4236/jfrm.2019.82004 44 Journal of Financial Risk Management formance has always been one of the most researched areas of finances. At the end of 2016, mutual fund assets worldwide were $40.4 trillion. Total net assets in worldwide regulated funds hit $49.3 trillion at year-end 2017, it increased to $50.01 trillion at the end of the first quarter of 2018 (Investment Company In-stitute, 2018).
The history of mutual fund in Nepal started with the establishment of “NCM Mutual Fund 1993” by Nepal Industrial Development Corporation (NIDC) Cap-ital Market in 1993. The term of the NCM Mutual Fund 1993 was completed in 2001 and it was converted into close-end fund in the name of “NCM Mutual Fund, 2002” in 2002 (Thapa & Rana, 2011).
Till June, 2018, there are all together 13 mutual scheme traded on Nepal Stock Exchange with total paid up capital Rs.21,705.2 million whereas Nepal Stock Exchange occupy Rs.367,365.5969 million capital. Mutual fund are occupy only 5.91%, 5.81% and 2.16% market share of NEPSE in the year 2018-19, 2017-18 and 2016-17 respectively. At 14 may 2018, total turnover of NEPSE is Rs.12,779.19 million in amount and turnover of mutual fund is Rs.20.76 million that is 0.1625% (Nepal Stock Exchange Exchange, 2018).
Very few research has been completed regarding the mutual fund perfor-mance in Nepal. The overall perforperfor-mance evaluation of Nepalese mutual fund is the main aim of this study. The specific objectives is to measure the return earned by sample mutual funds benchmarking with market return in terms of different risk and to assess the mutual fund schemes offering the advantages of diversification, market timing and selectivity of securities to their inves-tors.
The performance of mutual fund in terms risk adjusted return, diversification, market timing and selectivity ability are analyzed by using diverse technical measurement methods. The popular measures introduced and tested by Jenson (1968). Treynor (1965) andSharpe (1966), are developed on the assumptions of ‘The Capital Asset Pricing Model’ (CAPM) propounded by Sharpe, Lintner and others has been used to analyze the performance of mutual fund. This paper deals with the performance evaluation of 8 mutual funds in terms risk adjusted return, diversification, market timing and selectivity ability and it has been structured as Section 1: Introduction, Section 2: Review of literature, and Section 3: Methodology and Data Analysis.
2. Review of Literature
Numerous theoretical and empirical researches have been conducted on the performance evaluation of mutual fund both in the context of developed and developing countries around the world. This section presents a brief review.
Treynor & Mazuy (1966)’s study found that none of the investment managers of the 57 funds (1953-1962) outguess the market and that these managers should not be held responsible for failing to anticipate changes in market direction.
DOI: 10.4236/jfrm.2019.82004 45 Journal of Financial Risk Management return and risk. He evaluated the performance of 34 open-end mutual funds during the period 1944-1963. He concluded that the average mutual fund per-formance was distinctly inferior to an investment in the DJIA (Dow Jones In-dustrial Average). It was also revealed that good performance was associated with low expense ratio and only low relationship was discovered between fund size and performance.
Jensen (1969)developed portfolio evaluation model including risk aspects ex-plicitly by utilizing and extending theoretical results by Sharpe (1964) and Lint-ner (1965) on the pricing of capital assets under uncertainty. The result convey that measure of portfolio performance (which measures only a manager’s ability to forecast security prices) is defined as the difference between the actual returns on a portfolio in any particular holding period and the expected returns on that portfolio conditional on the riskless rate, its level of systematic risk, and the ac-tual returns on the market portfolio. Criteria for judging a portfolio’s perfor-mance to be neutral, superior, or inferior are established.
Fama (1972) introduced a model for evaluating investment performance of managed portfolios. He suggested that the overall performance of managed portfolios could be broken down into several components. He argued that the observed return of a fund could be, due to the ability of fund managers, to pick up the best securities at a given level of risk (their selectivity ability). Some por-tion of this return could also arise due to the predicpor-tion of general market price movements (their market timing ability).
Henriksson (1984), by using both the parametric and non-parametric tests for the evaluation of forecasting ability presented by Henriksson and Merton, the market-timing ability of 116 open-end mutual funds is evaluated for the period 1968-80. He found little evidence of market timing ability of manager.
Grinblatt & Titman (1989) employ the 1975-84 quarterly holdings of a sample of mutual funds to construct an estimate of their gross returns. They use sample, which is not subject to bias and sample is used to test for the existence of ab-normal performance. The tests indicate that the risk-adjusted gross returns of some funds were significantly positive.
Blake & Timmermann (1998), they obtained some new patterns in perfor-mance related to the funds’ distance from their inception and termination dates: underperformance intensifies as the fund termination date while, in contrast, there is some evidence that funds (weakly) outperform during their first year of existence. These evidence supported by large sample containing the complete return histories of 2300UK opened mutual funds over a 23-year period to meas-ure fund performance.
dem-DOI: 10.4236/jfrm.2019.82004 46 Journal of Financial Risk Management onstrated empirically to improve discriminatory power of performance.
Jaydev (1996) evaluates the performance of two growth oriented mutual funds (Mastergain and Magnum Express) on the basis of monthly returns compared to benchmark returns. It is found that, Mastergain has performed better. Biplob (2017) evaluates the performance of 15 close-ends Bangladeshi mutual funds traded in DSE (Dhaka stock exchange) by using Jensen alpha, Treynor ratio, Sharpe ratio. He found that 12 out of 15 funds got superior return compared to benchmark index return. Further he concluded that 9 out of 15 funds are well diversified and have reduced its unique risk, statistically significant timing skill but moderate level of selectivity in mutual fund market of Bangladesh.
Bajracharya (2016) studied seven mutual funds listed in the Nepal stock ex-change trade (NEPSE), and concluded that most of the mutual funds have per-formed better according to Jenson and Treynor measures but not up to the benchmark on the basis of Sharpe ratio and few mutual funds are well diversified and have reduced its unique risk.
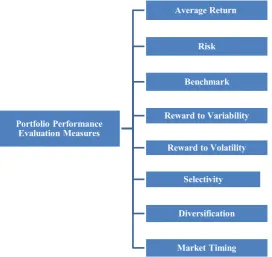
1) Average Return
The performance of mutual fund can be analyzed with the help of produced average return based on NAV by the mutual over the period(Sharpe, Alexander, & Bailey, 2001) of time. Generally, portfolio performance is evaluated by calcu-lating return which also incorporate dividends and capital gains (Figure 1).
2) Risk
The risk is calculated on the basis of month-end NAV. The following meas-ures of risks associated with portfolio: Standard Deviation (σ), Beta (β), Unsys-tematic Risk (σEp) are used for evaluation of mutual fund.
3) Benchmark
A benchmark is a standard against which the performance of a security, mu-tual fund or investment manager can be measured. Generally, broad market and market-segment stock and bond indices are used for this purpose. Comparison of risk return of other companies can be compared to evaluate performance of the company.
4) Reward to Variability
It was developed by Sharpe (1966). Sharpe devised an index of portfolio per-formance measure, referred to as reward o variability ratio. The Sharpe ratio provides the reward to volatility trade-off. It is the ratio of the fund portfolio’s average excess return divided by the standard deviation of the return.
5) Reward to Volatility
Treynor (1965) was the first researcher developing a composite measure of portfolio performance which is called Treynor ratio. Treynor conceived an index of portfolio performance called as reward to volatility ratio based on systematic risk. It is denoted by TP is the excess return over the risk free rate per unit of systematic risk, in other words it risk premium per unit of systematic risk.
6) Selectivity
DOI: 10.4236/jfrm.2019.82004 47 Journal of Financial Risk Management
Figure 1. Theoretical framework. Source: Sharpe, Alexander, & Bailey (2001).
ability to earn returns through the successful forecast of security prices. Similar-ly, Fama said that while observed return of a fund could be due to the ability of fund managers to pick up best securities at a given level of risk (selectivity). Se-lectivity can be further decomposed into net seSe-lectivity and diversification.
7) Diversification
One of the important advantages of mutual funds is that a small investor can also enjoy benefits of diversification of portfolio. Further, well diversified portfo-lio reduces the risk of the portfoportfo-lio. Diversification can be measured with the help of coefficient of determination (R2).
8) Market Timing
Treynor and Mazuy (1966), developed model to evaluate market-timing per-formance. Mutual fund managers may hold a higher proportion of the market portfolio if they are qualified to predict future market conditions and envisage the stock market as a bull market. On the other hand, mutual fund managers may hold a lower proportion of the market portfolio if they expect the market to underperform in the future.
3. Methodology and Data Analysis
Research DesignThe descriptive research design includes the model: Jensen Measure, Sharpe Ratio, Trenyor Ratio, FamaMeaure, Trenyor and Mazuy Quadratic equation based Capital Assets Pricing Model for analysis of performance, market timing and selectivity ability of mutual funds. The secondary data is collected from monthly and annual report of Nepal Stock Exchange, published Net Assets
Val-Portfolio Performance Evaluation Measures
Average Return
Risk
Benchmark
Reward to Variability
Reward to Volatility
Selectivity
Diversification
DOI: 10.4236/jfrm.2019.82004 48 Journal of Financial Risk Management ue of sample mutual fund on respective fund manager, annual report of mutual fund consists income statement and balance sheet, government securities and open market operation statistics published on Nepal Rastra Bank. Out of 13 mutual funds only 8 mutual fund are selected and remaining 5 mutual fund are excluded from the study because they are recently launched in market.
Tools used for Data Analysis
The popular measures introduced and tested by Jenson (1968). Treynor (1965) and Sharpe (1966), Fama (1972),Treynor and Mazuy (1966) are based on the assumptions of “The Capital Asset Pricing Model” (CAPM) propounded by Sharpe, Lintner and others. The CAPM specifies that in equilibrium the return and risk are in linear relationship called as Security Market Line (SML).
(
)
Rp Rf= +β Rm Rf−
where Rp = expected return on security portfolio, Rf = Risk Free Return,
Rm = Expected market return, β = systematic risk of portfolio.
For a well-diversified portfolio, above relationship can be specified in terms of the total risk (σ) of portfolio return, called as Capital Market Line (CML).
(
)
p R
Rp R m Rf
m
f σ
σ
−
= +
where, σm is the total risk of market index 1) Jensen Alpha
Michael Jensen (1968) has introduced a portfolio performance measure called Jensen alpha also known as Jensen ratio, defines measure of portfolio perfor-mance as the difference between the actual return on a portfolio and the ex-pected returns in any particular holding period on that portfolio conditional on the risk free rate and systematic risk. The positive alpha indicates selection skills of the manager of fund.
ap ARp EARp= −
where,
EARp = Equilibrium Average Return = ARf + βp(Arm − ARf), Ap is the Jensen Alpha,
ARp is the average portfolio return, ARm is the average market return, ARf is the average risk free rate of return, Βp is the systematic risk of portfolio. 2) Treynor Technique
Treynor ratio is the first risk-adjusted performance measure of mutual funds that was put forward by Treynor in 1965. It is calculated as the ratio of the excess return of the mutual fund divided by its beta (systematic risk) and is defined as:
p ARp p f
T AR
DOI: 10.4236/jfrm.2019.82004 49 Journal of Financial Risk Management ARm A
Tm Rf
m β
− =
where, Tp is Treynor ratio of portfolio, Tm is Treynor ratio of market, βm is systematic risk of market.
Here, excess returns of market over risk free return (ARm – ARf) are the benchmark. Greater value of the portfolio over the market indicates a superior performance of the fund.
3) Sharpe Technique
The Sharp ratio uses standard deviation to measure total risk of a portfolio rather than to consider only the systematic risk summarized by beta factor. This ratio basically indicates risk premium return earned per unit of total risk. Sharpe introduced the following reward to variability ratio (known as sharp ratio) as follows:
ARp A
Sp Rf
p
σ − =
ARm m
m f
S AR
σ
− =where, Sp is Sharpe ratio of portfolio, Sm is Sharpe ratio of market,
σp is risk of portfolio return, σm is total risk of market index.
4) Treynor&Mazuy Regression Analysis
Treynor and Mazuy (1966) developed the following model to evaluate mar-ket-timing performance
(
) (
)
2Rp Rf a b Rm Rf− = + − +c Rm Rf− +Ep
where “a” is the timing-adjusted alpha, which represents the timing-adjusted se-lective ability of mutual fund managers. The quadratic term in equation is the market timing factor and the coefficient of the market timing factor, “b” represents mutual fund managers’ market timing ability. If “b” is positive, mu-tual fund managers have superior market timing ability i.e., the investment portfolios of mutual funds are adjusted actively to well-anticipated changes in market conditions. A negative implies that mutual fund managers do not exhibit market timing ability.
5) Fama Measures
Fama measures breaks down the observed return into four components: 1) Risk free return Rf
2) Compensation for systematic risk β(Rm – Rf)
DOI: 10.4236/jfrm.2019.82004 50 Journal of Financial Risk Management to get the desired return. Fama performance measures denoted by Fp are defined as:
(
) (
{
)(
)
}
Portfolio Return Risk free return Returns due to all risks
Fp
Rp Rf σ σp m Rm Rf
= − −
= − − −
A positive value for Fp indicates that the fund earned returns higher than ex-pected returns and lies above CML and a negative value indicates that the fund earned return less than expected returns and lies below CML.
6) Diversification
Diversification can be measured with the help of coefficient of determination (R2). This can be obtained by regressing the portfolio’s additional return (Rp − Rf) against the market additional returns (Rm − Rf). A high value indicates greater diversification of fund and vice-versa.
The sample in this study consist of 8 mutual fund traded in Nepal Stock Ex-change which we group them into two group to analyze separately. First group consist four mutual fund which are operating from 36 month and more, NAV is taken from May 2015 to May 2018. Group B consist also four mutual fund which are operating from are 16 month and more. Furthermore, dividend also has been adjusted in the return of mutual fund. In this context only four mutual fund of Group A has been distributed dividend to its shareholders two times during the period of 36 months, i.e adjusted in return after 3 month of declaration date. But in Group B no any mutual fund distributed dividend. Further, interest rate of 182 days Treasury bills published by Nepal Rastra Bank (2018) on 14 May 2018 has been taken as risk free rate of return.
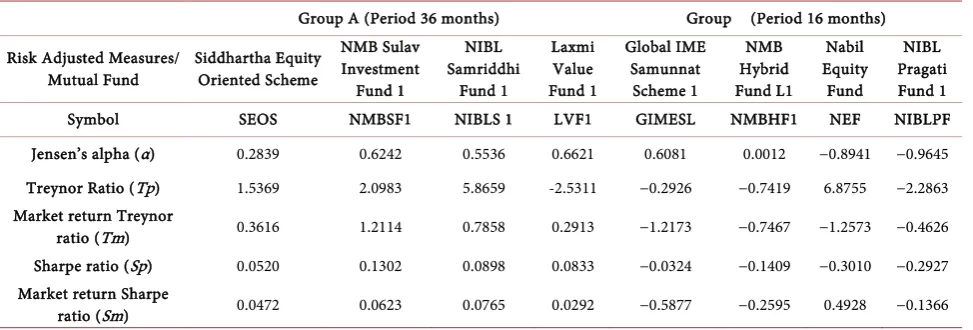
Table 1 indicates that the mutual fund from group A (based on dividend ad-justed return) all fund generate positive Jensen alpha. In Group B two funds (NEF and NIBLPF) show negative alpha, on overall basis fund industry alpha is good. In Group A, out of the four mutual funds under consideration it has been found that LVF1 with alpha of 0.6621. Similarly, GIMESL got the highest Jensen alpha 0.6081 from Group B. Precisely, finding overall positive alpha from this study indicates that funds are able to generate higher return than equilibrium return using CAPM.
Similarly, result shows that all the funds except LVF1 have experienced higher than market return in case of Treynor ratio also called reward to vola-tility ratio i.e., return per unit of systematic risk (β) in Group A fund but in market NMBSF1 performs better than others . All fund except NEF are earning negative return as reward to volatility from Group B whereas in market all are performing negative return.
DOI: 10.4236/jfrm.2019.82004 51 Journal of Financial Risk Management
Table 1. Risk adjusted performance measure.
Group A (Period 36 months) Group (Period 16 months) Risk Adjusted Measures/
Mutual Fund Siddhartha Equity Oriented Scheme
NMB Sulav Investment Fund 1
NIBL Samriddhi
Fund 1
Laxmi Value Fund 1
Global IME Samunnat
Scheme 1
NMB Hybrid Fund L1
Nabil Equity
Fund
NIBL Pragati Fund 1 Symbol SEOS NMBSF1 NIBLS 1 LVF1 GIMESL NMBHF1 NEF NIBLPF Jensen’s alpha (α) 0.2839 0.6242 0.5536 0.6621 0.6081 0.0012 −0.8941 −0.9645 Treynor Ratio (Tp) 1.5369 2.0983 5.8659 -2.5311 −0.2926 −0.7419 6.8755 −2.2863 Market return Treynor
ratio (Tm) 0.3616 1.2114 0.7858 0.2913 −1.2173 −0.7467 −1.2573 −0.4626 Sharpe ratio (Sp) 0.0520 0.1302 0.0898 0.0833 −0.0324 −0.1409 −0.3010 −0.2927 Market return Sharpe
ratio (Sm) 0.0472 0.0623 0.0765 0.0292 −0.5877 −0.2595 0.4928 −0.1366
case of market NIBLSF1 and NEF are performing better than other from both Group.
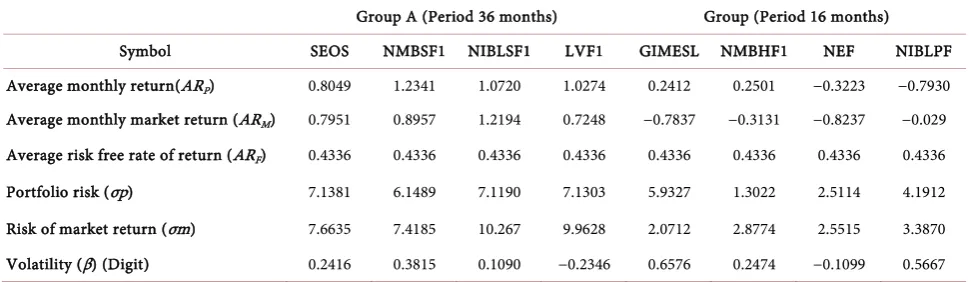
Table 2 discloses that based on dividend adjusted return all the funds from Group A have positive return. Out of four three fund earning greater than mar-ket return, they are: SEOS, NMBSF1, LVF1. On the other hand, some mutual funds have lower total risk than market. In addition mutual funds return are less sensitive than market since all fund have Beta less than 1. In Group B, all mutual funds are performing lower than risk free rate of return, GIMESL, NIBLPF have greater risk than market but other have lower risk than market. Beta is also low-er than 1 it reflow-ers lowlow-er sensitivity of stock.
Table 3 depict that with low R2 value of mutual fund represented the less di-versification of the portfolio and the high R2 value indicates the well diversified portfolio. Most of the funds indicate the low R2 that the portfolio is less diversi-fied its unique risk and is high unsystematic risk is low but the total risk is very high.
On the other, NMBSF1 and NMBHF1 from Group A and B respectively have higher R2 indicates low total risk, systematic risk and unsystematic risk because of well diversified portfolio. Managers of other fund are taking some level of di-versifiable risk (unsystematic risk, σEp).
Table 4 reveals that Group A and Group B has positive c-coefficient but none of them has been found statistically significant at any level of significance. Moreover using Treynor and Mauzy Quadratic equation, a (alpha) which represent selectivity of fund. Out eight five funds have positive selectivity but none of the fund is statistically significant at any level of significance.
DOI: 10.4236/jfrm.2019.82004 52 Journal of Financial Risk Management
Table 2. Descriptive summary statistics of mutual funds and market index.
Group A (Period 36 months) Group (Period 16 months) Symbol SEOS NMBSF1 NIBLSF1 LVF1 GIMESL NMBHF1 NEF NIBLPF Average monthly return(ARP) 0.8049 1.2341 1.0720 1.0274 0.2412 0.2501 −0.3223 −0.7930
Average monthly market return (ARM) 0.7951 0.8957 1.2194 0.7248 −0.7837 −0.3131 −0.8237 −0.029
Average risk free rate of return (ARF) 0.4336 0.4336 0.4336 0.4336 0.4336 0.4336 0.4336 0.4336
Portfolio risk (σp) 7.1381 6.1489 7.1190 7.1303 5.9327 1.3022 2.5114 4.1912 Risk of market return (σm) 7.6635 7.4185 10.267 9.9628 2.0712 2.8774 2.5515 3.3870 Volatility (β) (Digit) 0.2416 0.3815 0.1090 −0.2346 0.6576 0.2474 −0.1099 0.5667
Table 3. Risk and diversification.
Group A (Period 36 months) Group (Period 16 months)
[image:10.595.56.540.412.541.2]Symbol SEOS NMBSF1 NIBLSF1 LVF1 GIMESL NMBHF1 NEF NIBLPF Total risk (σp) 7.1381 6.1489 7.1190 7.1303 5.9327 1.3022 2.5114 4.1912 Systematic Risk (βp) 0.2416 0.3815 0.1090 −0.2346 0.6576 0.2474 −0.1099 0.5667 Unsystematic risk (Eσp) 0.0689 0.0549 0.0703 0.0706 0.0577 0.0114 0.0254 0.0322 Diversification (R2) 0.0673 0.2061 0.0247 0.0989 0.0527 0.2801 0.0120 0.2619
Table 4. Treynor and mauzy quadratic equation.
Mutual Fund Group A (Period 36 months) Group (Period 16 months)
[image:10.595.55.544.575.741.2]Symbol SEOS NMBSF1 NIBLSF1 LVF1 GIMESL NMBHF1 NEF NIBLPF a 0.6244 1.0796 0.1930 1.7047 0.2842 −0.0396 −0.8677 −2.383 P value of a 0.6383 0.3254 0.8812 0.2004 0.8665 0.9197 0.3581 0.0823 b 0.2716 0.4613 0.0931 −0.0435 2.4481 0.2485 −0.1254 0.3942 c −0.0059 −0.0092 0.0035 −0.0111 0.4337 0.0044 −0.0057 0.0449 P value of c 0.5663 0.4131 0.4343 0.0550 0.0838 0.8376 0.9476 0.4264
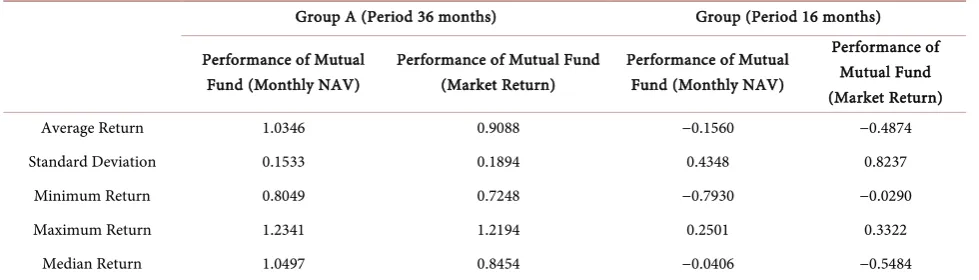
Table 5. Break up of portfolio returns.
DOI: 10.4236/jfrm.2019.82004 53 Journal of Financial Risk Management
Table 6. Return and risk on portfolios (figure in %).
Group A (Period 36 months) Group (Period 16 months) Performance of Mutual
Fund (Monthly NAV)
Performance of Mutual Fund (Market Return)
Performance of Mutual Fund (Monthly NAV)
Performance of Mutual Fund (Market Return) Average Return 1.0346 0.9088 −0.1560 −0.4874 Standard Deviation 0.1533 0.1894 0.4348 0.8237
Minimum Return 0.8049 0.7248 −0.7930 −0.0290 Maximum Return 1.2341 1.2194 0.2501 0.3322
Median Return 1.0497 0.8454 −0.0406 −0.5484
Table 6 reveals that in Group A from May 2015 to May 2018 on an average mutual fund earned return of 1.0346% monthly with standard deviation of 0.1533 monthly based on monthly NAV. Whereas average monthly return of market in this period was 0.9088 with the standard deviation 0.1894. Which in-dicates mutual funds’ performance was better than market index. In Group B from February 2017 to May 2018 on an average mutual fund monthly earned return of −0.1560% with standard deviation of 0.4348 based on monthly NAV. Whereas average monthly return of market in this period was −0.4874 with the standard deviation of 0.8237 which indicates mutual funds’ performance and market performance both are not good.
4. Conclusion
The results pertaining to the selectivity skills of fund managers have indicated that all of group A possess positive net stock selection ability of portfolio man-agers have found positive for majority of schemes but Group B mutual fund have negative net selectivity ability. So it can be concluded that over research pe-riod mutual funds are over-perform benchmark market index and it depicts low amount of diversification, moderate level of selectivity and no significant rela-tionship between timing skill and return of funds. Mutual Funds have contri-buted significantly to shaping economy. To accelerate economic growth and en-hance the financial capabilities of small household, it is the better solution for investment issue since small amount can be employed through good selection and timing strategy.
Conflicts of Interest
The authors declare no conflicts of interest regarding the publication of this pa-per.
References
DOI: 10.4236/jfrm.2019.82004 54 Journal of Financial Risk Management Biplob, M. N. (2017). Performance Evaluation of Bangladeshi Mutual Fund: An Analysis
of Monthly Return Based on Net Asset Value. International Journal of Economics and Management Sciences, 6, 428. https://doi.org/10.4172/2162-6359.1000428
Blake, D., & Timmermann, A. (1998). Mutual Fund Performance: Evidence from the UK. Review of Finance, 2, 57-77.https://doi.org/10.1023/A:1009729630606
Fama, F. E. (1972). Component If Investment Performance. Journal of Finance, 27, 551-567.https://doi.org/10.1111/j.1540-6261.1972.tb00984.x
Galagedera, D., Roshdi, I., & Fuku, H. (2018). A New Network DEA Model for Mutual Fund Performance Appraisal: An Application to U.S. Equity Mutual Funds. Omega, 77, 168-179.https://doi.org/10.1016/j.omega.2017.06.006
Grinblatt, M., & Titman, S. (1989). Mutual Fund Performance: An Analysis of Quarterly Portfolio Holdings. The Journal of Business, 62, 393-416.
https://doi.org/10.1086/296468
Henriksson, R. D. (1984). Market Timing and Mutual Fund Performance: An Empirical Investigation. The Journal of Business, 57, 73-96.https://doi.org/10.1086/296225 Investment Company Institute (2018). Research & Statistics.
https://www.ici.org/research/investors
Jensen, M. C. (1969). Risk, the Pricing of Capital Assets, and the Evaluation of Investment Portfolios. Journal of Business, 42, 167-247.https://doi.org/10.1086/295182
Nepal Rastra Bank (2018). Public Debt. https://nrb.org.np/pdm/pdmindex.php Nepal Stock Exchange Exchange (2018). Reports.
http://www.nepalstock.com/reports-by-category
Sharpe, W. F. (1966). Mutual Fund Performance. The Journal of Business, 39, 119-138. https://doi.org/10.1086/294846
http://www.jstor.org/stable/2351741
Sharpe, W. F., Alexander, G. J., & Bailey, J. V. (2001). Investment. New Delhi: Prentice Hall of India.
Thapa, K., & Rana, S. B. (2011). Investment Management (3rd ed.). Kathmandu: Asmita Books Publishers & Distributors Private Ltd.