Munich Personal RePEc Archive
Time allocation and performance: the
case of Chinese entrepreneurs
Talavera, Oleksandr and Xiong, Lin and Weir, Charlie
29 February 2016
Online at
https://mpra.ub.uni-muenchen.de/69778/
Time allocation and performance: the case of Chinese entrepreneurs
Oleksandr Talavera
School of Management,
Conduit Road
University of Sheffield
Sheffield S10 1FL
Email [email protected]
T 0 114 222 3451
Charlie Weir
Aberdeen Business School,
Garthdee Road
Robert Gordon University
Aberdeen AB10 7QE
Email [email protected]
T 01224 263812
Lin Xiong
Aberdeen Business School,
Garthdee Road
Robert Gordon University
Aberdeen AB10 7QE
Email [email protected]
T: 01224 263130
Corresponding author: Charlie Weir
This work was supported by the The Royal Society of Edinburgh (RSE) and The National
Time allocation and performance: the case of Chinese entrepreneurs
Abstract
This paper analyses the effect of time allocation on the financial performance of
entrepreneurial firms. We apply the Lewbel (2012) estimator to a pooled dataset of Chinese
private manufacturing firms that are managed by their owners. Time is allocated between
management, networking and study activities. After accounting for endogeneity, we find an
inverted U-shaped relationship between management hours and firm performance and
between networking and firm performance. However, no relationship between time spent
studying and firm performance is observed. We also find that the managing
hours-performance relationship is particularly strong for companies managed by
entrepreneurs who own more than 75% of share, for companies that are managed by owners
with previous experience, for male entrepreneurs and for smaller sized firms.
Key words
Time allocation, owner manager businesses, China
JEL codes
1. Introduction
This study examines the effect of time allocation on the performance of Chinese
owner-controlled manufacturing firms. We investigate a research question which is
fundamental to the success of small business owners, namely: what is the best way to allocate
the scarce resource of time? Time allocation is particularly important for entrepreneurs
because their working hours are fragmented into a wide range of activities, (Florén 2006). For
example, O’Gorman et al. (2005) argue that, over a day, small firm CEOs performed on
average, 35 activities. In addition, they had to deal with a range of people including
subordinates, suppliers and customers. Florén and Tell (2012) suggest that managers in fast
growing firms spend about 40% more undisturbed time on other work than on the daily
operational work of the firm. Verheul et al. (2009) find that individuals will work fewer hours
if they have other income available and that the productivity of time is positively related to
relevant experience. Therefore, the optimal allocation of time between different activities
represents a crucial part of the decisions made by an entrepreneur.
We address the time allocation problem by analyzing how financial performance is affected
by the allocation of time among three different activities, namely managing, networking and
studying. In contrast to other specifications that employ a positive monotonic
time-allocation-performance relationship (e.g., Ang et al. 2000; Bitler et al. 2005), we propose
that there is inverted U-shaped relationship between hours allocated to different activities and
firm performance. The increasing opportunity costs associated with additional hours leads to
diminishing performance returns. This suggests that too many hours allocated to a specific
activity, for example investment in social capital, may harm performance because too little
time is being spent on other important activities such as managing the company or investing
in in human capital.
The Chinese environment is well-suited to our empirical investigation for two main reasons.
First, the development of the Chinese economy, with its expansion in entrepreneurial activity,
provides an interesting framework within which to analyse the importance of time allocation.
Even though private enterprises were not formally permitted until 1988, nowadays we
observe the rapid growth and importance of Chinese SMEs (Anderson et al. 2003). For
example, in 2011 they accounted for about 55% of the growth of gross domestic product and
70% of all employment (NBSC 2013). Second, the success of private enterprise development
is regarded as a significant characteristic of Chinese entrepreneurs who are more likely to
stress a strong work ethic (Morris and Schindehutte 2005).
The study contributes to the empirical literature in two important ways. First, it contributes to
the entrepreneurship literature by exploring the impact of the time allocation behaviour of
Chinese entrepreneurs on firm performance. The analysis of three activities, namely
managing, networking and studying, provides deeper insights into how these activities affect
the performance of entrepreneurial ventures. Second, the empirical analysis is based on the
theoretical underpinnings of opportunity costs whereby, beyond a certain point, allocating
additional hours to one activity rather than to another has an adverse effect on performance.
Given that time is a constrained resource, we propose an inverted U-shaped relationship
between managerial activities and the performance of entrepreneurial ventures. We also
develop the analysis by linking the opportunity cost model to social and human capital
theories in relation to networking hours and study hours respectively. These links are explored
by employing the Lewbel (2012) estimator which addresses endogeneity issues.
Our analysis is based on two extensive nationwide surveys of Chinese private
owner-controlled manufacturing enterprises across 31 provinces in 2004 and 2006. As
hypothesised, we find an inverted U-shaped relationship between performance and
management hours and between performance and networking hours. The optimal time spent
on management activities is 6.8 hours per day (or about 34 hours per 5-days week) and on
networking it is 4.9 hours per day (or about 24.3 hours per 5-days week). This evidence
suggests that there are optimal time allocations for each of these activities and that beyond a
certain number of hours, additional hours appear to harm firm performance. We also report
qualitatively similar results for firms that have male owners. A quadratic relationship with
management hours is also found in smaller firms, in firms with high ownership shareholdings
and in firms with more experienced managers. . However, we find no relationship between
study hours and firm performance in either the whole sample or in any of the subsamples
analysed.
The paper therefore provides support for a number of theoretical explanations of the time
allocation-performance relationship. We find support for the typical labour-leisure trade-off
theories. Excessive time spent on certain activities will have a detrimental impact on firm
performance. However, the performance-effort sensitivity may be reduced by agency costs.
enhances the effect of management effort on performance. Finally, our analysis of the
importance of human capital investment produces insignificant outcomes suggesting that a
longer time period and specific programs of education may be required to observe any
benefits from the investment.
The rest of the paper is organized as follows. The next section provides a review of relevant
literature and discusses the main hypotheses. Section 3 describes our empirical strategy.
Section 4 describes the data and initial analysis. Section 5 reports the results and Section 6
presents the conclusions.
2. Theory, literature and hypotheses development
This section provides the theoretical context within which the effects of time allocation on
firm performance are analysed. Time is an important concept in economics because it is a
scarce resource. Becker (1965) presents a theory of the allocation of time between different
activities. The concept of time allocation between different activities has been extended to
analyse a number of situations including, the factors affecting the allocation of time devoted
to a new venture whilst remaining employed (Burmeister-Lamp et al. 2012). Others have
analysed the self-employment or employment decision (Levesque et al. 2002). In addition,
there are a number of studies that have proposed a non-linear relationship between hours
worked and factors such as taxation and welfare benefits (Chetty 2012), budget constraints
(Beffy et al. 2014), and restrictions on the number of hours that can be worked (Ham and
Reilly 2002).
There is also a strand of literature that analysed the hours allocation issue in relation to
business. An entrepreneur’s limited time has to be allocated among a number of activities,
(O’Gorman et al. 2005). In this paper we define time allocation in terms of the share of each
day spent on the following activities: management, networking and studying. Furthermore,
the effects of all these activities on firm performance may differ with respect to institutional
setup, for example, agency issues or in terms of the size of firms and entrepreneurs’ personal
characteristics such as previous managerial experience and gender.
A typical entrepreneurial model (e.g. Holmström and Tirole 1997) assumes a positive,
monotonic relationship between effort and performance. In this setup, greater effort increases
profit. There is evidence that increased hours spent on managing will generate benefits for the
hours worked and report that this has a positive effect on firm performance. Abernethy et al.
(2013) examine the association between different types of performance measure and the time
horizon of business unit managers that have profit responsibilities. They report that managers
spend most time on short-term horizon activities and least time on long-term horizon
activities. However, they also find that financial and non-financial performance is positively
associated with management taking account of longer time horizons. Bandiera et al. (2011)
find that, for Italian CEOs, time spent with insiders is positively related to firm performance
whereas time spent with outsiders is not. Bandiera et al. (2013) also find a positive
relationship between the number of hours worked by Indian CEOs and firm performance.
There is also limited evidence about the non-linear nature of the hours-performance
relationship. Bitler et al. (2005) propose a Cobb-Douglas relationship which yields a positive
relationship between hours and performance. Bandiera et al. (2011 and 2013) assume a
linear-log function and report a positive relationship. This implies that increasing hours
associated with any activity improves performance. However, consistent with increasing
opportunity costs and diminishing marginal returns to hours allocated, we propose an inverted
U-shaped relationship between activity hours and financial performance. We develop a
theoretical model below to support this proposition.
2.1 Theoretical Model Framework
To underpin our econometric specification, we develop a simple theoretical framework. We
assume that an entrepreneur has a C1 utility function U(E) equal to venture profit π(E) minus
opportunity costs c(E). For simplicity, the profit function is assumed to be π(E) = AEα,
where A is the exogenously defined level of an entrepreneur's ability and α is return on
effort, 1 > α > 0. Opportunity costs are parametrized as the linear function of effort
(E), c(E) = ηE:
𝑈(𝐸) = 𝜋(𝐸) − 𝑐(𝐸) = 𝐴𝐸𝛼− 𝜂𝐸
0 ≤ 𝐸
𝐸 ≤ 𝐸̅
Effort is constrained not to exceed the exogenous value E̅ > 0 which corresponds to
constraint (0 ≤ E). The internal solution for this setup is:
E∗ = (Aα
η )
1 1−α
U(E∗) = (Aα
η )
1 1−α
((A)1−α1 (α
η)
α 1−α
− η)
The optimal level of effort is a positive relationship with returns to effort (α) and
entrepreneurs ability (A), and a negative relationship with the opportunity costs of effort (η).
In this case, we would not expect that the relationship between effort and performance to be
monotonic, as assumed by a typical agency model. This outcome is consistent with the
hypotheses set out below.
2.2Hypotheses
The model therefore shows that it is neither optimal not to work (labour supply is zero) nor to
work maximum hours. Diminishing marginal returns to entrepreneurial effort will eventually
set in because of the increasing opportunity costs associated with working beyond the optimal
time allocation.
Thus, beyond a certain number of hours, an increase in hours spent on management activities
means that too little time will be available for other work activities, such as developing social
and business contacts. This ultimately damages the ability of the business to develop and
grow and will thus harm performance. We therefore hypothesize that, up to a point, increasing
the hours allocated to work activities is likely to generate increasing returns but that negative
marginal returns to the additional hours spent on a specific activity will occur beyond a
certain time allocation. This enables us to estimate the optimal time allocation between these
activities and to indicate maximum hours per activity. Therefore, in relation to management
hours:
H1: We expect an inverted U-shaped relationship between hours spent on management tasks
and financial performance
It has been argued that the success of business ventures is determined not only by
entrepreneurial effort but also by financial and social capital (Bosma et al. 2004). Given that
networking and the effect that increasing social capital has on firm performance. A successful
manager needs not only to manage the internal operations of the firm, but has also to establish
external networks and contacts. Social capital may be defined as a means of capturing the
relationship between actions and outcomes associated with the interactions between groups
(Adler and Kwon 2002). They differentiate between bridging social capital, external
relationships, and bonding social capital, internal relationships. It is the former that is the
focus of this paper and in particular the effect of investing in social capital defined in terms of
networking by means such as making business contacts, attending seminars/conferences,
undertaking public relations and hospitality activities and how this affects firm performance.
In relation to the returns to social capital, Bosma et al. (2004) argue that small businesses
need to have stronger ties with for example, clients, investors, debtors, and subcontractors,
and that therefore the expected benefits relating to social capital are high. They find that
investment in social and human capital enhances entrepreneurial performance.1 Fafchamps
and Minten (2002) report a positive relationship between social connections and financial
performance. Davidsson and Honig (2003) find that social capital has a positive effect on the
performance of Swedish entrepreneurial firms. Lee and Tsang (2001) report a positive
relationship between networking and performance for Chinese entrepreneurs in small and
medium sized firms in Singapore. Cao et al. (2014) also find that social capital has a positive
effect on the performance of Chinese firms.
Networking is of particular importance to Chinese firms because the guanxi (a form of social
networking and relationship building) possessed by entrepreneurs is a critical success factor.
State owned enterprises are able to avoid substantial bureaucratic costs and also have better
access to resources in in the Chinese economy (Chen et al. 2015), and therefore guanxi is
essential for private businesses to obtain resources and to navigate bureaucratic structures
(Talavera et al. 2012). Managers’ guanxi networks may benefit their organizational growth
through providing information flows, institutional advantages and necessary resources (Sheng
et al. 2011).
However, an alternative view is that the time spent with outsiders may mostly benefit the
individual manager without contributing to firm’s performance given that the interests of
managers and firms may be misaligned (Malmendier and Tate 2009). Too much time spent on
example, Bandiera et al. (2011 and 2013) find that hours spent networking may benefit the
manager rather than the firm. However, they analysed the time allocations of CEOs whereas
this paper analyses the time allocation of owner managers. Therefore, the appropriate
consideration here is that too much time spent networking may prevent time being allocated
to deal with strategic and operational business issues rather than time being allocated to
benefit the individual manager. This is consistent with our second hypothesis that, beyond a
certain time allocation, increasing opportunity costs are incurred as additional hours are spent
networking:
H2: We expect an inverted U-shaped relationship between hours spent on networking and
financial performance
Human capital may be defined as the skills and knowledge acquired through schooling,
on-the-job training and experience (Becker 1975). Human capital theory therefore implies a
positive monotonic relationship between human capital and performance (Florin et al. 2003).
In the case of entrepreneurs, the greater the human capital, the better able that person is to
exploit profitable opportunities. Cassar (2006) argue that entrepreneurs with greater human
capital will be more successful than entrepreneurs with less human capital because they seek
to earn a higher return on their human capital investment.
However, Davidsson and Honig (2003) argue that this is not necessarily always the case. For
example, excessive human capital might affect risk-taking behaviour and decisions to invest.
They find no evidence that human capital factors affect the performance of nascent
entrepreneurial firms. Further, the effects of different components of human capital vary.
Unger et al. (2011) suggest that performance is more likely to be affected by the outcomes of
human capital investment (knowledge or skills) than by the human capital investments
themselves (education or years of experience).
In addition, the effects of formal education may differ relative to the investment in specific
human capital. For example, Volery et al. (2013) find that entrepreneurial education has a
positive, but limited effect on human capital. Similarly, Dickson et al. (2008) suggest that the
effect of general education is not clear but they do find a positive link between specific
programs of entrepreneurship education and subsequent entrepreneurial success. Finally, the
education–performance sensitivity might be different with respect to the stages of business
We investigate the impact of the investment in human capital, as measured by the number of
hours spent studying, has on firm performance. The impact of time spent on studying on the
business success of an entrepreneur is difficult to predict theoretically. On the one hand, it
may be argued that entrepreneurs that spend more time studying have a stronger commitment
to running their businesses and thus the coefficient for time spent on studying is expected to
be positive.This is because hours spent on studying will increase a manager’s stock of human
capital and will also benefit the company via an improved ability to deal with business issues.
On the other hand, it could be argued that entrepreneurs that spent more time studying will
have higher opportunity costs associated with spending less time on other activities such as
managerial functions. There are empirical studies (e.g., Lynskey 2004 and Ganotakis 2012)
that suggest an inverted U-shaped relationship between human capital and firm performance.
Consistent with this, we hypothesise:
H3: We expect an inverted U-shaped relationship between hours spent studying and financial
performance
The links between activities and performance may change depending on the organizational
imperfections within entrepreneurial ventures or the personal characteristics of business
owners. We develop the analysis by looking at two subsamples: the first deals with potential
agency issues associated with ownership; the second with the importance of previous
managerial experience.
First, we analyse potential agency issues by examining the effect of ownership stakes on the
hours–performance relationship. The separation of ownership and control has long been
recognised as a source of potential conflict between management and shareholders in the
context of publicly owned firms (Jensen and Meckling 1976). The misalignment of interests
results in agency costs being borne by the owners. However, managerial ownership will
reduce the incentive to consume perquisites or to undertake sub-optimal decisions. These
costs diminish as manager shareholdings increase hence leading to a convergence of interests.
However, increased managerial ownership may also lead to entrenchment (Fama and Jensen,
1983), as managers become insulated from effective monitoring. There have been many
studies that have analysed the effect of management ownership of the performance of publicly
quoted companies, for example, Von Lilienfeld-Toal and Ruenzi (2014) for the US,
McKnight and Weir (2009) for the UK, Rose (2005) for Denmark and Andres (2008) for
However, unlike quoted companies, small businesses offer a direct test of the zero agency
cost model because they will yield cases of 100% ownership. This implies that firms that have
managerial ownership of less than 100% will incur agency costs and that these costs will
increase as managerial ownership declines. Consistent with the agency model, Ang et al.
(2000) found that agency costs increased as management shareholding decreased. Bitler et al.
(2005) find that, after controlling for endogeneity, there is a positive relationship between
ownership, hours worked and performance for privately owned firms. Their finding is
consistent with the agency model because it suggests that the incentives provided by increased
ownership result in better firm performance and outweigh any potential entrenchment effects.
Their model uses a logarithmic specification which shows positive, but diminishing, returns to
hours worked. The positive result is consistent with the agency incentive argument. Therefore,
we expect that the incentive effects associated with high managerial ownership will result in a
more efficient allocation of time between managerial activities and improve firm
performance.
H4: The time allocation–performance relationship is stronger as managerial ownership
increases.
The second sample split analyses the impact of management experience on the
hours-performance relationship. As discussed above, entrepreneurial effort as well as social
and human capital may have a differentiated impact during different stages of firm
development. Although the pooled nature of the data does not allow us to directly analyse the
influence of time, we aim to incorporate a temporal element to the analysis by using previous
managerial experience. This represents an accumulation of knowledge, skills and experience
that have been gained over time. A number of studies (e.g. Ehrenberg and Smith 2000)
suggest that there is a positive but non-linear relationship between job experience and
performance. However, Sturman (2003) finds an inverted U-shaped relationship between time
and performance when jobs have low complexity.We therefore hypothesis that:
H5: The time allocation–performance relationship is enhanced by previous management
experience
3. Methodology
Based on our hypotheses, we develop our baseline regression for investigating the
relationship between the time allocation of managers and the performance of their companies,
Firm Performancei= α + β Hoursik+ δ Hours2ik + Ziγ + ui (1)
Where i is the firm, and ui is the error term.
Firm Performancei, is an indicator of operating performance. Consistent with Robb and
Watson (2012) we use return on assets (ROA) defined as profit after tax normalised by total
assets.
Our key explanatory variable, Hoursik, is a self-reported measure of time spent on each of
three activities, k ⊂ { 𝑀𝑎𝑛𝑎𝑔𝑖𝑛𝑔, 𝑁𝑒𝑡𝑤𝑜𝑟𝑘𝑖𝑛𝑔, 𝑆𝑡𝑢𝑑𝑦𝑖𝑛𝑔 }. Respondents were asked how
many hours each day they spent on the following activities: managing, networking, and
studying. In the analysis we report the share of hours spent on each activity (hours divided by
24).2
Vector Zi includes a number of control variables that account for firm and manager
characteristics. To control for firm size, we use the logarithm of total sales.3Log(firm age) is
the natural log of firm age in years. Entrepreneurial characteristics are also expected to be
important in the relationship between time allocation and firm performance. Age is the age of
the entrepreneur in years; Female is a dummy variable that is 1 if the entrepreneur is female
and 0 if male; Single is a dummy variable that is 1 if the manager is a single decision maker
and 0 if not; Education is 1 if entrepreneur has university education and 0 if not. Ownership is
the share (%) of the firm owned by the entrepreneur. Management experience is a dummy
variable that is 1 if the entrepreneur has any managerial experience before, and 0 if not.
Finally, we include industry, region and year dummy variables.
Although we use data from two consecutive waves of the Chinese Enterprise Survey, we
cannot make use of panel data techniques because there are no means of tracking the same
firms over both waves. We, therefore, use pooled data analysis. The hours-performance
relationship may be simultaneous. For example, Verheul et al. (2009) run regressions with
both hours and profit as dependent variables and estimate them by using the same
independent variables. To address the two-way relationship between hours and performance
we utilise an instrumental variable (IV) approach. The traditional IV approach depends on the
To address this issue, we make use of the approach of Lewbel (2012) which generates a set of
internal instruments.
The Lewbel (2012) procedure consists of two stages. Let us assume that we have 𝜑1… 𝜑𝑛
endogenous variables and 𝑥1… 𝑥𝑘 exogenous variables. In the first stage we run n OLS
regressions with the endogenous variables, 𝜙𝑖 as the dependent variables and the exogenous
variables 𝑥1… 𝑥𝑘 as independent variables. After this step we generate predicted residuals
(𝑢1… 𝑢𝑛). Then we use these residuals to construct an instrument vector 𝑧1… 𝑧𝑛 for each
𝑖 ∈ 1. . 𝑛, we estimate 𝑧𝑖 = (𝜑𝑖− 𝜑̅ )𝑢𝑖 𝑖, where 𝜑̅𝑖 is the mean of 𝜑𝑖. Note that this approach is valid in the presence of heteroscedasticity in the first stage, as has been proved by
the Breusch-Pagan (1979) test. In the second stage we run two-step IV-GMM by treating time
allocation as endogenous and instrument it with the internally generated regressors.
In addition to the internally generated instruments discussed above, we also create a vector of
externally selected instruments that are likely to affect time allocation but not performance.
The instruments include variables related to management team characteristics and the
entrepreneur's household and family, namely the natural logarithm of household expenditure,
the natural logarithm of entrepreneur's family size, the share of personal income in total
household income, and the natural logarithm of management team size. None of these
measures are directly linked with the performance of entrepreneurial ventures, but are likely
to affect the time allocation of business owners. For example, larger families and higher
household expenditures may increase the motivation of entrepreneurs to work longer hours,
whereas if the entrepreneur makes a small contribution to the family budget, this may have a
negative effect on hours worked. Increased team size will increase effort because the
entrepreneur will have to spend more time monitoring the activities of the team.
The validity of our estimation depends on two important characteristics. First, there should be
a zero correlation between the instruments and the error term. To test this assumption we
make use of the Sargan/Hansen overidentification test. Second, there should be a strong
correlation between the instruments selected and the instrumented variables. We test this
proposition by Kleibergen-Paap LM statistic which is also known as underidentification test.
4. Sample and data analysis
Our sample consists of manufacturing firm-level data taken from a nationwide sample
of registered businesses in the private sector and has been conducted every two years from 1991
to 2006 by three major business associations (the All-China Federation of Industry and Commerce
(ACFIC), the State Administration for Industry and Commerce (SAIC) and the Chinese Academy
of Social Science (SASS).4 The analysis in this paper is conducted using data pooled over 2004
and 2006. There are 3,837 firms observed in 2006 survey and 3,012 firms in 2004 survey.
These two years had consistent sets of questions whereas earlier surveys asked different questions.
The dataset represents the largest and most comprehensive source of information on Chinese
private enterprises. One of the database’s strengths is that the survey has a response rate of
around 85%.
The surveys sought information about enterprise owners, the nature of their firms, their
management practices and the performance of their businesses. To ensure a focus on
owner-managers, we first identify 5,384 non-listed firms where the largest owner is an
individual. Then, we restrict the sample to the 3,413 firms in which the manager owns at least
50% of the company. To minimize potential misreporting of the time allocation measures,
we only include firms for which the total value for managing, studying and networking hours
less than 16. This gives 3,074 observations. We then exclude firms for which the total
number of hours spent on all three activities exceeded 24 as well as firms with zero work
hours. This restricts our sample to 3,038 observations. Next we ensure that each respondent
answered all relevant questions. This gives a final sample of 1,776 observations. The
self-reported time allocation patterns of the owner-managers are used to develop a measure
of time utilization. Owner-managers are asked to specify the number of hours they spend
on average on the following activities per day: management, networking, and studying.
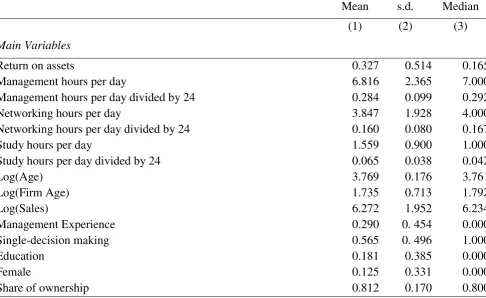
Insert Table 1
Table 1 presents variable definitions and summary statistics based on the estimation sample.
On average, each day, entrepreneurs spend, 6.8 hours on management activities, 3.8 hours on
networking activities and 1.6 hours to studying. Their total daily hours allocated to work
(managing and networking) are 10.6 hours or 53 hours per week. This is slightly higher than
worked by the CEOs of Italian companies who average around 48 hours over a 5 day-week
(Bandiera et al. 2011). However, it is consistent with Hyytinen and Ruuskanen (2007) who
report that the self-employed work more hours than those employed in organisations. The
average age of Chinese entrepreneurs is 43 years old. Only 18.1% have university degree. The
ownership share is 81.2%. 56.5% are defined as single decision-makers and 29% have
previous management experience. Finally, private firms in our sample are profitable with an
average 32.7% return on assets. Fung et al. (2007) use the same survey data in their study.
They report that in wave 2000 and 2002, entrepreneurs’ average age is 44 years old; 90
percent of them are male and more than a third have college degrees or higher. The average
sales revenue in their sample is 21.6 million RMB (2.6 million USD) in 2002 and 18.7 million
RMB (2.3 million USD) in 2000. The average firm age was six years in 2000 and seven years
in 2002. The descriptive statistics in our sample are consistent with previous studies using the
same survey data.
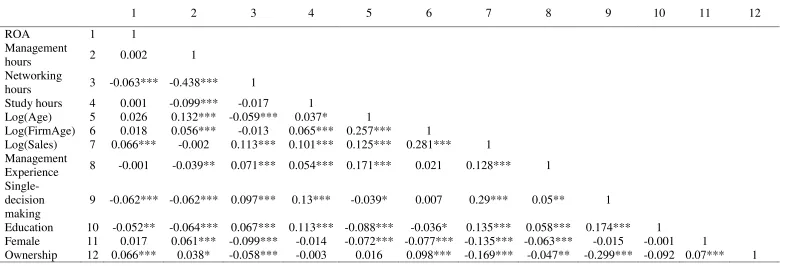
Insert Table 2
Table 2 presents correlation matrix for the firm-level variables employed in our analysis. The
coefficients indicate no strong correlation among explanatory variables. The variance inflation
factor (VIF) statistics are employed to test multicollinearity and suggest no evidence of
multicollinearity in our empirical models.
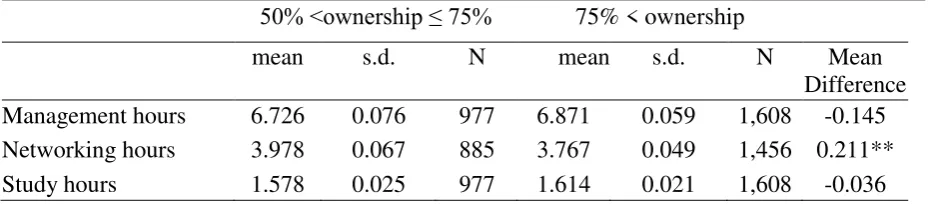
Insert Table 3
Table 3 summarizes management, networking and study hours by ownership, management
experience, gender, and size. As Panel A shows, we observe that managing and studying
hours are not statistically different for firms with high (equal to or less than 75%) and those
with a very high level (above 75%) of managerial ownership. However, lower stake owners
are likely to spend more hours networking than higher stake owners. Panel B reports that,
small business owners without management experience spend more (less) time on managing
(networking) activities compared to their counterparts with management experience. Panel C
shows that, relative to male entrepreneurs, on average female entrepreneurs spent significantly
more hours on management activities but significantly fewer hours per day on networking.
There are no differences between female and male entrepreneurs in relation to time spent on
study. Finally, Panel D suggests that entrepreneurs managing larger firms spend more time on
both networking and study hours than their counterparties running small businesses however
there is no difference in the hours allocated to management activities.
5. Results
Insert Table 4
Table 4 presents results using the Lewbel (2012) estimator with both internal and external
instruments. Hours are measured as a share of 24 hours. We report the underidentification
(Kleibergen-Paap LM) and overidentification (Hansen J) test results. For all three equations,
the underidentification tests rejects the hypothesis that instruments are weak and that
asymptotic theory provides a poor guide to actual finite-sample distributions. The
overidentification tests do not reject the null hypothesis that all instruments are valid. We also
perform the Variance Inflation Factor (VIF) test for the regressions and find no evidence of
multicollinearity. F-tests reported in Table 4 reject the null hypothesis that the coefficients are
equal to zero.
The results in Table 4 show support for Hypothesis 1. We find, as hypothesised, a statistically
significant inverted U-shaped relationship between management hours and performance.
Thus, up to a maximum of 6.8 hours, increasing the number of hours allocated for
management hours increases profitability. However additional time, above 6.8 hours per day,
spent on these activities reduces profitability. The 95% confidence interval ranges from 5.2 to
8.4. There are two possible reasons behind the inverted U-shaped link. First, the labour-leisure
model assumes diminishing marginal productivity of entrepreneurs. Second, motivation and
aspiration could also be reduced with time spent on managing which in its turn increases
opportunity costs. Despite these two facts, we find that 23.6% of owner managers spent in
excess of 8.4 hours per day on management activities. The reallocation of time may have a
positive effect on firm performance.
The estimates for networking hours also reveal statistically significant inverted U-shaped
relationship between time spent on increasing social capital and the return on assets of
Chinese entrepreneurs. The finding supports Hypothesis 2 and is in line with Bosma et al.
(2004) and Lee and Tsang (2001) who also argue that not only initial social capital, but also
investment in social capital affects performance. However, the link between social capital and
the return on assets is not monotonic. The maximum allocation is estimated to be 4.9 hours
per day but beyond that, additional hours spent on networking harm performance. The 95%
confidence interval ranges from 3.4 to 6.3 hours per day. Our data reveal that 60.4% of
entrepreneurs spend time on networking outside this interval. Our results therefore suggest
In relation to Hypothesis 3, we find no evidence to support the hypothesis that there is an
inverted U-shaped relationship between time spent studying and firm performance. This result
is in line with Unger et al. (2011) who find that the outcomes of human capital investment
(e.g. skills) are more important than human capital investment itself (e.g. time spent on
study). More educated entrepreneurs may also be more risk averse which could affect
decisions to invest or expand businesses (Davidsson and Honig, 2003). A further reason for
the insignificant result is that the benefits of studying will take time to feed through to
improved firm performance. Finally, some managers might misreport studying time as
personal time or vice versa. Therefore, lack of statistical significance might simply reflect
measurement error.5
Among the control variables, both Log(Sales) and the dummy of single decision-making are
statistically significant at 1% level. We find that performance is positively related to size
which may be explained by economies of scale obtained by larger firms (Serrasqueiro and
Nunes, 2008). In addition, larger size also allows for the possibility of a greater diversification
of activities, enabling companies to cope more successfully with market changes, as well as
with high-risk situations (Goddard et al. 2005). We find that previous management experience
is not significant. The negative sign of the single decision-making dummy suggests that
Chinese entrepreneurs, making decisions entirely by themselves, might make mistakes in the
decision-making process that will have adverse effects on firm performance. Ownership is
found to be positively related to performance, a finding consistent with the agency model
discussed below.
As set out in hypothesis H4, we develop the analysis by looking at a subsample that highlights
potential agency issues and examine the effect of ownership stakes on the hours–performance
relationship. We test the agency hypothesis that higher managerial ownership improves
performance by splitting the sample into two groups, one consisting of firms in which the
manager owner has between 50% and 75% of the shares and the other in which the manager
owner has more than 75%. This allows us to distinguish between high and very high levels of
ownership concentration and to evaluate the impact of ownership on the
hours-worked-performance relationship.
Insert Table 5
and performance for the 50-75% grouping. However, for the high ownership concentration
group, ownership in excess of 75%, we find statistically significant inverted U-shaped
relationships for management hours. The initial part of this result is consistent with Bitler et
al. (2005) who find a positive relationship between entrepreneurs’ effort and firm
performance when the level of managerial ownership is very high. However, the
inverted-U-shaped nature of the result indicates that beyond a certain number of hours, 7.7 for
the subsample with ownership in excess of 75%, performance suffers. This implies that even
at high levels of ownership, there are limits to effectiveness of additional hours spent on work
activities. Consistent with the agency theory, the results offer some support for Hypothesis 4
and indicate that up to a point, for firms with very high managerial ownership, increasing
management effort benefits firm performance.6
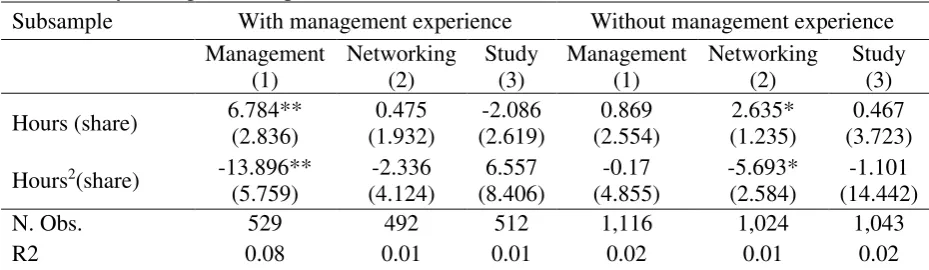
The second sub-sample analyses the impact of managerial experience on the
hours-performance relationship. We divide the sample into two groups, those that had
previous managerial experience and those that did not. Entrepreneurs with different work
experience are likely to develop different patterns of time allocation for different activities.
As Panel B of Table 5 reports, we find a significant inverted U-shaped relationship between
management hours and performance for firms run by managers with previous managerial
experience, with the optimal hours being 5.9. However, we find an insignificant relationship
for networking and study hours. Our data also reveal an insignificant relationship between
management hours and performance for firms run by managers without managerial
experience. These results offer support for Hypothesis 5 given that the effort-performance
relationship is present in the group that had previous managerial experience. This finding
suggests that previously accumulated human and social capital complements managerial
effort. We also observe that networking hours is significant for those without previous
management experience. This may be because managers with no previous experience may
have limited access to social networks and will therefore have to commit extra effort to build
them up. However, too many hours allocated to networking can eventually adversely affect
performance.
Additional analysis and robustness checks
shown that in transition economies, women entrepreneurs have been found to be
disadvantaged in their access to male-dominated industry networks and in using the
opportunities these networks present for business development and growth (Manolova 2005).
In addition, legislation inherited in transitional economies may have harmed women’s future
entrepreneurial success because the legislation reduced their chances of obtaining managerial
experience (Bliss and Garratt 2001). Support for this comes from the fact that, as Table 1
shows, women entrepreneurs account for only 12.5 percent of the sample. McKendrick and
Carroll (2001) argue that the membership of business associations is an important networking
forum for entrepreneurs. We find that significantly fewer Chinese women entrepreneurs have
previous management experience or are members of business associations. Panel A shows a
significant inverted U-shaped relationship between management hours and performance and
between networking and firm performance is found for male entrepreneurs. However, no such
relationship is found for female entrepreneurs. The results imply that the effort made by
women entrepreneurs is not directly rewarded with better firm performance. No relationship
between time spent studying and firm performance is found for either male or female
entrepreneurs.
Second, different patterns of time allocation by firm size were also reported in Table 3. Baker
and Hall (2002) develop a model that allows CEO productivity differs for firms of different
sizes and find that CEOs do a range of activities, the marginal product of which changes with
size in varying degrees. In Table 6 Panel B, we split the sample by firm size and observe
significant inverted U-shaped relationship between management hours and performance in
smaller sized firms. This may be due to that small firms have distinct advantages in judging
and estimating workers’, as well as managers’ performance (Zenger 1994). In contrast, the
effort-performance relationship is insignificant for larger firms. This may be because it is
more difficult to measure the direct link between owner-managers’ effort and firm
performance as firm size increases.
Insert Table 6
We have also undertaken four additional analyses to check the validity of our main results.7
First, we employ different measures of performance as dependent variables, including return
to sales (ROS) calculated by the ratio of net income to total sales; production efficiency
calculated by output per worker; and innovation measured by the ratio of R&D to equity plus
performance and diminishing marginal effects are found on both management and networking
hours when firm performance is measured by ROS. The statistically significant inverted
U-shaped relationship between management hours and firm performance is also found with
output per worker used as dependent variable. However, we find no significant effects when
innovation is used as the dependent variable. This may be due to the effects of time lags,
which we are unable to address due to data availability.
Secondly, we add additional explanatory variables in the regressions, including a financial
constraint (Bank loans/Assets); an innovation dummy (equals to 1, if the firm has patent); and
a foreign investment dummy (equals to 1, if the firm makes investment overseas) (Du and
Girma 2012; Liu 2012). The findings remain consistent with the results reported in Table 4.
The third robustness check is related to the functional form of the time allocation and
performance relationship. Bandiera et al. (2011), report a logarithmic relationship between
hours and performance. We adapt our econometric specification (1) by replacing Hours and
Hours2 with the natural logarithm of Hours. To control for potential endogeneity we employ
the Lewbel (2012) estimator with both internal and external instruments, as used in the main
analysis. The results show a positive and statistically significant relationship for management
hours but insignificant result for networking. Study hours are also insignificant. Thus, the
quadratic relationship seems to be more appropriate than the logarithmic alternative.
Fourth, the entrepreneurs who allocate more time in studying may indicate stronger
commitment to achieve high performance of their businesses; therefore we did a robustness
check by treating education as an endogenous variable. As in Table 4, the results show an
inverted U-shaped relationship between management hours and firm performance and
between networking and firm performance.
6. Conclusions
This study examines the effect of time allocation on performance for 1,776 Chinese
owner-manager firms in 2004 and 2006. We investigate a question which is fundamental to
the success of small business owners, namely: what is the best way to allocate the scarce
resource of time? We answer this question by analyzing how financial performance is affected
by the allocation of time between different activities. As hypothesised, we find a statistically
significant inverted U-shaped relationship between management hours and firm performance
between study hours and firm performance. The optimal time allocation for management
activities is 6.8 hours per day and the optimal networking time allocation is 4.9 hours per day.
We also analyse the time allocation-performance relationship in relation to agency issues, to
previous management experience, firm size and to gender. We find no relationship between
management hours and performance for firms with 50%-75% management ownership but a
significant quadratic relationship for higher ownership stakes is observed. This indicates that
there are agency issues in private companies and that the agency conflict is reduced as
ownership increases. We also find that management experience produces an inverted
U-shaped relationship for those firms whose managers had previous managerial experience.
Similar results are found for small firm subsample. In addition, we examine different effects
of men and women entrepreneurs’ time allocation on firm performance. Significant inverted U-shaped relationship between management hours and performance and between networking
and firm performance are found for men entrepreneurs; but not for women entrepreneurs.
The analysis has presented new insights into the effects of time allocation of owner-managers
on the financial performance of firms in China, an economy that is in the process of adopting
a more market-oriented economic system. A number of policy implications can be derived
from our results. First, although a work ethic is important, the results offer little justification
for working long hours because it does not necessarily improve the financial performance of
companies. This result is particularly interesting given that 23.6% of business owners in our
data spend more than 8.4 hours per day on management activities. An awareness of the
importance of time allocation is important for those starting their own business and policy
makers should try to ensure that entrepreneurs know this. Second, while networking hours are
important, our results suggest that there are limits to the effectiveness of time spent on this
activity. The optimal level of networking is estimated to be 4.9 hours per day but 26.2% of
business owners network more than five hours and 26% less than three hours. These figures
suggest that firms will improve performance if managers reallocate their time more
effectively. Third, the failure rate of entrepreneurial firms is high and thus policy makers
should provide information and assistance in relation to the most efficient use of time. Our
results show that working long hours does not necessarily improve performance, a finding
which is important for entrepreneurs.
We find evidence that the allocation of time across different activities significantly affects
that performance and effort will be positively related up to a certain number of hours and that
beyond that point, the relationship will become negative. Investment in social capital also
positively affects performance but too many hours spend on that activity will produce
negative returns. However, our analysis of the impact of human capital factors produced
insignificant results. This may be explained by the fact that the data did not enable an
inter-temporal analysis to be undertaken and that increases in human capital has no short run
impact on performance.
The analysis does have a number of limitations. First, the use of survey data which relies on
self-reporting of hours raises the problem of accuracy and recall bias. Therefore further
in-depth analysis of case studies may offer additional insights. Second, the structure of the
survey does not permit the use of panel data techniques, which would provide a richer
analysis of the effort-performance relationship. Third, while providing rich source for
research exploration, a number of important variables for example ownership concentration or
industry-specific human capital are not present in our data which could indicate omitted
variables bias.
The study offers a number of directions for further research. First, further studies could be
undertaken to construct a database of the relationship over time. This would enable the
analysis to address issues such as the reaction of activity hours to poor, or good performance.
Lagged effects could also be analysed. Furthermore, the effect of studying hours on
performance might only be observed in the long run. Second, an interesting extension of our
work could involve exploring the effectiveness of the way in which time is allocated. It might
be a case, that working less but more efficiently has much greater effect on performance than
working more hours but being less efficient. This would offer potential insights into the need
for an effective work-life balance. Third, the analysis relates to China and it would be
instructive to see how far the relationships extend to other emerging economies. Fourth, an
assessment of entrepreneurial motivation might offer additional insights into the allocation of
time-performance relationship.
Acknowledgements
We thank Subasish Chowdhury and the Royal Economic Society 2013 conference
participants for valuable comments and suggestions. We also acknowledge the helpful
Endnotes
1Glaeser et al. (2002) argue that people who investment in human capital are also likely to invest in
social capital.
2The results for levels of hours are available on request.
3In addition to the logarithm of total sales we have also experimented with the natural logarithm of the
number of employees. The results are quantitatively similar to those reported in this work.
4 See also Fung et al. (2007) for a description of the same dataset.
5 We would like to thank an anonymous referee for this suggestion.
6 Ownership concentration could be another important characteristic to control for. Unfortunately, our
data source does not report any plausible proxies for this factor.
References
Abernethy M. A., J. Bouwens, and L. Van Lent. 2013. The Role of Performance Measures in the Intertemporal Decisions of Business Unit Managers, Contemporary Accounting Research
30 (3): 925-961.
Adler, P and S. Kwon. 2002. Social Capital: Prospects for a New Concept. Academy of
Management Review 27 (1): 17-40.
Anderson, R. A., J-H. Li, R.T. Harrison, and P.J.A. Robson. 2003. The Increasing Role of Small Business in the Chinese Economy. Journal of Small Business Management 41(3): 310-316.
Andres, C. 2008. Large Shareholders and Firm Performance - an Empirical Examination of Founding-family Ownership. Journal of Corporate Finance 14(4): 431-446.
Ang, J., R. Cole, and J. Lin, 2000. Agency Costs and Ownership Structure. Journal of
Finance 55: 81-106.
Baker, G. P. and B.J. Hall. 2004. CEO Incentives and Firm Size. Journal of Labour
Economics 22(4):767-798.
Bandiera, O., L. Guiso, A. Prat, and R. Sadun. 2011. What Do CEOs Do? Centre for Economic Policy Research Discussion Paper DP8235.
Bandiera, O., A. Prat, and R. Sadun. 2013. Managing the Family Firm: Evidence from
CEOs at Work. Harvard Business School Discussion Paper 14-044.
Becker, G. 1965. A Theory of the Allocation of Time. Economic Journal 75(299): 493-517.
Becker, G. 1975. Human Capital: A Theoretical and Empirical Analysis, with Special
Reference to Education. National Bureau of Economic Research, New York, NY.
Beffy, M., R. Blundell, A. Bozio, and G. Laroque. 2014. Labour Supply and Taxation with
Restricted Choices. IFS Working Paper, W14/04.
Bitler, M., T. Moskovitz, and A. Vissing-Jorgensen. 2005. Testing Agency Theory with Entrepreneur Effort and Wealth. Journal of Finance 60(2): 539-576.
Bliss, R.T. and N.L. Garratt. 2001. Supporting Women Entrepreneurs in Transitioning Economies. Journal of Small Business Management 39(4): 336–344.
Bosma, N., M. van Praag, R. Thurik and G. de Wit. 2004. The Value of Human and Social Capital Investments for the Business Performance of Startups. Small Business Economics
23(3): 227-36.
Coefficient variation. Econometrica 47: 1287-1294.
Burmeister-Lamp, K., M. Levesque, and C. Schade. 2012. Are Entrepreneurs Influenced by Risk Attitude, Regulatory Focus or Both? An Experiment on Entrepreneurs’ Time Allocation.
Journal of Business Venturing 27(4): 456-476.
Cao, J., Y. Ding, and H. Zhang. 2014. Social Capital, Informal Governance and Post IPO Firm Performance: A Study of Chinese Entrepreneurial Firms, Journal of Business Ethics
1-23.
Cassar, G. 2006. Entrepreneur Opportunity Cost and Intended Venture Growth. Journal of
Business Venturing 21(6): 610-632.
Chen, M.H., Y.Y. Chang, and C.Y. Lee. 2015. Creative Entrepreneurs' Guanxi Networks and Success: Information and Resource. Journal of Business Research 68(4): 900-905.
Chetty, R. 2012. Bounds on Elasticities With Optimization Frictions: A Synthesis of Micro and Macro Evidence on Labor Supply. Econometrica 80(3): 969-1018
Davidsson, P. and B. Honig. 2003. The Role of Social and Human Capital among Nascent Entrepreneurs. Journal of Business Venturing 18(3): 301-331.
Dickson, P.H., G.T. Solomon, and K. Weaver. 2008. Entrepreneurial Selection and Success: Does Education Matter?” Journal of Small Business and Enterprise Development 15(2): 239-258.
Du J. and S. Girma. 2012. Firm Size, Source of Finance, and Growth - Evidence from China.
International Journal of the Economics of Business 19(3): 397-419.
Ehrenberg, R. G., and R. Smith. 2000. Modern Labor Economics: Theory and Public Policy. Reading, MA: Addison Wesley.
Fafchamps, M. and B. Minten. 2002. Returns to Social Network Capital among Traders.
Oxford Economic Papers 54(2): 173-206.
Fama, E. F. and M. C. Jensen. 1983. Separation of Ownership and Control. Journal of Law
and Economics 26(2): 301-325.
Florén, H. 2006. Managerial Work in Small Firms: Summarising What We Know and Sketching a Research Agenda. International Journal of Entrepreneurial Behaviour and
Research 12(5): 272-288.
Florén, H. and J. Tell. 2012. Managerial Behaviour and Small Firm Performance, working paper, Centre for Innovation, Entrepreneurship and Learning, Halmstad University.
Fung, H., X. Xu, and Q. Zhang. 2007. On the Financial Performance of Private Enterprises in China. Journal of Developmental Entrepreneurship 12(4): 399-414.
Ganotakis, P. 2012. Founders’ Human Capital and the Performance in UK New Technology Based Firms. Small Business Economics 39(2): 495-515.
Glaeser, E., D. Laibson, and B. Sacerdote. 2002. The Economic Approach to Social Capital.
Economic Journal 112(8): F437-F458.
Goddard, J., M. Tavakoli, and J. Wilson. 2005. Determinants of Profitability in European Manufacturing and Services: Evidence from a Dynamic Panel Data. Applied Financial
Economics 15(18): 1269-1282.
Ham, J. and K. Reilly. 2002. Testing Intertemporal Substitution, Implicit Contracts, and Hours Restriction Models of the Labor Market using Micro Data. American Economic Review
92(4): 905-927.
Holmström, B. and J. Tirole. 1997. Financial Intermediation, Loanable Funds, and the Real Sector. Quarterly Journal of Economics 52: 663-692.
Hyytinen, A. and O. Ruuskanen. 2007. Time Use of the Self-employed. Kyklos 60(1): 105-122.
Jensen, M. C. and W. Meckling. 1976. Theory of the Firm: Managerial Behavior, Agency Costs and Ownership Structure. Journal of Financial Economics 3(4): 305-360.
Lee, D. Y. and E.W.K. Tsang. 2001. The Effects of Entrepreneurial Personality, Background and Network Activities on Venture Growth.”Journal of Management Studies 38(4): 583-602.
Levesque, M., D. Shepherd, and E. Douglas. 2002. Employment or Self-employment: A Dynamic Utility Maximizing Model. Journal of Business Venturing 17(3): 189-210.
Lewbel, A. 2012. Using Heteroscedasticity to Identify and Estimate Mismeasured and Endogenous Regressor Models. Journal of Business and Economic Statistics 30: 67-80.
Liu, J. 2012. The Dynamics of Listed SMEs in China. International Journal of the Economics
of Business 19(3): 421-450.
Lynskey, M.J. 2004. Determinants of innovative activity in Japanese technology-based start-up firms. International Small Business Journal 22(2): 159-196.
Malmendier, U. and G. Tate. 2009. Superstar CEO’s. Quarterly Journal of Economics 124(4): 1593-638.
Manolova, T.S. 2005. Builders and leaders: Six case studies of men and women small proprietors in the Bulgarian construction industry. In C.G. Brush, N.M. Carter, E. Gatewood, P.G. Greene, & M.M. Hart (Eds.), Growth oriented women entrepreneurs and their businesses:
McKendrick, D.C. and G.R. Carroll. 2001. On the Genesis of Organizational Forms: Evidence from the Market for Disk Arrays. Organization Science, 12(6): 661–682.
McKnight, P. and C. Weir. 2009. Agency Costs, Corporate Governance Mechanisms and Ownership Structure in Large Publicly Quoted Companies: a Panel Data Analysis. Quarterly
Review of Economics and Finance 49(2): 135-158.
Morris, M. and M. Schindehutte 2005. Entrepreneurial Values and the Ethnic Enterprise: an Examination of Six Subcultures. Journal of Small Business Management 43(4): 453-479.
National Bureau of Statistics of China (NBSC), 2013. China Statistical Year Book 2013. China Statistics Press, Beijing.
O’Gorman, C., S. Bourke, and J.A. Murray. 2005. The Nature of Managerial Work in Small Growth-oriented Small Businesses.”Small Business Economics 25(1): 1-16.
Robb, A.M. 2002. Entrepreneurial Performance by Women and Minorities: the Case of New Firms. Journal of Developmental Entrepreneurship 7(4): 383–397.
Robb, A. and J. Watson. 2012. Gender Differences in Firm Performance: Evidence from New Ventures in the United States. Journal of Business Venturing 27(5): 544-558.
Rose, C. 2005. Managerial Ownership and Firm Performance in Listed Danish Firms: in Search of the Missing link. European Management Journal 23(5): 542-553.
Serrasqueiro Z.S. and P.M. Nunes. 2008. Performance and size: empirical evidence from Portuguese SMEs. Small Business Economics 31(2): 195-217.
Sheng, S., K.Z. Zhou, and J.J. Li. 2011. The Effects of Business and Political Ties on Firm Performance: Evidence from China. Journal of Marketing, 75(1): 1-15.
Sturman, M. 2003. Searching for the Inverted U-Shaped Relationship between Time and Performance: Meta-Analyses of the Experience/Performance, Tenure/Performance, and Age/Performance Relationship. Journal of Management 29(5): 609-640.
Talavera, O., L. Xiong, and X. Xiong. 2012. Social Capital and Access to Bank Financing: The Case of Chinese Entrepreneurs. Emerging Markets Finance and Trade 48(1): 55-69.
Unger, J.M., A. Rauch, M. Frese, and N. Rosenbusch. 2011. Human Capital and Entrepreneurial Success: a Meta-Analytical Review. Journal of Business Venturing 26(3): 341-358.
Verheul, I., M. Carree, and R. Thurik. 2009. Allocation of productivity and time in new ventures of female and male entrepreneurs. Small Business Economics 33(3): 273-291.
Volery T., S. Muller, F. Oser, C. Naepflin, and N. del Rey. 2013. The Impact of Entrepreneurship Education on Human Capital at Upper-Secondary Level. Journal of Small
Business Management 51(3): 429-446.
Zenger, T.R. 1994. Explaining Organizational Diseconomies of Scale in R&D: Agency Problems and the Allocation of Engineering Talent, Ideas, and Effort by Firm Size.
Table 1: Descriptive statistics for estimation sample.
Mean s.d. Median
(1) (2) (3)
Main Variables
Return on assets 0.327 0.514 0.165
Management hours per day 6.816 2.365 7.000
Management hours per day divided by 24 0.284 0.099 0.292
Networking hours per day 3.847 1.928 4.000
Networking hours per day divided by 24 0.160 0.080 0.167
Study hours per day 1.559 0.900 1.000
Study hours per day divided by 24 0.065 0.038 0.042
Log(Age) 3.769 0.176 3.761
Log(Firm Age) 1.735 0.713 1.792
Log(Sales) 6.272 1.952 6.234
Management Experience 0.290 0. 454 0.000
Single-decision making 0.565 0. 496 1.000
Education 0.181 0.385 0.000
Female 0.125 0.331 0.000
Share of ownership 0.812 0.170 0.800
Instrumental Variables
Table 2: Correlation matrix.
Note: ***, ** and * indicate significant at 1%, 5% and 10% level, respectively.
1 2 3 4 5 6 7 8 9 10 11 12
ROA 1 1
Management
hours 2 0.002 1 Networking
hours 3 -0.063*** -0.438*** 1
Study hours 4 0.001 -0.099*** -0.017 1
Log(Age) 5 0.026 0.132*** -0.059*** 0.037* 1
Log(FirmAge) 6 0.018 0.056*** -0.013 0.065*** 0.257*** 1
Log(Sales) 7 0.066*** -0.002 0.113*** 0.101*** 0.125*** 0.281*** 1 Management
Experience 8 -0.001 -0.039** 0.071*** 0.054*** 0.171*** 0.021 0.128*** 1 Single-
decision making
9 -0.062*** -0.062*** 0.097*** 0.13*** -0.039* 0.007 0.29*** 0.05** 1
Education 10 -0.052** -0.064*** 0.067*** 0.113*** -0.088*** -0.036* 0.135*** 0.058*** 0.174*** 1
Female 11 0.017 0.061*** -0.099*** -0.014 -0.072*** -0.077*** -0.135*** -0.063*** -0.015 -0.001 1