Local Electronic and Atomic Structure of Ce
3þ-Containing Fluoride/Oxide
Determined by TEM-EELS and First-Principles Calculations
Ikuo Nishida, Kazuyoshi Tatsumi and Shunsuke Muto
Department of Materials, Physics and Energy Engineering, Nagoya University, Nagoya 456-8587, Japan
We investigated the local atomic and electronic structure around Ce in CeF3and Ce2O3by the combination analysis of F- and O-Kshell electron energy loss near edge structures (ELNES) and first-principles calculations. The energy width of the main edge structure depended on the interaction between Ce5dorbitals and the neighboring F/O atoms. Not only ELNES but also the reported emission and excitation spectra were qualitatively consistent with the electronic structures of density functional theory (DFT) calculations with HubbardUfor the Ce4f energy correction. Main factors determining the emission wavelength of the fluoride and Ce-doped oxides were discussed.
[doi:10.2320/matertrans.MC200828]
(Received November 26, 2008; Accepted January 23, 2009; Published March 25, 2009)
Keywords: trivalent cerium, electron energy-loss spectroscopy (EELS), first priciples calculation
1. Introduction
Ce3þ in solid-state materials exhibit various functional
properties. For example, CeF3and Ce3þ-doped oxides, such
as Y3Al5O12 garnet (YAG), are utilized for scintillating
and/or white light generating applications because of their
characteristic emission properties.1–5) Ce2Zr2O7{8 ordered
phases, which have efficient oxygen desorption/absorption properties, are used as catalytic promoters for reactions
cleaning automotive exhaust gases.6)These materials
proper-ties are closely related to the configurations of Ce4f-based
states. Ce5d-based states are also important for
photoem-ission because the emphotoem-ission is due to electron transition from
the lowest excited Ce3þ5dlevel to the ground 4f level.1)
Among the spectroscopic methods to probe these
elec-tronic structures, the Ce-M4;5near edge structures of electron
energy loss and x-ray absorption spectra (ELNES and XANES) have been known to change the intensity ratio of
M5 to M4 peaks according to the formal valency of Ce.7)
Recently, in addition to Ce-M4:5XAS, Ce 4f to 3dresonant
X-ray fluorescence (RXF) spectra have been used to inves-tigate the Ce valence in fluorides and oxides, combined with theoretical calculations based on Anderson’s impurity
mod-el.8,9) Although photoluminescence stimulated excitation
spectra in the ultraviolet and visible light range (UV-VIS)
provide information on unoccupied Ce5dstates, their spectral
structures have not been compared with first-principles calculations. As an alternative spectroscopic route, anion
K-edge ELNES/XANES, which reflect unoccupied anionp
-like states, can be interpreted by first-principles electronic structure calculations with relative success. Because the conduction bands are mainly composed of cationic orbitals, the spectral structures indirectly convey information on the
Ce5d states.
The present study investigates the electronic structure
around Ce3þby a combination of anion-KELNES and
first-principles calculations. A comparison between the typical
Ce3þ-containing materials CeF3 and Ce2O3 will exemplify
the relationship between the local structures around Ce3þand
the emission properties of the materials.
2. Methods
2.1 TEM-EELS measurement
A commercially available CeF3 powder was used for
EELS. The powder x-ray diffraction pattern was most
consistent with the reported profile of CeF3.10)The sample
was dispersed in ethanol and scooped onto a holey carbon microgrid supported by a copper mesh. Spectra were acquired with a Gatan Enfina 1000 EELS spectrometer attached to a Jeol JEM-200CX operated at an accelerating
voltage of 160 keV with a LaB6electron source. The energy
resolution at the zero loss peak was 0.7 eV and the energy dispersion was 0.2 eV/channel. In order to prevent electron
irradiation damage on the sample, we measured F-KELNES
using an acquisition time of 1 s. We measured 12 spectra at different sample areas. The spectra contained a significant level of noise, which was reduced by Pixon based
deconvo-lution.11,12)In this process, the corresponding low loss spectra
were used as a Point-Response Function (PRF). The restored spectra were summed with the main peak position aligned at the same energy so as to reduce the remaining statistical
noise. The absence of O-KELNES confirmed that there was
no significant oxidation on the measured areas. Our EELS
measurement on Ce2O3 was unsuccessful because of the
rapid oxidation of the sample during its transfer into the TEM.
2.2 Theoretical calculations
In order to theoretically calculate F- and O-K spectra
including their fine peak structures, we adopted a first-principles full-potential augmented plane waves plus local
orbital (APWþlo) method (WIEN2k13)) within the
frame-work of the general gradient approximation (GGA)14) and
GGAþU approach.15,16) In GGAþU, Coulomb
interac-tions among the localized electrons are corrected by the
HubbardU parameter.15)Its applications to ceria have been
reported by several authors.17,18)However, the choice ofUis
ambiguous, and it is not trivial to determine its valuea priori,
though there are attempts to extract it from standard
first-principles calculations. We selectedU¼5:0 and 2.5 eV for
Special Issue on Nano-Materials Science for Atomic Scale Modification
CeF3 and Ce2O3, respectively. These were the values that reproduced the experimental spectral features most
accu-rately. The value for Ce2O3 was reported to provide
reasonable agreement with experimental lattice constants
and formation energies.18)
As is well established, it is essential to take into account the core-hole effect in order to reproduce the spectral fine
structures of ELNES.19)We used supercells containing one
excited atom with a hole at the 1s state. The supercell for
CeF3was set to extend the cell vectors,asuper,bsuperandcsuper
asasuper¼ab,bsuper¼aþbcandcsuper¼aþbþc,
wherea,bandcare the primitive cell vectors. The supercell
vectors for the Ce2O3calculation were set to beasuper¼3a,
bsuper¼3b and csuper¼2c. These CeF3 and Ce2O3 super-cells contain 96 and 90 atoms, respectively, with a core hole
separated by more than 10 A˚ from the core-holed atoms in the
adjacent cells. The transition energy of the inner shell spectra was evaluated by the total energy difference between the core-holed supercell and non-core-holed supercell. The
details of the APWþlo calculations are as follows: the
Muffin-tin radius (RMT) of each atom was chosen to be as
large as possible in the cell, and RMTKMAX, which
corre-sponds to the plane wave cutoff, was set by using the product
of the smallest RMT and Kmax (3.0 Ry1=2). The
Monkhorst-Pack scheme20) was employed on a 222 mesh for k
-point sampling in the reciprocal cell. The transition proba-bilities were calculated within the electric dipole approx-imation. Final spectra were broadened by a Gaussian function with a FWHM of 1.0 eV.
In order to discuss the underlying difference between the
spectra of CeF3 and Ce2O3 in terms of atomic orbital
interactions, we adopted a first-principles molecular orbital
(MO) method21)based on the density functional theory (DFT)
in the local density approximation. In the MO calculations, we adopted the Slater’s transition state method, where 0.5 holes are introduced at the excitation shell and the transition energy is approximated by the energy differences between the eigenvalues of the core orbital with 0.5 holes and the unoccupied molecular orbitals. For a simple interpretation of the orbital interactions, a minimal atomic basis set,
Ce½1s2sp3spd4spd f5spd, F½1s2sp and O½1s2sp, was
adopted. Cluster models for the MO calculations contained approximately 90 atoms. The transition probabilities and final spectra were obtained in the same manner as in the
APWþlo calculations. Partial density of states (PDOS) and
overlap population diagrams (OPD)22)were calculated using
the same Gaussian broadening as the broadening for the theoretical ELNES. Since relativistic calculations including
spin-orbit coupling merely affected the theoretical anion-K
ELNES, we neglected its effects in our calculations.
2.3 Crystal structures and their theoretical optimization
CeF3 and Ce2O3 have trigonal symmetry of the space
groups P33c1 and P33m1, respectively. Prior to the spectral
calculations, all crystal parameters were optimized within
GGA and GGAþU band calculations. The projected
augmented-wave method23)was employed to reduce
compu-tational cost. The cutoff energy of the plane wave basis was
500 eV and443and774meshes were employed
for k-point sampling in the reciprocal cells of CeF3 and
Ce2O3, respectively. The optimized lattice parameters are
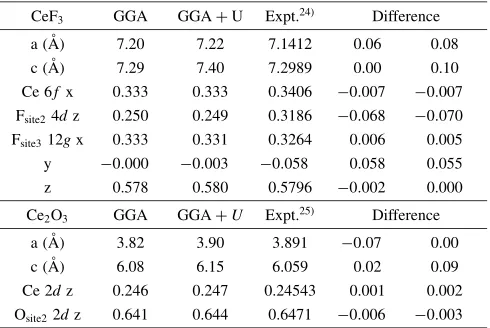
shown in Table 1. The lattice constants are consistent with
experimentally reported values to within 1%, which is a
typical GGA-based calculation accuracy. Internal parameters
specific to the space groups of CeF3 and Ce2O3 are also
presented in Table 1. For Ce2O3, the theoretical values
reproduced the experimental values fairly well. However, in the case of the two fluorine parameters, z and y of Wyckoff’s
notation 4d and 12gfor CeF3, there was significant
discrep-ancy between the theoretical and experimental values. The
reason for this is still unclear. We calculated F-K ELNES
using both of the crystal parameters. The relative intensities of the fine structures in the spectra differed from each other, though the main features of interest were obtained similarly by the two structures. For simplicity, we will hereafter show the results obtained using the theoretically optimized crystal parameters.
The crystal structures of CeF3and Ce2O3are illustrated in
Fig. 1. The trigonal cell of CeF3 contains one Ce site
surrounded by 11 F atoms. F occupies two 3-coordinated2a
and 4d sites (F2a and F4d), and one 4-coordinated 12g site
(F12g). F2aand F4d are almost on the sameabplanes. In the
experimental crystal structure, F4d is displaced along thec
axis and F12gis displaced parallel to theabplanes, according
to the internal parameters z and y. In Ce2O3, Ce occupies a
7-coordinated 2d site and O occupies 4-coordinated 1aand
6-coordinated 2dsites (O1a and O2d).
3. Results and Discussion
3.1 Anion K-shell ELNES of CeF3and Ce2O3
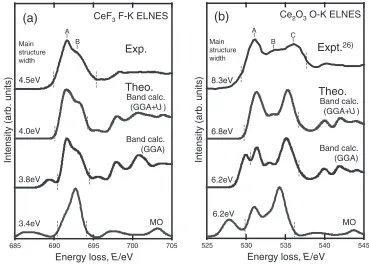
Figure 2 shows the experimental and theoretical F- and
O-KELNES. In the experimental spectra, the energy widths
of their main structures, including the large peak A and its
shoulder B for F-K and three broad peaks A, B and C for
O-K, exhibit distinct differences. The energy widths are 4.5
and 8.3 eV, respectively, for the F- and O-K spectra, which
were evaluated from the peak distance between the maxima of the second differentiated spectra that appeared in the lowest and highest ends of the main structures.
The GGAþUscheme reproduced the experimental peak
[image:2.595.305.550.94.258.2]profiles well, while the GGA withoutU presented an extra
Table 1 Comparison of the crystal parameters between the present calculation and the reported experimental values.
CeF3 GGA GGAþU Expt.24Þ Difference
a (A˚ ) 7.20 7.22 7.1412 0.06 0.08
c (A˚ ) 7.29 7.40 7.2989 0.00 0.10
Ce 6f x 0.333 0.333 0.3406 0:007 0:007
Fsite24dz 0.250 0.249 0.3186 0:068 0:070
Fsite312gx 0.333 0.331 0.3264 0.006 0.005
y 0:000 0:003 0:058 0.058 0.055
z 0.578 0.580 0.5796 0:002 0.000
Ce2O3 GGA GGAþU Expt.25Þ Difference
a (A˚ ) 3.82 3.90 3.891 0:07 0.00
c (A˚ ) 6.08 6.15 6.059 0.02 0.09
peak at the lower energy side. Because the Hubbard U
incorporated into the Ce 4f orbitals corrects the Coulomb
repulsion of Ce 4f electrons at each site within the
one-electron approximation, the extra peak is due to
under-estimation of the Ce 4f states energies. Since the other fine
structures are quite similar irrespective ofU incorporation,
the chemical bonding behind the experimental spectral profiles can be roughly interpreted on the basis of
calcu-lations without the Hubbard U. Although the MO
calcula-tions reproduced the peak profiles less accurately than the
GGA and GGAþUband methods, the main structures in the
F- and O-K spectra quantitatively reproduced the energy
widths of 3.4 and 6.2 eV, respectively, in agreement with the experimental trends.
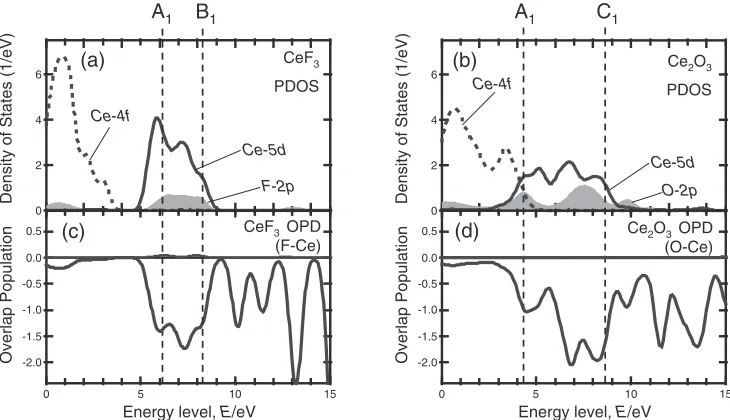
3.2 Atomic orbital interactions in the unoccupied states of CeF3 and Ce2O3
The main peaks of the F-K spectrum in CeF3 are much
narrower than those of O-K in Ce2O3. This trend is seen in
both the experimental and theoretical spectra. In order to reveal the difference in terms of chemical bonding, the
unoccupied PDOS of CeF3 and Ce2O3 are shown in
Figs. 3(a) and 3(b), and the OPD between Ce and its neighboring F and O in (c) and (d), respectively, for the
2.69Å
2.34Å
2.43Å
Ce
O2d
O1a
2.39Å 2.40Å
2.71Å 2.71Å
Ce
F2a F12g
F4d
a)
b)
c)
d)
b’)
CeF
3Ce
2O
3Fig. 1 Crystal structures of CeF3and Ce2O3. Cerium coordination is shown in (a) and (c) for theoretically optimized structures of CeF3 and Ce2O3. Unit cells are shown in (b), (b0) and (d) for the theoretically optimized and experimental structures of CeF3and theoretically optimized structure of Ce2O3. Anions occupying different sites are differently colored.
Intensity (arb. units)
705 700
695 690
685
Energy loss, E/eV
Intensity (arb. units)
545 540
535 530
525
Energy loss, E/eV
Expt.
26)Theo.
CeF3F-K ELNESBand calc. (GGA+U) Ce2O3O-K ELNES
Exp.
Theo.
Main structure width
3.4eV 4.5eV
3.8eV 4.0eV
6.2eV 6.2eV 6.8eV 8.3eV
(a)
(b)
A B
A
B C
Band calc. (GGA+U)
Band calc. (GGA) Band calc.
(GGA)
MO MO
Main structure width
[image:3.595.85.505.74.271.2] [image:3.595.112.481.331.595.2]non-core-holed, ground state electronic structures of the MO calculations. The Fermi level is set to zero in each figure. The
main peak structures of the ELNES correspond to the Ce5d
-derived states, which range from 5 to 9 eV above the Fermi
level for CeF3 and from 3 to 9 eV for Ce2O3, as shown in
Figs. 3(a) and 3(b). Since the intensities of those OPD are negative, the corresponding interactions between the Ce and
anion atoms are all antibonding in nature. In CeF3(Fig. 3(c)),
the low- (6eV) and high-energy (8eV) states show
similar negative OPD intensities. In Ce2O3 (Fig. 3(d)), the
low-energy (4eV) states show much weaker negative OPD
intensities than the high-energy (8eV) states. Larger OP
intensities correspond to larger spatial overlaps between the two molecular orbitals, which in turn promote higher
antibonding energy levels.27) The spatial overlaps between
the Ce5dand the anion orbitals show a wider variation in the
Ce5d-derived states in Ce2O3than in CeF3, which results in
the larger energy width of Ce5d PDOS and the main peak
structures in the ELNES.
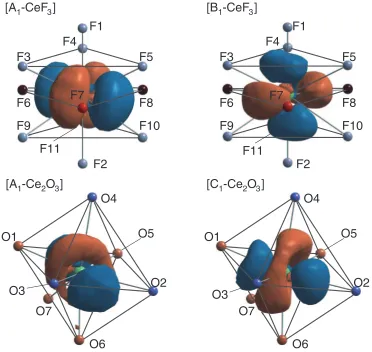
3.3 Orientation of Ce5d orbitals with respect to the nearest neighbor anions
Let us examine the energy width differences in Ce5d
-derived states in an alternative way, namely, by visualizing
the orientation relations of Ce 5dorbitals with respect to the
nearest neighbor anions, which allows us to obtain an intuitive understanding of the features. Figure 4 shows the
wavefunction isosurfaces of the representative Ce5d-derived
states in the MO calculations, whose energy levels are indi-cated in Fig. 3. The isosurfaces are shown up to a distance of
1.85 A˚ from the Ce site so as to reveal the relative orientation
of the Ce5d orbital with respect to the nearest neighbor
anions. In CeF3, one of the four radial principal axes of the A1
state orbital points approximately towards the F6 atom, while none of the other three axes indicate any of the other 10 nearest neighbor anions. Three of the four B1 state orbital principal axes extend, respectively, towards F1, F2 and F8, while the last one does not point to any of the other 8 anions.
In Ce2O3, the main principal axis of the Ce5d orbital at
the low-energy state A1 points toward none of the nearest
O atoms, but lies on the O1-O3-O2-O5-O1 plane with the toroidal mother line parallel to the O1-O3 and O2-O5 ridgelines. On the other hand, the convex directions of the
high-energy state C1 orbital point approximately to the six
nearest O atoms except O7.
The above-mentioned features again suggest that the
spatial overlaps between Ce5d and the nearest neighbor
anion orbitals are much smaller (larger) at the lower (higher)
energy A1 (C1) states in Ce2O3. Thus, the large variation of
the spatial overlaps results in the larger energy width of
Ce5d-derived states in Ce2O3.
The Ce5dorbitals of A1and C1in Ce2O3show shapes very
similar to the t2gand egdatomic orbitals, respectively, under
the Oh symmetry field. By contrast, the Ce in fluoride is
coordinated by many more anions whose relative positions are incompatible with the principal axis directions of the
Ce5d orbitals, and whose shape looks more like d orbitals
under the spherical symmetry field. Thus, we can say that
the Oh-like crystal field gives rise to a larger splitting of
the Ce5d states in Ce2O3 than the sphere-like crystal field
in CeF3.
3.4 Energy gap between Ce5d-4f states and related physical properties
CeF3 is used in scintillators because of its ultraviolet
fluorescence with a short decay time.1–3)Ce3þ-doped oxides
such as YAG have not only been studied for scintillator
applications because of their yellow fluorescence,4)but also
because their phosphorescence properties are believed to make them promising candidates for white light emission devices, coupled with highly efficient light emitting diodes
(LED).5)The light emissions of fluoride and oxides are due
to the transition from the lowest excited Ce3þ 5d level to
the ground 4f level. In calculations within the one-electron
approximation with the Hubbard U correction for 4f
electrons, the relative energy difference between the
local-6
4
2
0
Density of States (1/eV)
6
4
2
0
Density of States (1/eV)
Ce-4f
Ce-5d
CeF3
PDOS
F-2p A1 B1
(a)
Ce-4f
Ce-5d
Ce2O3
PDOS
O-2p
Ce2O3OPD (O-Ce)
A1 C1
(b)
CeF3OPD (F-Ce)
(c) (d)
-2.0 -1.5 -1.0 -0.5 0.0 0.5
Overlap Population
15 10
5 0
Energy level, E/eV -2.0
-1.5 -1.0 -0.5 0.0 0.5
Overlap Population
15 10
5 0
Energy level, E/eV
[image:4.595.115.480.74.284.2]ized Ce 4f level and the bottom of the unoccupied Ce 5d states would roughly correspond to the emission energy.
Figure 5 shows the density of states near the 4f-5d gap,
calculated with the GGAþUscheme. The fluoride shows a
much larger 4f-5dgap than the oxide, which is qualitatively
consistent with the experimental emission energies (CeF3:
4.4 eV;2)Ce-doped YAG: 2.4 eV4)). It should be noted that
the theoretical band gap between the unoccupied Ce5d and
valence bands would be systematically smaller than the experimental values. This is a well known deficiency of DFT.
Indeed, our theoretical value for CeF3 is 7 eV, which is
smaller than the experimental10eV.1)
In the theoretical DOS, the 4f-5d gap energy is thought
to mainly depend on two factors. One is the energy width
of the Ce5d states due to the crystal field splitting. The
other is Hubbard U, which splits the occupied and
unoccupied Ce4f states in theoretical DOS. The former
presumably depends on the local environment around Ce, as discussed in the previous sections. Experimental UV-VIS excitation spectra provided information on the unoccupied
F1
F2
F3
F4
F5
F6
F7
F8
F11
F10
F9
O3
O1
O6
O5
O7
O2
O4
[A
1-CeF
3]
[B
1-CeF
3]
[A
1-Ce
2O
3]
[C
1-Ce
2O
3]
F1
F2
F3
F4
F5
F6
F7
F8
F11
F10
F9
O4
O3
O2
O1
O6
O5
O7
Fig. 4 Isosurface plots of wavefunctions around Ce for the energy levels A1, B1, C1in Fig. 3. Atoms are colored in the same manner as in Fig. 1. O7 is identical to the oxygen atom bonded to Ce with a bond length of 2.43 A˚ in Fig. 1.
Ce-5d 5
CeF3
GGA+U PDOS
(a)
1412
10
8
6
4
2
0
Density of states (1/eV)
10 8 6 4 2 0 14
12
10
8
6
4
2
0
Density of states (1/eV)
10 8 6 4 2 0
Energy level, E/eV Ce-4f
Ce2O3
GGA+U PDOS
(b)
Ce-4f
Ce-5d 5
Energy level, E/eV × ×
[image:5.595.112.484.73.425.2] [image:5.595.114.483.476.627.2]Ce5d states; the energy widths of Ce5d for CeF3 and
Ce-doped YAG are estimated to be 2.32) and 6.94)eV,
respectively, which are consistent with the widths of the
Ce5d DOS in Figs. 5(a) and 5(b). Concerning the latter
factor, when we compared the calculation results for the
same compound with U¼5:0and 2.5 eV, the Ce4f energy
position was shifted by 1.2 eV, approximately half the
difference in theU values. On the other hand, the different
U value merely shifted the Ce5d position with respect to
the valence bands.
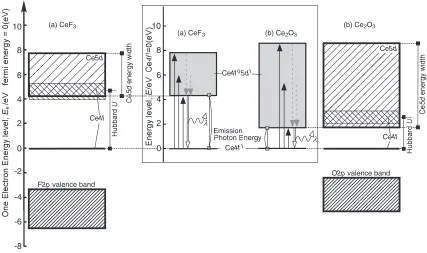
The effects of these two factors, Hubbard U and Ce5d
energy width, on the light emission properties are schema-tized in Fig. 6. In the one-electron energy level diagrams,
the conduction bands, mainly composed of the Ce5d, and the
valence bands, mainly composed of the anion 2p, are
represented by rectangles with energy widths reflecting the
GGAþUcalculation results. The unoccupied Ce4f DOS is
also schematized so as to express the Ce4f split by the
Hubbard U. The energy levels of the photoemission-related
configurations, Ce4f1 and Ce4f05d1, are inserted for better
understanding. The luminescent photon energy corresponds
to the energy between the Ce4f1 level and the bottom of
the Ce4f05d1 levels. The unoccupied Ce4f states in the
one-electron energy level diagrams could correspond to the
Ce4f2þCe4f0 configuration, which can be neglected for
the photon emission, because the transition probabilities
between Ce4f2þCe4f0 and Ce4f1 (or Ce4f05d1) would
be much lower than those between Ce4f1 and Ce4f05d1.
Since the Ce5d energy width, rather thanU, depends more
strongly on the local environment around Ce3þ, a
modifi-cation of the local atomic arrangement, e.g., by co-doping other cations, could tune the emission photon energy suitable
for specific optical applications by changing the Ce5d
bandwidth.
4. Summary
We have investigated the local electronic structure around
Ce3þ by comparing the experimental EELS and theoretical
first-principles electronic structure of two typical Ce3þ
-containing materials: CeF3 and Ce2O3. The main results can
be summarized as follows:
(1) F- and O-KELNES including their fine structures were
mostly reproduced by GGAþU calculations. The
calculations without Hubbard U resulted in an extra
peak on the lower energy side of the edge threshold. This was ascribed to incorrect evaluation of the
Coulomb interaction between Ce 4f electrons.
(2) Except for the extra peak described above, all the calculations and experimental results showed a com-mon trend: the energy width of the main spectral
structure was much broader in O-K of Ce2O3 than in
F-Kof CeF3. This is due to the Ce5dorientations with
respect to the nearest neighbor anions. In Ce2O3, the
geometry of the nearest neighbor O atoms is compatible
with the symmetry of the Ce5d orbital, resulting in a
much larger crystal field splitting of the Ce5d-derived
states.
(3) The calculated Ce5d energy widths and energy gaps
between the occupied Ce 4f level and the bottom of
the unoccupied Ce 5d states for the fluoride and oxide
were qualitatively consistent with the reported
exper-imental UV-VIS spectra. The Ce5denergy width could
be tuned for specific optical applications, for example, by doping the host crystal with different cations.
Acknowledgements
The present work was supported in part by Grants-in-Aid F2pvalence band
O2pvalence band
(a) CeF3 (b) Ce2O3
Ce4f1
Ce5d Ce5d
10
8
6
4
2
0
-2
-4
-6
-8
Ce4f
8
6
4
2 10
Ce4f05d1
(a) CeF3 (b) Ce2O3
Ce4f λ
λ Emission
0
[image:6.595.83.510.74.327.2]for Scientific Research of MEXT Japan (Priority Area (#474) ‘‘Atomic Scale Modification’’) and JSPS (Young Scientists B: 18760493 and Kibankenkyu A: 17206063).
REFERENCES
1) E. Auffrayet al.: Nucl. Instrum. Methods Phys. Res. A383(1996) 367– 390.
2) C. Dujardin, C. Pedrini, N. Garnier, A. N. Belsky, K. Lebbou, J. M. Ko and T. Fukuda: Opt. Mater.16(2001) 69–76.
3) R. L. Nigro, G. Malandrino, I. L. Fragala, M. Bettinelli and A. Speghini: J. Mater. Chem.12(2002) 2816–2819.
4) Y. Dong, G. Zhou, J. Xu, G. Zhao, F. Su, L. Su, G. Zhang, D. Zhang, H. Li and J. Si: Mater. Res. Bull.41(2006) 1959–1963.
5) M. Kottaisamy, P. Thiyagarajan, J. Mishra and M. S. Ramachandra Rao: Mater. Res. Bull.43(2008) 1657–1663.
6) H. Muraki and G. Zhang: Catal. Today63(2000) 337–345. 7) S. Arai, S. Muto, T. Sasaki, K. Tatsumi, Y. Ukyo, K. Kuroda and
H. Saka: Solid State Commun.135(2005) 664–667.
8) H. Ogasawara, A. Kotani, K. Okada and B. T. Thole: Phys. Rev. B43
(1991) 854–859.
9) S. M. Butorin, D. C. Mancini, J.-H. Guo, N. Wassdahl, J. Nordgren, M. Nakazawa, S. Tanaka, T. Uozumi, A. Kotani, Y. Ma, K. E. Myano, B. A. Karlin and D. K. Shuh: Phys. Rev. Lett.77(1996) 574–577. 10) ICDD, International Center for Diffraction Data, 12 Campus Blvd.,
(Newton Square, Pennsylvania USA, 1995) 19073–3723.
11) S. Muto, R. C. Puetter and K. Tatsumi: J. Electron Microscopy55
(2006) 215–223.
12) S. Muto, K. Tatsumi, R. C. Puetter, T. Yoshida, Y. Yamamoto and Y.
Sasano: J. Electron Microscopy55(2006) 225–230.
13) P. Blaha, K. Schwarz, G. K. H. Madsen, D. Kvasnicka and J. Luitz: WIEN2K, An augmented plane wave + local orbitals program for calculating crystal properties, ed. by K. Schwarz, T. Wien, (Austria, 2001) ISBN 3-9501031-1-2.
14) J. P. Perdew, S. Burke and M. Ernzerhof: Phys. Rev. Lett.82(1999) 2544.
15) V. I. Anisimov, I. V. Solovyev, M. A. Korotin, M. T. Czyzyk and G. A. Sawatzky: Phys. Rev. B48(1993) 16929.
16) S. L. Dudarev, G. A. Botton, S. Y. Savrasov, C. J. Humphreys and A. P. Sutton: Phys. Rev. B57(1998) 1505.
17) D. A. Andersson, S. I. Simak, B. Johansson, I. A. Abrikosov and N. V. Skorodumova: Phys. Rev. B75(2007) 035109.
18) C. Loschen, J. Carrasco, K. M. Neyman and F. Illas: Phys. Rev. B75
(2007) 035115.
19) I. Tanaka, T. Mizoguchi and T. Yamamoto: J. Am. Ceram. Soc.88
(2005) 2013–2029.
20) H. J. Monkhorst and J. D. Pack: Phys. Rev. B13(1976) 5188. 21) H. Adachi, M. Tsukada and C. Satoko: J. Phys. Soc. Jpn.45(1978) 875. 22) T. Mizoguchi, K. Tatsumi and I. Tanaka: Ultramicroscopy106(2006)
1120–1128.
23) G. Kresse and D. Joubert: Phys. Rev. B59(1999) 1758. G. Kresse and J. Furthmuller: Phys. Rev. B54(1996) 11169.
24) J. X. Mi, J. C. Shen, B. M. Pan and J. Liang: Diqiu Kexue21(1996) 63–67.
25) G. Schiller: J. Less. Common Met.110(1985) 385–390.
26) L. A. J. Garvie and P. R. Buseck: J. Phys. Chem. Solids60(1999) 1943–1947.