Munich Personal RePEc Archive
Socio-economic differentials in
intergenerational educational mobility
among women in India
Choudhary, Akanksha and Singh, Ashish
SJM School of Management, Indian Institute of Technology Bombay,
Mumbai, India
4 October 2016
Online at
https://mpra.ub.uni-muenchen.de/76442/
Socio-economic differentials in intergenerational educational mobility among women
in India
Akanksha Choudhary1*, Ashish Singh1
1 SJM School of Management, Indian Institute of Technology Bombay, Mumbai, India
Abstract
A few studies have related daughters’ education to their fathers in India but there is little to no evidence when it comes
to intergenerational relation between daughters and mothers’ education. Using India Human Development Survey 2011-12, we investigate intergenerational educational mobility for women (15-49 years) (vis-à-vis their mothers).
We have used mobility matrices/measures for the estimation. Findings indicate that intergenerational educational
mobility at the all-India level is about 0.69, that is, 69% of the women acquire a level of education different from their
mothers. Of the overall mobility, about 80% is contributed by upwards mobility whereas the rest is downwards.
Mobility is greater in urban areas and is highest among the socially advantaged “Others” (or upper) caste group. Also,
the upwards component is substantially lower for socially disadvantaged groups compared to Others. Further, there
are large inter-regional variations, with situation being worst in the central and eastern regions which comprise of the
underdeveloped states of India. Moreover, mobility (overall and upwards) increases consistently as one move up the
income distribution. Furthermore, income is not able to neutralize the caste based gaps in overall mobility as overall
mobility among the Others of the poorest income group is more than the overall mobility among Scheduled
Castes/Tribes of the richest income group.
1. Introduction
“If you educate a man you educate an individual, but if you educate a woman you educate a household” (Sierra
2013). The above statement in some sense explains the significance of educating women in any society. Of late
research, has shown that, if a mother is educated it has substantial effect on education, health and other aspects of
development of children (UNICEF 2015). A mother’s education thus forms one of the most basic pillars of the
development of a society as a whole.
It has been said that images shape aspirations and native people become the images of teachers, principals,
coaches, experts, and role models in provincial educational systems for a child and his/her learning and aspirations
necessity while a girl’s education is known to be a luxury which not everyone can afford (Choudhary and Singh 2016; NCWE 1959).
A good education for children in any society is not only important from normative point of view but also leads to
economic returns. Existing evidence shows that, on an average, each additional year of education boosts a person’s
income by 10 per cent and increases a country’s gross domestic product (GDP) by 18 per cent (UNICEF 2015). Some
researchers estimate that if every child learned to read, around 170 million fewer people would live in poverty. Also, the benefits of girls’ education extend to their own children who are often healthier and more educated because their mothers went to school (UNICEF 2015). Further, educated mothers often participate in household decisions and they
have higher bargaining power resulting into better education for their daughters (Chudgar 2011; Schultz 2002; Singh
et al. 2013; Tansel 2002). Advantages of women’s education are now well known; still the extent of women education
is much lower than men in India (Singh 2014). Women contribute nearly fifty percent of the India’s population but
their contribution in education and income generating activities is much lower (Singh 2012a). Therefore, it is
important to study the improvements and advancements in girls’ education in India.
Immediately after independence various reforms started to improve levels of education among women in India.
Several committees were formed and programs were launched, such as – “National Committee for Women
education”, “Hansa Mehta committee”, “Bhaktavatsalam committee”, “Kothari Commission”, “Sarva Shiksha
Abhiyan”– dedicated to cater the educational needs of women in the country (Kaur 2013). While improvements in
educational access have made some impact on improving girls’ access to education, there are fundamental systemic issues that constrain progress towards gender equality in education (CREATE 2008a, b, 2009).
As education of women as children depends a lot on their mothers’ education, if women start with lower educational attainment (and society suffers from severe gender discrimination), then lower educational attainment
among women will either tend to persist over generations or there will be incremental improvements in educational
attainment of women over generations (Choudhary and Singh 2016). That said it is important to have a more careful
look at the existing studies on whether mothers’ and daughters’ education are interrelated. A careful search reveals
that there are indeed a few studies which have manifested that children’s educational attainments, especially
daughters’, are directly related to that of their mothers’ (Behrman et al.1999; Choudhary and Singh 2016; Chudgar 2009; Comi 2004; Lam and Duryea 1999; Lillard and Willis 1994; Peter and Sahn 1999).
Consequently, this paper examines the intergenerational educational mobility for women (15-49 years) in India
with a special focus on socioeconomic differentials. While doing so a nationally representative dataset which covers
all the states and union territories of India except Andaman and Nicobar Islands and Lakshadweep Islands is used.
Examination has been done by – rural/urban areas, geographical regions, social groups, income groups and their
interaction as well. The paper also separates the overall intergenerational educational mobility into upwards and
downwards mobility. Separation of overall mobility into the downwards and upwards components gives a bird’s eye
view of whether women are performing better than their mothers or not, as far as their educational attainments are
concerned. India has been chosen for the present study because, first, even after various initiatives by government to
women are still a discriminated or second gender in India; and finally, the scholarship on this subject is rather limited
in India.
The present study finds that the overall mobility at the all-India level is about 0.69. It is constituted by 80%
upwards component and 20% downwards. Overall mobility for urban areas is greater that of rural areas. The overall
mobility is highest among the socially advantaged “Others” caste group (the upper castes). Also, the upwards
component is substantially lower for socially disadvantaged groups compared to “Others” group. It is also observed
that there are large inter regional variations, with situation being worst in the central and eastern regions which
comprise of the most deprived (in terms of economic and demographic characteristics) states of India. Further, the
overall mobility (and its upwards component) increases consistently as one moves from the lower parts of the income
distribution to the upper parts of income distribution. Moreover, income is not able to neutralize the caste based gaps
in overall mobility as overall mobility among the Others in the poorest income group is more than the overall mobility
among SCs or STs in the richest income group.
Given the above, the outline of the paper is as follows: in the next section a brief literature review is presented;
and in the one after that, data is described. These are followed by Section 4, which documents the methods and
measures used in the analysis. Results are presented in Section 5 and Section 6 concludes the paper with some
ensuing discussion.
2. Literature review
The scholarship on Intergenerational educational mobility in India is quite limited. There are a few studies done
but they are mostly limited to men and mainly explore mobility in son-father pairs. A critical review of these studies
is presented below:
Hnatkovska et al. (2012) have investigated intergenerational educational, occupational and income mobility
among males (male household heads and their male children/grandchildren) using the various rounds of nationally representative “National Sample Surveys (NSS)”. As this study is limited to males, nothing can be deduced regarding the extent of intergenerational educational mobility among women. Majumder (2010) has also looked into
intergenerational educational mobility using NSS data from the 1993 and 2004 rounds, and has severe limitations
related to sample selection. First, it includes less than 20 per cent of the eligible sample in the analysis in both the
rounds (see Choudhary and Singh 2016 for details); therefore, its estimates for girls/daughters have to be taken with a
bit of caution (Majumder 2010, p. 469). Second, the study also does not include married women in the analysis.
Jalan and Murgai (2008) has used National Family Health Survey (NFHS) (1998–1999) and notes that National
Family Health Surveys are not suitable for study of intergenerational mobility, especially for women. The reason
being the parental education is known only for child-parent pairs which were living in the same household at the time
of survey. Given the extent of low age marriages in India, the women aged 15 years or above are mostly either the
daughter-in-law or wife of household heads’, a group for which parental education cannot be obtained from the
One study which is relevant in the present context is Choudhary and Singh (2016) which has studied
intergenerational educational mobility among young women in India using mother daughter pair. The above study
suffers from the following limitations: first, it includes only young women aged15-24 years in the study; second it is
limited to only six Indian states. Furthermore, Choudhary and Singh (2016) might suffer from underreporting of
upwards mobility, because women (in the age group 15-24) who were in school or college at the time of survey were
not included in the analysis. So, all the women who were in higher studies (say, college) but whose mothers would
have completed lesser years of schooling were dropped from the sample resulting in underestimation of upwards
mobility. In addition, Choudhary and Singh (2016) has not looked into how mobility varies across the income classes
or how mobility across different social groups varies over income classes.
The above review shows that, the scholarship on intergenerational educational mobility among women in India is
quite limited primarily due to unavailability of appropriate data. That said the present paper examines
intergenerational mobility in education for women aged 15-49 (with respect to their mothers) using a large and
nationally representative data set.
3. Data and Methods
3.1. Data description
The data is taken from the India Human Development Survey (IHDS) 2011-12. This survey is a nationally
representative, multi-topic survey of 42,152 households across India. These households are spread across 33 states
and union territories, 384 districts, 1420 villages and 1042 urban blocks located in 276 towns and cities. The survey
covers all states and union territories of India with the exception of the islands of Andaman/Nicobar and
Lakshadweep. Two one-hour interviews in each household covered health, education, employment, economic status,
marriage, fertility, gender relations, and social capital. The IHDS was jointly conducted by University of Maryland
and the National Council of Applied Economic Research (NCAER), New Delhi (Desai et al. 2015). In addition to
the household and individual questionnaires, IHDS 2011-12 includes village, school, and medical facility surveys.
Extensive Census data were also merged for contextual analyses at the village, district, and state levels. Within the household survey, several sections also focused on the household’s connections to the wider community (Desai et al., 2015).
The survey was carried out in face-to-face interviews in seven modules covering (1) socio-economic condition of
the household including income, employment, educational status, consumption expenditure, and social capital; (2)
interview with one ever-married woman aged 15-49 years per household was conducted regarding health, education,
fertility, family planning, marriage, and gender relations; (3)interview with youth in the households aged 15-18 years
was also conducted regarding education, employment, marriage, life skills, future planning, friendship and risky
confidential behaviors; (4) further, short reading, writing, and arithmetic knowledge tests for children aged 8-11 and
youth aged 15-18 years in the household were administered; (5) moreover, height and weight measurement of
addition, facilities assessment of one government and one private primary school as well as a primary health care
facility in the community was conducted; (7) furthermore, village questionnaire assessing employment opportunities
and infrastructure facilities in the village was administered (Desai et al., 2015).
The survey instruments were translated into 13 Indian languages and were administered by local interviewers.
The fieldwork was carried out by 20 collaborating institutions under the supervision of the National Council of
Applied Economic Research (NCAER), New Delhi. Fieldwork began in November 2011 and was almost completed
by October 2012 (Desai et al., 2015).
The 15-49 years aged ever married women (one from each household) from the 42, 152 households form the
sample for analysis in this paper. Information regarding their schooling and schooling of their mother is used for
generating the estimates presented in this paper. The total sample size comprises of 39,395 women from every nook
and corner of India. The actual sample is smaller than 42,152 because some households did not have any ever married
woman in the age group 15-49 years, in addition, those ever married women who were studying at the time of survey
are not included in the analysis sample. Appropriate sampling weights are used to derive the estimates at national and
regional levels. The details of the sampling weights are given in the survey report (Desai et al., 2015).
The survey captures education of women and their mothers in terms of completed years of schooling. Using the
years of schooling and the various mile stones of educational attainment in the Indian schooling system, we have used
the following categorization: no formal schooling (1); 1-4 years of schooling [schooling less than primary] (2); 5-7
years of schooling [completed primary but less than middle school] (3); 8-9 years of schooling [completed middle
school but less than secondary] (4); 10-11 years of schooling [completed secondary but less than higher secondary]
(5); 12-14 years of education [completed higher secondary but not completed graduation] (6); 15 or more years of
education [completed graduation and more].
3.2. Methodology and measures
We have used mobility matrices and mobility measures for estimating intergenerational educational mobility
among women.
3.2.1 Educational mobility matrices
To demonstrate the percentages of women who belong to the various educational categories corresponding to their mothers’ educational category, educational transition or mobility matrices have been used. These percentages give the conditional probabilities, i.e., the probability that a daughter will have certain levels of education given that
her mother has certain levels of education. The diagonal values signify no mobility in levels of education between
mother and daughter. When all the diagonal values are one, it represents perfect immobility. Conversely, if all the
diagonal values are zero, it is a case of perfect mobility.
In addition to showing mobility by matrices, we have also used two mobility measures. We could have used other
there are problems of potential endogeneity of explanatory variables, inadequate or misleading proxies for relevant
variables and omitted variable bias (refer Motiram and Singh 2012, p.62 for a detailed discussion). Also regression would fail to capture the distance between daughters and mothers’ levels of education. So, rather than using regressions, we have used mobility measures which have been specifically developed to understand and examine
intergenerational mobility and which do not suffer from the shortcomings associated with multiple regression
techniques (Formby et al. 2004; Motiram and Singh 2012; Shorrocks 1978; Sommers and Conlisk 1979; Van De Gaer
et al. 2000).
3.2.2. Mobility measures
We now present the mobility measures which originated in the sociology literature and are commonly used for
the study of intergenerational mobility.
First mobility measure: M1
M1 is the probability that a daughter (or expected proportion of the daughters) will have an educational category
different (may be lesser or more) from her mother. It can also be interpreted as the normalized distance between the
transition matrix and the identity matrix of order m (Motiram and Singh 2012, p. 62). The case of identity matrix
shows perfect immobility where all the diagonal values are 1, that is, whatever the educational category of the mother
be, the daughter falls in the same category (that is, with probability one). Using the notations from Motiram and Singh
(2012); let pij(i,j = 1,…,m) be the value in the ith row and jth column of the transition matrix (T), that is, the probability
that the daughter’s educational category is jgiven that her mother’s educational category is i; m is the number of
categories.
The first mobility measure, M1 is:
𝑀1=𝑚1∑ ∑𝑚𝑗=1𝑃𝑖𝑗 𝑗≠𝑖 𝑚
𝑖=1 = (1 −𝑚1∑𝑚𝑖=1𝑃𝑖𝑗) (1)
This measure has a limitation in the sense that it only looks at whether the daughter leaves the mother’s education
category or not without taking into account the “distance” between the education categories of the mother and
daughter.
Second mobility measure: M2
As discussed above, M1 has a limitation that it only takes into account whether the daughter leaves the mother’s
education category without taking into account how far the daughter’s educational category from the mother’s
educational category is. This limitation is overcome in the second mobility measure, M2 which is discussed below.
The total number of transitions possible between education of a mother and a daughter are m(m-1). Also, for a
given education of the mother (i), the expected distance between the levels of education of the mother and daughter
is∑𝑚𝑗=1𝑃𝑖𝑗|𝑖 − 𝑗|.
It is important to note that the mobility measures M1 and M2 capture the overall mobility but fall silent when it
comes to the estimation of upwards and downwards mobility. Upwards mobility is desirable for any society, as it
shows the chances of daughters getting an education higher than their mothers. On the other hand downwards
mobility is the probability that the daughters will have lower education than their mothers, which is undesirable.
Evidence on upwards (and downwards) mobility is important because there is always a possibility that the mobility
measure, for example, M1is very high indicating a high level of mobility in a society but the mobility could be
predominantly downwards mobility (i.e., daughters are acquiring lower education than that of their mother) which is
not desirable (Choudhary and Singh 2016). Further, knowledge of upwards and downwards mobility and their
contribution to the overall mobility is also important if seen in the context of comparison of mobility between
different social, spatial (rural vs. urban) or regional groups (Northern, Central, Eastern, Western, Southern). For
example, western region may have higher overall mobility but it may have higher downward mobility contributing to
higher overall mobility. Therefore, higher overall mobility in itself might not always be a good sign, rather higher
overall mobility driven by upwards mobility is what is actually desired for any progressive society. Thus to estimate
the upwards and downwards component of the overall mobility, we have decomposed the overall mobility (measured
by M1) into upward and downward component.
3.2.3. Decomposition of the overall mobility
Following Choudhary and Singh (2016), if the education levels are ranked in the increasing order, that is, i,
j=1,2,..m, where, i ,j=1 is the lowest education level and i, j=m is the highest education level, then from (1):
𝑀1=𝑚 ∑ ∑ 𝑃1 𝑖𝑗 𝑚
𝑗=1 𝑗≠𝑖 𝑚
𝑖=1
=𝑚1∑ ∑𝑖−1𝑗=1𝑃𝑖𝑗 𝑗≠𝑖 𝑚
𝑖=1 +𝑚1∑ ∑𝑚𝑗=𝑖+1𝑃𝑖𝑗 𝑗≠𝑖 𝑚
𝑖=1 (3)
=𝑀1𝑑𝑜𝑤𝑛+𝑀1𝑢𝑝
That is, using (3), M1can be clearly expressed as an exact sum of downwards and upwards mobility, where M1down
is the probability that the daughter will have lower education than the mother; similarly, M1up is the probability that
the daughter will have more education than the mother (Choudhary and Singh, 2016)
We now present the main results of our paper. First, we document the results for all-India and results for rural and
urban areas separately. It is followed by the results for all-India but for various social (caste) groups. Then we present
the findings of intergenerational mobility by geographical regions which is followed by results for various social
groups by regions. After that we report the results by income quintiles for all-India and various regions, followed
4. Results
We begin by presenting the distribution of daughters as well as mothers by the levels of their schooling. It is
followed by a presentation of mobility matrices. Finally, the estimates of mobility measures and the results of
decomposition of overall mobility into upwards and downwards components have been documented. Each of the
above details are presented separately for:(1) All India and by Urban and Rural areas separately; (2) by caste – Other
castes (henceforth “others”), Other Backwards Castes (henceforth OBC), Scheduled Castes (henceforth SC) and
Scheduled Tribes (henceforth ST); (3) by geographical regions –North, Central, East, West and South; (4) by caste
group for every region; (5) by income quintiles for all India and regions; and finally, by caste for every income
quintile.
4.1. Intergenerational Educational Mobility—All India, Rural and Urban
Figure 1 presents the population distribution of mothers as well as daughters by their educational categories for
all India and rural and urban areas separately. Some observations from the figure are disheartening as far as the
education of women in India is concerned. The percentage of mothers with no formal schooling is quite high at about
77 percent. In rural areas, about 84 percent of mothers have no formal schooling as compared to 63 percent in urban
areas. The percentage of daughters with no formal schooling is more than double in rural areas (47%) compared to the
urban areas (21%). Another important thing to note here is the percentage of mothers who have completed graduation
(15 years of schooling) or more is less than 1percent for all India. Similarly, percentage of daughters with 15 or more
years of schooling is nearly 5 percent for all-India. It is about 12 percent in urban areas whereas for rural areas it is
Notes:(1) no formal schooling; (2) 1–4 years of schooling; (3) 5–7 years of schooling; (4) 8–9 years of schooling; (5) 10–11 years of schooling; (6) 12–14 years of schooling; (7) 15 or more years of schooling. Sample sizes—All India (39,395), Rural (26,012), Urban (13,383). Source: Authors’ computations based on the data IHDS II (2011–2012).
Fig.1. Distribution (Percentage) of women by educational categories: All-India, rural and urban areas
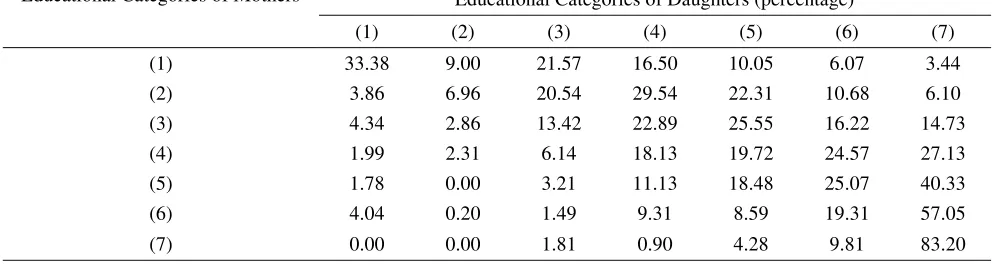
Table 1 presents the mobility matrices for all India (a), urban (b) and rural (c) areas. Some of the key observations
from the Table 1(a) are that – about 48 percent of daughters born to mothers with no formal schooling end up with no
formal schooling. On the other hand, only 5 percent daughters of mothers with no formal schooling complete higher
secondary (12 years) or more of schooling. One positive point to note here is that no daughters of mothers with 15 or
more years of schooling have ended with below primary education. Also, 80 percent of daughters of such mothers
[image:10.612.51.546.601.741.2]have themselves completed 15 or more years of schooling.
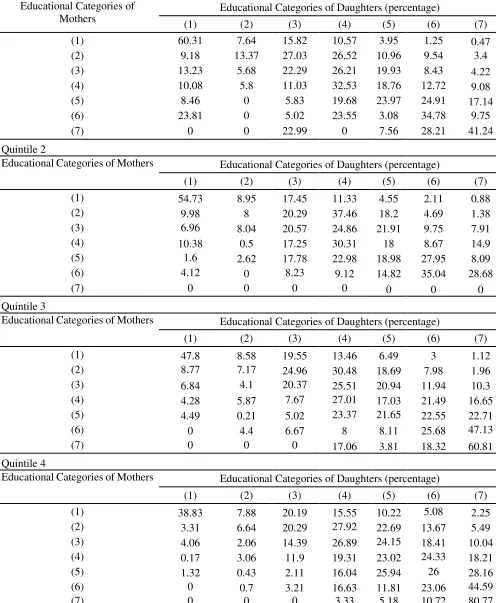
Table 1
Educational transition/mobility matrices: All-India, urban and rural India.
(a) All India
Educational Categories of Mothers Educational Categories of Daughters (percentage)
(1) (2) (3) (4) (5) (6) (7)
(1) 48.58 8.20 18.15 12.80 7.01 3.49 1.78
(2) 6.52 7.85 20.78 29.47 19.67 11.06 4.64
(3) 5.56 3.50 16.02 23.19 24.19 15.69 11.86
(4) 3.51 2.75 8.93 19.88 19.72 22.37 22.84
(5) 1.99 0.44 3.97 12.90 19.04 25.80 35.85
(6) 3.13 0.48 2.79 8.29 11.11 25.01 49.19
(7) 0.00 0.00 1.26 1.99 5.01 11.21 80.52
77
6 9 4
3 1 1
63 8 14 6 6 2 1 84
5 7 2
2 0 0 39 7 17 15 10 7 5 21 6
18 17 16
11 12 47 8 17 14 8 5 2 P erc en tag e co m p o siti o n
All-India Urban areas Rural ar eas
Distribution (Percentage) of women by educational categories: All-India, rural and urban areas
(b) Urban India
Educational Categories of Mothers Educational Categories of Daughters (percentage)
(1) (2) (3) (4) (5) (6) (7)
(1) 32.40 8.08 21.20 15.85 12.33 6.14 4.00
(2) 4.15 5.66 19.49 28.19 22.98 12.51 7.01
(3) 2.98 2.05 13.33 21.63 24.76 18.43 16.82
(4) 0.71 1.18 7.68 14.85 20.83 23.60 31.16
(5) 0.61 0.00 3.19 11.14 16.62 24.92 43.52
(6) 0.00 0.56 2.66 7.58 10.08 21.83 57.29
(7) 0.00 0.00 0.00 1.37 6.35 9.59 82.68
(c) Rural India
Educational Categories of Mothers Educational Categories of Daughters (percentage)
(1) (2) (3) (4) (5) (6) (7)
(1) 54.28 8.25 17.07 11.72 5.13 2.55 0.99
(2) 8.37 9.56 21.78 30.47 17.10 9.93 2.80
(3) 8.02 4.89 18.59 24.67 23.64 13.07 7.13
(4) 6.77 4.58 10.38 25.73 18.43 20.95 13.16
(5) 4.43 1.22 5.34 15.98 23.29 27.35 22.39
(6) 8.99 0.32 3.02 9.63 13.03 30.98 34.03
(7) 0.00 0.00 5.97 4.32 0.00 17.24 72.47
Notes: (1) no formal schooling; (2) 1–4 years of schooling; (3) 5–7 years of schooling; (4) 8–9 years of schooling; (5) 10–11 years of schooling; (6) 12–14 years of schooling; (7) 15 or more years of schooling. Sample sizes—All India (39,395), Rural (26,012), Urban (13,383). Source: Authors’ computations based on the data IHDS II (2011–2012).
There are large disparities between urban and rural areas as far as intergenerational mobility in education among
women is concerned. It can be seen from the Table 1 (b and c) that about 32 percent of daughters whose mothers didn’t have any formal schooling end up having no formal schooling in urban areas whereas in rural areas the percentage of such daughters is as high as 54 percent. Similarly, only 1 percent of daughters whose mothers had no
formal schooling completed 15 or more years of schooling in rural areas and for urban areas the figure is slightly
higher at 4%. An encouraging finding from this Table is that negligible number of daughters of mothers having 15 or
more years of schooling end up with no formal schooling for both urban as well as rural areas. Also, about 72 and 82
percent of daughters whose mothers have completed 15 or more years of schooling end up completing 15 or more
years of schooling in rural and urban areas, respectively.
The estimates of the mobility measures for all-India, rural and urban areas have been presented in Figure 2. The
mobility measure, M1 varies between ‘0’ (no mobility at all) and ‘1’ (perfect mobility); the overall mobility at the
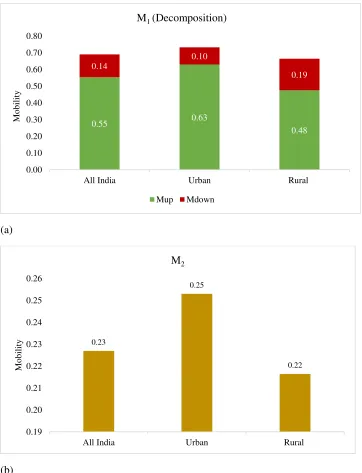
all-India level is about 0.69. The upwards component of this overall mobility is 0.55 which is about 80 percent of the
overall; and the remaining 0.14, that is, about 20 percent (which is a substantial proportion) of the overall mobility is
downwards. Also, the downward mobility (0.19 in absolute terms) in rural areas is almost twice of that in urban areas
(a)
(b)
[image:12.612.50.412.47.520.2]Notes: Upward/downward mobility as a percentage of total mobility (M1) in parenthesis. Sample sizes—All India (39,395), Rural (26,012), Urban (13,383). Source: Authors’ computations based on the data IHDS II (2011–2012).
Fig.2. Educational mobility measures (absolute) —All India and urban/rural
4.2. Intergenerational Educational Mobility—All India; by Caste Groups
The distribution of daughters and mothers by educational achievement for different caste groups is presented in
Figure 3. We have analyzed intergenerational educational mobility by caste groups because caste groups form the
social fabric of the Indian society and different caste groups in India are at different levels of economic and
demographic achievement. Some key results from Figure 3 are as follows: (1) there are huge inter-caste variations in
educational achievement of mothers and daughters; (2) about 90 percent of ST mothers have no formal schooling
whereas this proportion for Others caste group is around 63 percent; (3) Similarly, 22 percent daughters from Others
0.55 0.63
0.48 0.14
0.10
0.19
0.00 0.10 0.20 0.30 0.40 0.50 0.60 0.70 0.80
All India Urban Rural
M
o
b
il
it
y
M1 (Decomposition)
Mup Mdown
0.23
0.25
0.22
0.19 0.20 0.21 0.22 0.23 0.24 0.25 0.26
All India Urban Rural
M
o
b
il
it
y
caste group do not have any formal schooling, on the other hand about 56 percent of daughters from ST community
do not have any formal schooling; (4) it is discouraging to see that not even 1 percent of mothers from ST caste group
have 15 or more years of schooling whereas for Others caste group this proportion is about 1.3 percent; (5) likewise
about 1 and 11 percent of daughters have completed 15 or more years of schooling in STs and Others caste group,
respectively.
Notes: (1) no formal schooling; (2) 1–4 years of schooling; (3) 5–7 years of schooling; (4) 8–9 years of schooling; (5) 10–11 years of schooling; (6) 12–14 years of schooling; (7) 15 or more years of schooling. Sample sizes—Total (39,395); Others (11,752); OBCs (15,980); SCs (8,402); STs (3,261). Source: Authors’ computations based on the data IHDS II (2011–2012).
Fig.3. Distribution (Percentage) of women by educational categories: Others, OBCs, SCs and STs
Observing the mobility matrices from Table 2 for various caste groups reveals that there is a vast disparity
between various caste groups as far as intergenerational educational mobility among women is concerned. Some
salient results from Table 2 are as follows (1) 33 percent of daughters whose mothers have no formal schooling end
up with no formal schooling in Others caste group, whereas this proportion is much higher at about 50, 55 and 61
percent in cases of OBCs, SCs and STs, respectively; (2) in Others caste group, about 3 percent of daughters whose
mothers have no formal schooling end up completing 15 or more years of schooling but in OBCs, SCs and STs only
1.7, 1 and 0.6 percent of daughters whose mothers have no formal schooling complete 15 or more years of schooling,
respectively; (3) among the STs, about 85 percent of daughters (highest for any caste group) whose mothers have 15
or more years of schooling complete15 or more years of schooling and among OBCs the same proportion is only 70
percent (lowest for any caste group); (4) another noteworthy point from the table is that negligible number of
daughters (among all caste groups) of mothers with 15 or more years of schooling end up with no formal schooling .
63 8 14 7 6 2 1 79
6 9 3
2 1 0 87
4 5
2 1 0 0 90
3 4 1
1 0 0 22 7 18 18 14 10 11 40 7 18 15 10 6 4 49 8 17 13 7 4 2 56 9 14 11
5 4 1
P erc en tag e co m p o siti o n
Others OBCs SCs STs
Distribution (Percentage) of women by educational categories: Others, OBCs, SCs and STs.
Table 2
Educational transition/mobility matrices: Others, OBCs, SCs and STs (All India)
Others
Educational Categories of Mothers Educational Categories of Daughters (percentage)
(1) (2) (3) (4) (5) (6) (7)
(1) 33.38 9.00 21.57 16.50 10.05 6.07 3.44
(2) 3.86 6.96 20.54 29.54 22.31 10.68 6.10
(3) 4.34 2.86 13.42 22.89 25.55 16.22 14.73
(4) 1.99 2.31 6.14 18.13 19.72 24.57 27.13
(5) 1.78 0.00 3.21 11.13 18.48 25.07 40.33
(6) 4.04 0.20 1.49 9.31 8.59 19.31 57.05
(7) 0.00 0.00 1.81 0.90 4.28 9.81 83.20
OBCs
Educational Categories of Mothers Educational Categories of Daughters (percentage)
(1) (2) (3) (4) (5) (6) (7)
(1) 49.77 7.61 18.31 12.44 7.23 2.99 1.65
(2) 6.60 6.89 21.21 29.61 18.72 12.43 4.54
(3) 6.22 3.66 17.53 22.41 22.89 15.76 11.54
(4) 4.27 2.73 10.69 22.83 19.11 20.26 20.11
(5) 2.62 1.01 4.12 15.63 20.45 25.59 30.59
(6) 2.38 1.08 3.08 7.27 9.21 33.48 43.50
(7) 0.00 0.00 0.00 7.46 4.74 18.13 69.67
SCs
Educational Categories of Mothers Educational Categories of Daughters (percentage)
(1) (2) (3) (4) (5) (6) (7)
(1) 55.45 8.15 16.37 11.38 5.26 2.44 0.95
(2) 9.43 12.33 21.49 28.49 19.25 6.78 2.23
(3) 6.53 4.03 18.52 25.99 25.17 14.16 5.61
(4) 6.10 3.87 17.42 19.52 19.86 19.55 13.68
(5) 1.05 1.13 6.91 13.34 17.54 27.62 32.42
(6) 0.81 0.00 8.29 5.90 34.69 33.94 16.38
(7) 0.00 0.00 0.00 0.00 8.40 10.92 80.68
STs
Educational Categories of Mothers Educational Categories of Daughters (percentage)
(1) (2) (3) (4) (5) (6) (7)
(1) 60.99 9.23 13.98 9.39 3.39 2.44 0.58
(2) 17.34 8.48 15.82 31.09 8.72 16.29 2.27
(3) 8.94 7.51 20.42 25.72 19.43 14.01 3.97
(4) 13.53 7.64 7.76 13.87 28.04 19.16 10.01
(5) 1.80 0.00 8.58 13.37 17.73 40.11 18.41
(6) 0.00 0.00 10.82 6.60 24.26 12.77 45.56
(7) 0.00 0.00 0.00 0.00 14.74 0.00 85.26
The estimates of the mobility measures for the various caste groups have been presented in Figure 4. The overall
mobility for Others, OBCs, SCs, and STs is about 0.72, 0.68, 0.66 and 0.69 respectively. SCs have the lowest
mobility. The upward component of overall mobility is 0.61 (about 84% of overall) for Others, which is highest and
0.46 (69% of overall) in SCs which is lowest. Also, the downward component of the overall mobility is 0.11 in Others
which is lowest among all and 0.20 for both SCs and STs which is highest and alarming.
(a) M1
(b) M2
Notes: Upward/downward mobility as a percentage of total mobility (M1) in parenthesis.
Sample sizes—Total (39,395); Others (11,752); OBCs (15,980); SCs (8,402); STs (3,261). Source: Authors’ computations based on the data IHDS II (2011–2012).
Fig.4. Educational mobility measures (absolute): Others, OBCs, SCs and STs (All India)
0.61
0.53
0.46 0.48
0.11
0.16
0.20 0.20
0.00 0.10 0.20 0.30 0.40 0.50 0.60 0.70 0.80
Others OBCs SCs STS
M
o
b
il
it
y
M1 (Decomposition)
Mup Mdown
0.25
0.22
0.20 0.20
0.00 0.05 0.10 0.15 0.20 0.25 0.30
Others OBCs SCs STS
M
o
b
il
it
y
4.3. Intergenerational Educational Mobility— Regions
The five specified geographical regions are: North, Central, East, West and South. The Northern region comprises the states of Jammu and Kashmir, Himachal Pradesh, Delhi, Punjab, Haryana and Rajasthan (and the
Union Territory of Chandigarh). The states of Uttar Pradesh, Uttaranchal, Madhya Pradesh and Chhattisgarh come
under the Central region. The Eastern region comprises the states of Bihar, Jharkhand, West Bengal, Orissa, Sikkim,
Assam, Arunachal Pradesh, Meghalaya, Manipur, Mizoram, Tripura and Nagaland. The Western region includes the
states of Maharashtra, Goa and Gujarat (and the two Union Territories of Daman and Diu and Dadra and Nagar
Haveli). Finally, the Southern region comprises the states of Andhra Pradesh, Karnataka, Kerala and Tamil Nadu.
Uttarakhand is a new state, which was carved out of the state of Uttar Pradesh and is considered in the Northern
region. But since in1993–1994 it was part of Uttar Pradesh, which is counted in the Central region, we have included
it in the Central region for analysis. The categorization of states into regions is similar to Singh (2012b).
Figure 5 presents the distribution of daughters as well as mothers by their years of schooling for different
Notes: (1) no formal schooling; (2) 1–4 years of schooling; (3) 5–7 years of schooling; (4) 8–9 years of schooling; (5) 10–11 years of schooling; (6) 12–14 years of schooling; (7) 15 or more years of schooling. Sample sizes—Total (39,395); Northern India (8,873); Central India (8,158); Eastern India (8,287); Western India (5,342); Southern India (8,735). Source: Authors’ computations based on the data IHDS II (2011–2012)
Fig.5. Distribution (percentage) of women by educational categories: Regions 82 2 8 4 3 1 1 85 2 6 4 2 1 0 77 7 9 4 3 1 0 69 11 12 3 3 1 1 73 7 10 4 4 1 1 44 3 15 14 10 7 7 49 5 15 16
5 5 5 41 10 17 15 8 5 4 24 10 20 16 16 10 5 32 7 20 14 14 8 7 P erc en tag e co m p o siti o n
Northern India Central India Eastern India Western India Southern India
Distribution (percentage) of women by educational categories: Regions
Mothers
From the figure, it is clear that schooling among women has not evolved evenly across the country. About 84
percent of mothers and 49 percent of daughters in central India have no formal schooling. Situation is slightly better
in western India where proportion of mothers and daughters with no formal schooling is about 67 and 24 percent,
respectively. Surprisingly, for all the regions percentage of mothers with 15 or more years of schooling is less than 1
percent. Also, the percentage of daughters with 15 or more years of schooling is in the range of 4to 7 percent with
eastern India having lowest percentage and southern India having the highest percentage.
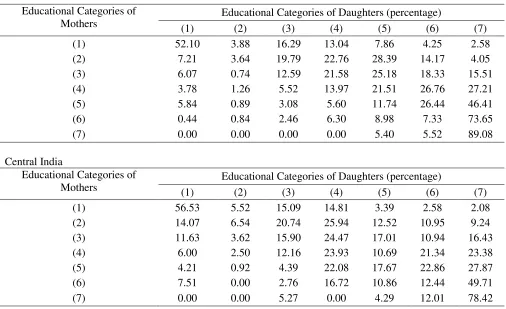
The mobility matrices for the different geographic regions are documented in Table 3. The key findings from Table 3
are as follows: (1) about 33 percent of daughters of mothers who didn’t have any formal schooling also end up with
no formal schooling in western India, whereas in other regions such as central, northern and eastern regions, this
proportion is as high as 56, 52 and 52 percent, respectively; (2) in eastern India not even 1 percent of daughters of
mothers with no formal schooling complete 15 or more years of schooling; (3) hardly any daughter of mothers with
15 or more years of schooling end up with no formal schooling; (4) in northern India, about 89 percent of daughters of
mothers with 15 or more years of schooling themselves complete 15 or more years of schooling; (5) for other regions
such as central, eastern, western and southern, the percentage of daughters whose mothers have completed 15 or more
years of schooling and who themselves complete 15 or more years of schooling is 78, 76, 72 and 82 percent,
respectively.
Table 3
Educational transition/mobility matrices: Regions
Northern India
Educational Categories of Mothers
Educational Categories of Daughters (percentage)
(1) (2) (3) (4) (5) (6) (7)
(1) 52.10 3.88 16.29 13.04 7.86 4.25 2.58
(2) 7.21 3.64 19.79 22.76 28.39 14.17 4.05
(3) 6.07 0.74 12.59 21.58 25.18 18.33 15.51
(4) 3.78 1.26 5.52 13.97 21.51 26.76 27.21
(5) 5.84 0.89 3.08 5.60 11.74 26.44 46.41
(6) 0.44 0.84 2.46 6.30 8.98 7.33 73.65
(7) 0.00 0.00 0.00 0.00 5.40 5.52 89.08
Central India
Educational Categories of Mothers
Educational Categories of Daughters (percentage)
(1) (2) (3) (4) (5) (6) (7)
(1) 56.53 5.52 15.09 14.81 3.39 2.58 2.08
(2) 14.07 6.54 20.74 25.94 12.52 10.95 9.24
(3) 11.63 3.62 15.90 24.47 17.01 10.94 16.43
(4) 6.00 2.50 12.16 23.93 10.69 21.34 23.38
(5) 4.21 0.92 4.39 22.08 17.67 22.86 27.87
(6) 7.51 0.00 2.76 16.72 10.86 12.44 49.71
[image:18.612.51.557.426.735.2]Eastern India
Educational Categories of Mothers
Educational Categories of Daughters (percentage)
(1) (2) (3) (4) (5) (6) (7)
(1) 51.84 10.99 17.37 11.56 4.98 2.35 0.92
(2) 7.72 12.64 22.42 34.16 12.38 7.02 3.67
(3) 6.07 5.04 18.03 28.77 21.21 13.34 7.55
(4) 3.46 4.19 6.64 24.78 23.16 19.23 18.54
(5) 2.23 0.00 4.21 13.54 25.28 25.65 29.08
(6) 5.09 0.00 0.61 4.88 8.59 41.08 39.75
(7) 0.00 0.00 0.00 8.53 4.98 10.07 76.43
Western India
Educational Categories of Mothers
Educational Categories of Daughters (percentage)
(1) (2) (3) (4) (5) (6) (7)
(1) 33.53 12.72 21.88 13.56 11.37 5.70 1.24
(2) 3.74 6.46 20.80 26.86 24.65 14.29 3.20
(3) 2.97 5.35 15.14 18.15 29.55 18.60 10.24
(4) 0.00 3.84 7.45 13.87 26.40 33.65 14.79
(5) 0.40 0.98 2.45 17.99 18.35 27.73 32.10
(6) 0.78 2.09 4.65 9.77 22.73 27.85 32.14
(7) 0.00 0.00 0.00 4.35 5.42 18.04 72.19
Southern India
Educational Categories of Mothers
Educational Categories of Daughters (percentage)
(1) (2) (3) (4) (5) (6) (7)
(1) 42.13 8.11 21.66 11.21 10.56 4.09 2.24
(2) 5.55 5.25 19.18 29.28 23.43 11.61 5.69
(3) 2.93 1.78 16.43 21.64 27.05 17.52 12.66
(4) 2.73 1.39 11.16 15.91 20.18 18.80 29.83
(5) 0.18 0.09 4.67 7.89 18.17 26.17 42.83
(6) 0.00 0.00 3.93 3.57 6.17 28.16 58.17
(7) 0.00 0.00 0.31 0.00 5.09 12.23 82.37
Notes: (1) no formal schooling; (2) 1–4 years of schooling; (3) 5–7 years of schooling; (4) 8–9 years of schooling; (5) 10–11 years
of schooling; (6) 12–14 years of schooling; (7) 15 or more years of schooling. Sample sizes—Total (39,395); Northern India (8,873); Central India (8,158); Eastern India (8,287); Western India (5,342);
Southern India (8,735)
[image:19.612.58.557.73.530.2]Source: Authors’ computations based on the data IHDS II (2011–2012).
Figure 6 shows the overall mobility and its decomposition for the various geographical regions. Some key points
worth mentioning from the above Figure are: (1) western and northern regions have highest overall mobility, i.e.,
0.73,however, a considerable part, about 22% of the overall mobility in the western region is because of the
downward mobility; (2) central region has an overall mobility of 0.70 but nearly 28% of the overall mobility is due to
downward mobility; (3) northern (86% of overall) and southern (86% of overall) regions have higher upward
mobility as compared to other regions; whereas (4) Central and western India have higher downward mobility as
(a) M1
(b) M2 Notes: Upwards/downwards mobility as a percentage of total mobility M1) in parenthesis.
Sample sizes—Total (39,395); Northern India (8,873); Central India (8,158); Eastern India (8,287); Western India (5,342); Southern India (8,735). Source:Authors’ computations based on the data IHDS II (2011–2012).
Fig.6. Educational mobility measures (absolute) —Regions
4.4. Intergenerational Educational Mobility—Caste groups by Regions
As can be seen from the description of results so far, intergenerational educational mobility varies by caste as
well as by region. Some of the regions have higher upward mobility as compared to others. Similarly, socially and
economically advanced caste groups have higher upward mobility compared to the socially disadvantaged ones.
Therefore, it is important to look into an interaction of caste and region, that is, it is interesting to see whether there is
caste based variation in intergenerational educational mobility in different regions.
0.63
0.50 0.51 0.57 0.60
0.10
0.20 0.14
0.16 0.10
0.00 0.10 0.20 0.30 0.40 0.50 0.60 0.70 0.80
Northern India Central India Eastern India Western India Southern India
M
o
b
il
it
y
M1 (Decomposition)
Mup Mdown
0.25
0.23
0.20
0.24 0.23
0.00 0.05 0.10 0.15 0.20 0.25 0.30
Northern India Central India Eastern India Western India Southern India
M
o
b
il
it
y
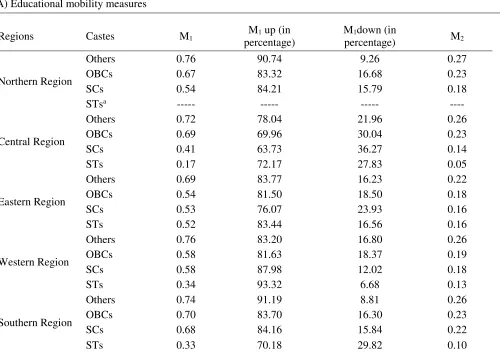
Table 4, panel A, reports the overall mobility as well as its decomposition for each caste group for every
geographical region, whereas the sample sizes used to arrive at these values have been reported in panel B. It can be
observed from the Table that no matter which is the region, Others caste group has highest overall as well as upward
mobility. A point of caution here is that, the results for ST caste group should be seen in the light of the fact that the
sample sizes for this group are small for all the regions except the eastern region. Some other findings from the Table
are as follows: (1) in northern region overall mobility is 0.76 for the Others compared to 0.67 and 0.54 for OBCs and
SCs, also the upward component of overall mobility is visibly higher in Others than OBCs and SCs; (2) in central
region, the overall mobility (0.17) is significantly lower in case of STs and that too has a substantial contribution
(about 38 percent)from downward mobility; (3) in the eastern region, the STs, SCs and OBCs have 0.52, 0.53 and
0.54 overall mobility, respectively which is substantially lower than that of Others; (4) in western region also Others
have substantially higher overall mobility (0.76) compared to the SCs, STs and OBCs, notably, STs have an overall
mobility of only 0.34; (6) in the southern region, except the STs, the overall mobility for all the caste groups is
comparatively higher related to other regions and about 80-90 percent of it is contributed by upward mobility. The
detailed mobility matrices have been presented in appendix A.
Table 4
Educational mobility measures and sample sizes: Castes by Regions (A) Educational mobility measures
Regions Castes M1 M1 up (in
percentage)
M1down (in
percentage) M2
Northern Region
Others 0.76 90.74 9.26 0.27
OBCs 0.67 83.32 16.68 0.23
SCs 0.54 84.21 15.79 0.18
STsa --- --- --- ----
Central Region
Others 0.72 78.04 21.96 0.26
OBCs 0.69 69.96 30.04 0.23
SCs 0.41 63.73 36.27 0.14
STs 0.17 72.17 27.83 0.05
Eastern Region
Others 0.69 83.77 16.23 0.22
OBCs 0.54 81.50 18.50 0.18
SCs 0.53 76.07 23.93 0.16
STs 0.52 83.44 16.56 0.16
Western Region
Others 0.76 83.20 16.80 0.26
OBCs 0.58 81.63 18.37 0.19
SCs 0.58 87.98 12.02 0.18
STs 0.34 93.32 6.68 0.13
Southern Region
Others 0.74 91.19 8.81 0.26
OBCs 0.70 83.70 16.30 0.23
SCs 0.68 84.16 15.84 0.22
[image:21.612.58.558.364.721.2](B) Sample Sizes
Others OBCs SCs STs
Northern Region 3460 2611 2466 279
Central Region 1763 3904 1531 878
Eastern Region 2845 2476 1890 1038
Western Region 2081 1949 708 530
Southern Region 1465 4849 1757 506
Notes: Upward/downward mobility as a percentage of total mobility. aSample size not large enough for estimation.
Source: Authors’ computations based on the data IHDS II (2011–2012).
4.5. Intergenerational Educational Mobility— by income quintiles for All-India and Regions
The discussion about trends in intergenerational educational mobility will not be complete if trends in the same
are not seen by income status. The general belief is that, intergenerational educational mobility will be relatively
higher in economically better off compared to the economically worse off. To check this, we have divided the sample
into quintiles using per capita income. Figure 7 gives the distribution of schooling of mothers and daughters by
income quintiles at the all-India level as well as for the geographic regions. The five income quintiles are denoted by
[image:22.612.53.539.81.193.2]Q1 to Q5, where Q1 is the poorest income quintile and Q5 is richest income quintile.
Figure 7 shows that as we move up to higher income quintiles, the proportion of daughters as well as mothers
with higher levels of education increases substantially. In lower income quintiles mothers as well as daughter with no
formal schooling are in higher proportion than daughters or mothers of higher income quintiles. Figure 8 presents the
mobility measures for the various income quintiles. It can be seen that overall mobility as well as its upwards
component increases substantially as we move from the poorest income quintile to the richest one. It is another thing
that even in the richest income quintile about 9 percent of overall mobility is contributed by downward mobility. The
Notes: (1) no formal schooling; (2) 1–4 years of schooling; (3) 5–7 years of schooling; (4) 8–9 years of schooling; (5) 10–11 years of schooling; (6) 12–14 years of schooling; (7) 15 or more years of schooling. Sample sizes—Total (38,986); Quintile 1 (7,798); Quintile 2 (7,839); Quintile 3 (7,755); Quintile 4 (7,797); Quintile 5 (7,797).
Source: Authors’ computations based on the data IHDS II (2011–2012).
Fig.7. Distribution (percentage) of women by educational categories: Income Quintiles 88
4 5 2
1 0 0
84
5 6
2 1 1 0
80
6 9
3 2 0 0
72 7 12 5 4 1 0 57 8 16 8 8 2 2 54 8 16 13 6 3 1 47 9 18 14 7 3 2 40 8 19 16 9 5 3 29 7 18 18 14 9 6 16 5
13 15 17 15 18
P erc en tag e co m p o siti o n
Q1 Q2 Q3 Q4 Q5
Distribution (percentage) of women by educational categories: Income Quintiles
Table 5
Educational transition/mobility matrices: Income Quintiles for All-India
Quintile 1
Educational Categories of Mothers
Educational Categories of Daughters (percentage)
(1) (2) (3) (4) (5) (6) (7)
(1) 60.31 7.64 15.82 10.57 3.95 1.25 0.47
(2) 9.18 13.37 27.03 26.52 10.96 9.54 3.4
(3) 13.23 5.68 22.29 26.21 19.93 8.43 4.22
(4) 10.08 5.8 11.03 32.53 18.76 12.72 9.08
(5) 8.46 0 5.83 19.68 23.97 24.91 17.14
(6) 23.81 0 5.02 23.55 3.08 34.78 9.75
(7) 0 0 22.99 0 7.56 28.21 41.24
Quintile 2
Educational Categories of Mothers Educational Categories of Daughters (percentage)
(1) (2) (3) (4) (5) (6) (7)
(1) 54.73 8.95 17.45 11.33 4.55 2.11 0.88
(2) 9.98 8 20.29 37.46 18.2 4.69 1.38
(3) 6.96 8.04 20.57 24.86 21.91 9.75 7.91
(4) 10.38 0.5 17.25 30.31 18 8.67 14.9
(5) 1.6 2.62 17.78 22.98 18.98 27.95 8.09
(6) 4.12 0 8.23 9.12 14.82 35.04 28.68
(7) 0 0 0 0 0 0 0
Quintile 3
Educational Categories of Mothers Educational Categories of Daughters (percentage)
(1) (2) (3) (4) (5) (6) (7)
(1) 47.8 8.58 19.55 13.46 6.49 3 1.12
(2) 8.77 7.17 24.96 30.48 18.69 7.98 1.96
(3) 6.84 4.1 20.37 25.51 20.94 11.94 10.3
(4) 4.28 5.87 7.67 27.01 17.03 21.49 16.65
(5) 4.49 0.21 5.02 23.37 21.65 22.55 22.71
(6) 0 4.4 6.67 8 8.11 25.68 47.13
(7) 0 0 0 17.06 3.81 18.32 60.81
Quintile 4
Educational Categories of Mothers Educational Categories of Daughters (percentage)
(1) (2) (3) (4) (5) (6) (7)
(1) 38.83 7.88 20.19 15.55 10.22 5.08 2.25
(2) 3.31 6.64 20.29 27.92 22.69 13.67 5.49
(3) 4.06 2.06 14.39 26.89 24.15 18.41 10.04
(4) 0.17 3.06 11.9 19.31 23.02 24.33 18.21
(5) 1.32 0.43 2.11 16.04 25.94 26 28.16
(6) 0 0.7 3.21 16.63 11.81 23.06 44.59
Quintile 5
Educational Categories of Mothers Educational Categories of Daughters (percentage)
(1) (2) (3) (4) (5) (6) (7)
(1) 26.65 7.73 18.86 15.7 14.33 9.75 6.99
(2) 2.51 5.01 13.03 25 25.95 18.18 10.31
(3) 2.1 0.98 9.25 16.88 28.49 22.36 19.95
(4) 0.61 0.52 3.49 8.76 19.18 30.02 37.41
(5) 0.59 0 1.4 4.66 13.4 26.53 53.43
(6) 0.27 0 0 2.54 11.96 20.07 65.16
(7) 0 0 0 0 3.33 8.94 87.73
Notes: (1) no formal schooling; (2) 1–4 years of schooling; (3) 5–7 years of schooling; (4) 8–9 years of schooling; (5) 10–11 years
of schooling; (6) 12–14 years of schooling; (7) 15 or more years of schooling. Sample sizes—Total (38,986); Quintile 1 (7,798); Quintile 2 (7,839); Quintile 3 (7,755); Quintile 4 (7,797); Quintile 5 (7,797).
Source: Authors’ computations based on the data IHDS II (2011–2012).
(a) M1
0.38 0.43
0.50 0.56
0.69
0.29 0.19
0.20 0.14
0.06
0.00 0.10 0.20 0.30 0.40 0.50 0.60 0.70 0.80
Q1 Q2 Q3 Q4 Q5
M
o
b
il
it
y
M1 (Decomposition)
(b) M2
Notes: Upward/downward mobility as a percentage of total mobility M1) in parenthesis.
Sample sizes—Total (38,986); Quintile 1 (7,798); Quintile 2 (7,839); Quintile 3 (7,755); Quintile 4 (7,797); Quintile 5 (7,797).
Source:Authors’ computations based on the data IHDS II (2011–2012). Fig.8. Educational mobility measures (absolute) —Income Quintiles
It would also be interesting to find out how different income quintile in different regions behave as far as
intergenerational educational mobility among women is concerned. Table 6 gives the sample sizes for the analysis as
well as the mobility estimates for each income quintile for every region. Key results from the Table are: (1) it can be
seen that for every region as the income increases overall mobility also more or less increases barring one or two
exceptions; (2) another striking thing to note here is that the lowest income quintiles in eastern and southern region
have higher overall mobility in the range of 0.5-0.55 compared to other regions, but about 35 percent of it is
contributed by downwards mobility in eastern region and 20 percent in southern region; (3) also, the richest income
quintile in western region shows the highest overall mobility, i.e., 0.79 but about 13 percent of this comes from
downwards mobility. The detailed mobility matrices for income quintiles by regions have been presented in
Appendix B.
0.24
0.19
0.22 0.23
0.28
0.00 0.05 0.10 0.15 0.20 0.25 0.30
Q1 Q2 Q3 Q4 Q5
M
o
b
il
it
y
Table 6
Education mobility measures and sample sizes: Income quintiles by Regions
(A) Educational mobility measures
Regions Income
Groups M1
M1 up (in percentage)
M1 down (in
percentage) M2
Northern Region
Q1 0.31 85.56 14.44 0.10
Q2 0.54 68.92 31.08 0.19
Q3 0.51 81.86 18.14 0.19
Q4 0.67 79.62 20.38 0.24
Q5 0.78 92.58 7.42 0.30
Central Region
Q1 0.35 66.15 33.85 0.13
Q2 0.53 59.95 40.05 0.16
Q3 0.68 61.92 38.08 0.21
Q4 0.53 74.97 25.03 0.18
Q5 0.75 90.10 9.90 0.27
Eastern Region
Q1 0.50 65.04 34.96 0.16
Q2 0.48 78.65 21.35 0.13
Q3 0.51 75.24 24.76 0.16
Q4 0.55 86.03 13.97 0.18
Q5 0.71 89.87 10.13 0.25
Western Region
Q1 0.43 83.99 16.01 0.14
Q2 0.55 75.18 24.82 0.16
Q3 0.57 89.56 10.44 0.19
Q4 0.58 88.07 11.93 0.21
Q5 0.79 87.35 12.65 0.29
Southern Region
Q1 0.55 79.53 20.47 0.18
Q2 0.52 84.64 15.36 0.18
Q3 0.57 85.15 14.85 0.20
Q4 0.68 87.89 12.11 0.23
Q5 0.74 94.12 5.88 0.27
(B) Sample Sizes
Income Quintiles Region
Q1 Lowest
Income Q2 Q3 Q4
Q5 Highest Income
Northern Region 904 1466 1833 2134 2479
Central Region 2848 2004 1391 1014 819
Eastern Region 2163 1984 1577 1215 1310
Western Region 808 1,011 1,055 1,154 1,240
Southern Region 1075 1374 1899 2280 1949
Notes: Upwards/downwards mobility as a percentage of total mobility. Q1 to Q5 are per capita income quintiles in ascending
4.6. Intergenerational Educational Mobility— caste groups by income quintiles
One pertinent question which is always asked in the Indian context is whether income has the ability to neutralize
the effect of caste as far as intergenerational educational mobility is concerned. That is, whether the intergenerational
educational mobility among the, say, SCs or STs in the richest quintile is more than the intergenerational educational
mobility among the Others in the poorest quintile. To answer such questions, we have looked into the
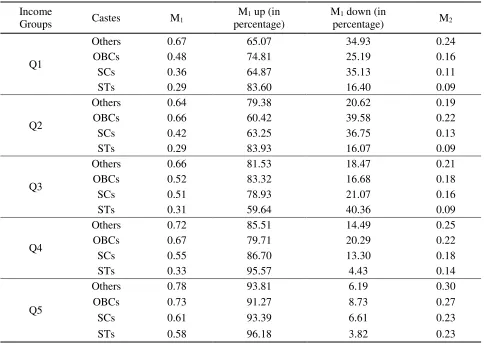
intergenerational educational mobility for the different caste groups in each income quintile. The results of this
exercise are reported in Table 7. Some key findings from this table are: the overall mobility among Others in the
poorest quintile is more than the overall mobility among SCs or STs in the richest quintile; also, in every quintile, the
overall mobility among the Others is more than the overall mobility among the SCs, STs or OBCs; further, the
upward component of overall mobility generally increases for each caste group as we move from the poorest to the
richest quintile. The detailed mobility matrices for the analysis of mobility by caste groups for every income quintile
[image:28.612.50.534.389.733.2]are presented in Appendix C.
Table 7
Educational mobility measures and sample sizes: castes by income quintiles
(A) Educational mobility measures
Income
Groups Castes M1
M1 up (in percentage)
M1 down (in
percentage) M2
Q1
Others 0.67 65.07 34.93 0.24
OBCs 0.48 74.81 25.19 0.16
SCs 0.36 64.87 35.13 0.11
STs 0.29 83.60 16.40 0.09
Q2
Others 0.64 79.38 20.62 0.19
OBCs 0.66 60.42 39.58 0.22
SCs 0.42 63.25 36.75 0.13
STs 0.29 83.93 16.07 0.09
Q3
Others 0.66 81.53 18.47 0.21
OBCs 0.52 83.32 16.68 0.18
SCs 0.51 78.93 21.07 0.16
STs 0.31 59.64 40.36 0.09
Q4
Others 0.72 85.51 14.49 0.25
OBCs 0.67 79.71 20.29 0.22
SCs 0.55 86.70 13.30 0.18
STs 0.33 95.57 4.43 0.14
Q5
Others 0.78 93.81 6.19 0.30
OBCs 0.73 91.27 8.73 0.27
SCs 0.61 93.39 6.61 0.23
(B) Sample Sizes
Castes
Income Quintiles Others OBCs SCs STs
Q1 Lowest Income 1540 3459 1664 1135
Q2 1716 3315 2048 760
Q3 2148 3189 1872 546
Q4 2587 3154 1670 386
Q5 Highest Income 3623 2672 1098 404
Notes: Upward/downward mobility as a percentage of total mobility. Sample sizes—Total (39,395). Q1 to Q5 are per capita income quintiles in ascending order of their mean per capita income. e.g.
Q1 is lowest income group and q5 is highest income group. Source: Authors’ computations based on the data IHDS II
(2011–2012).
5. Discussion and Conclusions
We perhaps for the first time comprehensively and systematically study intergenerational educational mobility
among women (vis-à-vis their mothers) in India with special focus on socioeconomic differentials. We use the
nationally representative Indian Human Development Survey 2011-12 for the examination. The survey used covers
all the states and union territories of India except Andaman & Nicobar and Lakshadweep Islands. We not only
estimate the overall mobility but also decompose the overall mobility into upwards and downwards components.
Analysis of decomposition of overall mobility into upwards and downwards component is important because there is
always a possibility that the overall mobility may be high due to a higher contribution of downwards mobility rather
than upwards mobility.
We find that the overall mobility at the all-India level is about 0.69 (1 being the upper limit). That is, 69% of the
daughters in the age group 15-49 years in India end up with total years of schooling different from their mothers. It is
encouraging to find that nearly 80% of the overall mobility is contributed by the upwards component. Also, the
overall mobility and its upwards component is higher for urban areas compared to the rural ones. Among the various
caste groups, the overall mobility is highest among the Others (or upper) caste group and lowest for the SCs. Not only
the overall mobility is lower for the socially and economically disadvantaged caste groups, but the upwards
component is also substantially lower for these groups compared to the Others.
We also find large inter regional variations, with situation being worst in the central and eastern regions which
comprise of the most deprived states (in terms of economic and demographic characteristics) of India. Moreover, the
overall mobility and the upwards component increase consistently as one moves from the lower parts of the income
distribution to the upper parts of income distribution. Surprisingly, income is not able to neutralize the disadvantage
of socially and economically weaker caste groups and results indicate that the overall mobility among the Others of
the poorest income quintile is more than the overall mobility among Scheduled Castes/Tribes of the richest income
It might be important to discuss our results in the light of some of the existing studies even though the sample
sizes and approaches of the existing studies is different from the present study. Our results are in line with Majumder
(2010) which found lower intergenerational educational mobility among the scheduled groups compared to the
Others caste group. As Majumder (2010) has not decomposed the overall mobility into upwards and downwards
component, our results of mobility decomposition cannot be compared to it. Hnatkovska et al. (2012) have also
looked into intergenerational educational mobility by caste groups and have found that the overall mobility is higher
for Scheduled groups (SC/STs) compared to the Others but first, their sample is restricted to males and second, they have compared educational attainment of sons to that of their fathers’. Choudhary and Singh (2016) which is close to the present study in terms of approach and analysis has findings similar to the present study. They find that the overall
mobility is not very different across the different caste groups (a deviation from our findings) but the upwards
mobility is substantially higher among the Others caste group compared to the historically disadvantaged Scheduled
groups. The aforesaid deviation might be due to the fact that, Choudhary and Singh (2012) has studied
intergenerational educational mobility among young women (15-24 years) and their sample is limited to only six
Indian states.
Though the present study adds substantially to the scholarship on intergenerational educational mobility among
women in India, it also suffers from a few limitations, such as, first, given the cross-sectional nature of data, we could
not examine changes in mobility over time; and second we could not find detailed reasons for the various trends and
patterns in the mobility which we are getting in the present study. Perhaps more studies on primary data are needed to
explain the findings in greater detail. This can be a scope for future research.
References
Agrahari, K., & Singh, A. (2009). Do community factors have differential impact on the nutrition of boys and girls in
rural India? Demography India, 38(1), 117–134.
Behrman, J. R., Foster, A., Rosenzweig, M. R., & Vahsishtha, P. (1999). Women’s schooling, home teaching, and
economic growth. Journal of Political Economy, 107(4), 682–715
Bhan, G. (2001). India gender profile. Institute of Development Studies: University of Sussex, BRIDGE Report. 62.
Bloomfield, M. (Ed.). (1897). Hymns of the Atharva-Veda: together with extracts from the ritual books and the
commentaries (Vol. 1). Clarendon Press.
Borooah, V. (2004). Gender bias among children in India in their diet and immunization against disease. Social
Science and Medicine, 58(9), 1719–1731.
Chiefs of Ontario (2012). Our Children, Our Future, Our Vision report, New Agenda Working Group. Chiefs of
Ontario; Ontario.
Choudhary, A., & Singh, A. (2016). Are Daughters Like Mothers: Evidence on Intergenerational Educational