Electrodeposition of a Copper–Tellurium Compound
under Diffusion-Limiting Control
Takahiro Ishizaki
*1, Daisuke Yata
*2and Akio Fuwa
Department of Material Science and Engineering, School of Science and Engineering, Waseda University, Tokyo 169-8555, Japan
Copper–tellurium films were electrochemically deposited from a solution containing CuCl2, TeO2and HCl. This study revealed the
relationship between the copper/tellurium ratio in the solution and the metal ratio in the deposited film. The Cu/Te ratio of the deposited film was successfully controlled by conducting electrodeposition under diffusion-limited conditions. The [Cu]/[Te] ratio in the solution was linearly related to that of Cu/Te in the deposited film, since the partial current density originating from the copper and tellurium ions was directly proportional to the concentration of each. The deposited films crystallized to Cu2Te at the Cu/Te ratio of 2.5. The films were deposited at0:4V
vs. Ag/AgCl from a solution in which [Cu]/[Te] = 2.5, [CuCl2] =1:0103M (= kmol m3), [TeO2] =4:0104M, and pH = 1.
(Received April 17, 2003; Accepted June 13, 2003)
Keywords: electrochemistry, deposition process, copper telluride
1. Introduction
Transition-metal tellurides show a wide range of chemical and physical properties.1) For example, CuInTe2,2)
Pb1xSnxTe,3) PbTe4) and Ag2Te5) have found application
in highly efficient solar cells, photo-diode devices, mixed ionic-electronic conductive materials and thermo-element materials, respectively. Copper tellurides6–13) also exhibit thermoelectronic properties and novel topological clusters, similar to C60 and carbon nanotubes. However, copper tellurides have rarely been the subject of study, and have thusfar been prepared only through dry processes such as sputtering and chemical vapor deposition.
Fabricating electronic and optical devices by the electro-deposition of semiconductors is attractive from the viewpoint of cost. The synthesis of tellurides via dry processing requires high growth temperature. Electrodeposition offers the ad-vantage of allowing preparation at lower temperature. However, there have not yet been any reports of electro-deposited binary copper-tellurides. This may be due to tellurium’s low solubility in water.
Muraseet al.investigated the electrodeposition of CdTe in a Cd–Te–NH4 solution.14) The basic solution, NH4(aq),
allowed high solubility of the tellurium and the complex formation of Cd–NH4. By controlling the composition of this
solution, stoichiometrically determined crystallized CdTe films were deposited.
In our present research, we have attempted to control the Cu/Te ratio and the degree of crystallinity via electro-deposition under diffusion-limited current conditions. In this paper, we describe the following experimental results for copper-telluride co-deposition under diffusion-limited con-ditions: (i) the limiting current density for the respective elements obtained in linear sweep voltammetric measure-ments; (ii) the correlation of the Cu/Te ratio in the deposited film with the [Cu]/[Te] ratio in the solution; and (iii) the crystalline phase of the deposited films.
2. Experimental Procedures
2.1 Electrochemical experiments
A three-electrode cell was employed in this study. A sheet
of titanium (20 mm40 mm) (TANAKA KIKINZOKU)
was used as a working electrode (cathode). Part of this electrode surface was covered with Teflon adhesive tape so that a known area (10 mm10 mm) was exposed to the electrolyte as the cathode surface. A platinum mesh (30 mm50 mm) was used as a counter electrode (anode) and an Ag/AgCl electrode was used for reference. The titanium sheets were polished by emery paper with#200 to
#2000 grid. Organic contamination on the Ti sheets was sonicated in distilled water. Finally, the sheets were chemi-cally etched for 60 s in aqueous solutions of1 : 1v/v HNO3,
1 : 1v/v HCl and 10 wt% NaOH,15)in that order.
All chemicals were regent grade or the highest available commercial grade and were used as received. Deionized water (7106cm) was obtained from an Autostill water
system (YAMATO Co., Ltd. WG25). Electrolytes were prepared from CuCl2, TeO2, HCl and distilled-deionized
water. The pH of the electrolytes was adjusted to 1.0. In order to avoid any influence from dissolved oxygen, all electro-chemical experiments were conducted after argon reflux for ca. 20 min. The bath temperature was maintained at ca. 30C by a rubber heater. The electrolytic bath was agitated at 100 rpm with a magnetic stirring unit for all electrochemical measurements and syntheses.
Linear sweep voltammetry was conducted using a function
generator (HOKUTODENKO HB-104), a potentiostat
(HOKUTODENKO HA-501) and an X-Y recorder
(YOKOKAWA HOKUSHIN ELECTRIC 3025) at a scan rate of 2 mV/s. The diffusion limited current density Jd
values were adopted as the average of the steady current recorded for 30 min. TheJd values for the electrodeposition
experiments were determined fromI-ttransient observation at a fixed polarization potential.
All films were potentiostatically deposited for 30 min. The composition of the films was determined by inductively coupled plasma (ICP) atomic emission spectrophotometry (SEIKO SPS7000A) after the compound was dissolved in a *1Graduated Student, Waseda University and Japan Science Promotion
Research Fellow.
*2Graduate Student, Waseda University.
HNO3solution. The crystal structure was examined by X-ray
diffraction (XRD) (PHILIPS X’Pert). The XRD spectra were obtained using a powder diffractometer with Cukradiation between the range of 20 and 60 at a scanning rate of
2¼4(degree/min). The XRD peaks were assigned based
on JCPDS data.
2.2 Deposition under diffusion-limited conditions Generally, the diffusion limited current density is describ-ed as follows:16)
J¼nFDC
ð1Þ
where n is the electrons per molecule reduced, F is the Faraday constant in C mol1,Dis the diffusion constant in
cm2s1,is the diffusion layer thickness in cm, andCis the
ion concentration in mol cm3. If no other competitive
limiting factors are involved in the diffusion region for both ions and the deposition of copper and tellurium is controlled solely by diffusion, the theoretical total cathodic current density in the co-deposition process should be the sum of the individualJd values for copper and tellurium, as follows:
Jd(total)¼Jd(Cu)þJd(Te) ð2Þ
whereJd(total)is the limiting current density for the compound
deposition in A m2, and J
d(Cu) and Jd(Te) are the limiting
current densities of copper and tellurium in A m2,
respec-tively. If we assume D and to be constant within the concentration range used, we can simplify as follows:
Jd(total)¼KCu½Cu þKTe½Te ð3Þ
whereK in A m2M1 (M = kmol m3) is the value of the
limiting current density at the unit concentration. Equation (3) indicates that the Cu/Te ratio of the film can be controlled by the [Cu]/[Te] ratio of the solution under diffusion-limited conditions.
3. Results and Discussion
3.1 Cathodic polarization curves
Figure 1 shows the results of linear sweep voltammetry in solutions containing5:0104to1:2103M-CuCl
2. The
current density drastically increased starting from the potential of around 0:2V in the negatively progressing sweep. This current originated from the reduction of copper ions as follows:
Cu2þþ2e¼Cu ðAÞ
At potentials from0:25to0:55V, the current density was governed by the ion diffusion rate. The limiting current density at the concentrations of 1:0103M and
5:0104M was about 1.8 A m2 and 0.9 A m2, respec-tively. The limiting current density doubled when the concentration of copper doubled. Thus, the bath concentra-tion was linearly related to the limiting current density. This relationship was observed in all our experiments. The current density again drastically increased from the potential of
0:6V due to the hydrogen evolution reaction.
Figure 2 shows voltammograms for solutions containing
1:0104to5:0104M-TeO
2. Here, the current density
drastically increased from around0:15V. This was caused by tellurium deposition as follows:
HTeOþ2 þ3Hþþ4e¼Teþ2H
2O ðBÞ
The current density for tellurium deposition reveals a limiting current density at 0:25 to 0:58V. The increase of the current density again from0:65V is thought to result from the following reaction:
Teþ2Hþþ2e¼H
2Te ðCÞ
Another increase of current density from 0:7V is mainly due to the hydrogen evolution reaction. The limiting current density of tellurium also increased with an increase in the ion concentration.
Figure 3 shows I-t transients recorded at 0:2V for a series of solutions of different copper concentrations. TheI-t curves display Cottrel behavior for only a short period of time before approaching a constant value. The steady state was typically reached after about 90 s. A similar study for solutions containing tellurium ions revealed the same tendency.
0.2 0.0 -0.2 -0.4 -0.6
0.0 1.0 2.0 3.0 4.0
(A)
(d) (c) (b) (a)
Cathodic Current Density,
|
i
|
/ A
m
-2
Cathode Potential, E / (V vs. Ag / AgCl)
Cu 1.2 × 10⁻³M (a)
Cu 1.0 × 10⁻³M (b)
Cu 8.0 × 10⁻⁴M (c)
Cu 5.0 × 10⁻⁴M (d)
Fig. 1 Linear sweep voltammograms for solutions containing from
5:0104to1:2103M-CuCl
2with 0.1 M-HCl at 303 K. The sweep
rate was 2 mV s1.
0.2 0.0 -0.2 -0.4 -0.6 -0.8 -1.0 -1.2 0.0
1.0 2.0 3.0
(C)
(B)
(f) (e) (d)
(c) (b) (a)
Cathodic Current Density,
|
i
|
/ A
m
-2
Cathode Potential, E / (V vs. Ag / AgCl) Te 5.0 × 10⁻⁴
M (a) Te 4.0 × 10⁻⁴M (b) Te 3.0 × 10⁻⁴
M (c) Te 2.5 × 10⁻⁴M (d) Te 2.0 × 10⁻⁴M (e) Te 1.0 × 10⁻⁴M (f)
Fig. 2 Linear sweep voltammograms for solutions containing from
1:0104 to5:0104M-TeO
2with 0.1 M-HCl at 303 K. The sweep
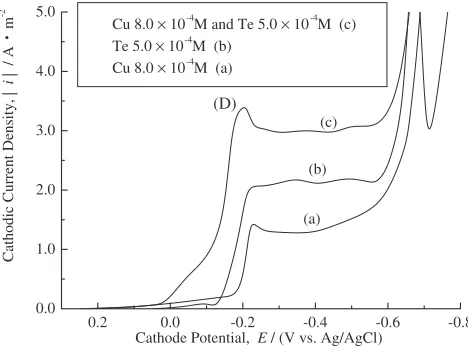
[image:2.595.308.544.71.252.2] [image:2.595.308.546.310.475.2]Figure 4 shows the results of linear sweep voltammograms for a mixture solution containing 8:0104M-CuCl
2 and
5:0104M-TeO
2. The current density increased starting
from the potential of around0:15V due to deposition of the copper–tellurium compound. If the copper–tellurium com-pound is regarded as Cu2Te, the electrochemical reaction is
considered as follows:
2Cu2þþHTeOþ
2 þ3Hþþ8e¼Cu2Teþ2H2O ðDÞ
for which the redox potential at 298 K is calculated by
E¼0:507þ0:0148 log½Cu2þ
þ0:0739 log½HTeOþ
2 0.0222pH
ðEÞ
using thermodynamic data.17,18)Under the conditions where pH = 1, [Cu2þ] = 8:0104M and [HTeOþ
2] =
5:0104M, the redox potential is calculated as 0.195 V
vs. SHE (¼ 0:004V Ag/AgCl). This calculated value agrees approximately with that obtained experimentally. The deposition potential for the solution containing the mixture of copper and tellurium shifted in the positive direction compared to that for deposition of either of the respective elements. Since the formation of the copper–tellurium
compound produces a negative Gibbs free energy, this may shift the deposition potential of the less noble component to a more positive value.19)As seen in Fig. 4, over the range of
0:2 to0:55V, the sum of the respective limiting current densities of copper and tellurium is almost equal to that of the mixture solution. This tendency was observed in all our results. This indicates that there is hardly any interaction between the diffusion flows of copper and tellurium in the solution. Thus, in this potential range, the composition of the electrodeposited films can be directly controlled according to the solution composition.
3.2 Diffusion Control
Figure 5 shows the limiting current density as a function of copper ion concentration. Lines (1) to (3) represent different concentrations of tellurium: (1) no tellurium, (2)
2:0104M, and (3)4:0104M. The experimental plots
were extrapolated as the dashed lines seen in the figure. The limiting current density increased linearly with the increase in copper ion concentration. Thus, the limiting current density for copper diffusion was shown to be affected little by simultaneous tellurium deposition.
Similarly, Fig. 6 shows the limiting current density as a function of tellurium concentration in solutions containing different amounts of copper. Lines (1) to (3) correspond to no copper,5:0104and1:0103M, respectively. Thus, the
limiting current density for tellurium diffusion was also shown to be little affected by simultaneous copper deposi-tion. The extrapolated values in the experimental plots are very close to the diffusion limited current density values observed in Fig. 1. This indicates that hydrogen reduction can be ignored within the appropriate potential range. These results demonstrate that copper and tellurium can be electro-chemically co-deposited.
The composition molar ratioRf of the deposited film can
be described by the respective limiting current densities:
Rf ¼ ½Cu=Tefilm¼
Jd(Cu)=nCu
Jd(Te)=nTe
ð4Þ
wherenis the number of electrons per molecule reduced.
0 30 60 90 120 150 180
-20.0 -18.0 -16.0 -14.0 -12.0 -10.0 -8.0 -6.0 -4.0 -2.0 0.0
(d)
(c)(b)
(a)
Current Density,
i
/ A
m
-2
Time, t / s
Fig. 3 Current density vs. time profiles for solutions of different Cu2þ
concentration: (a)5:0104M; (b)8:0104M; (c)1:0103M; and
(d)1:2103M.
0.2 0.0 -0.2 -0.4 -0.6 -0.8
0.0 1.0 2.0 3.0 4.0 5.0
(D)
(c)
(b)
(a)
Cathodic Current Density,
|
i
|
/ A
m
-2
Cathode Potential, E / (V vs. Ag/AgCl)
Cu 8.0 × 10⁻⁴M and Te 5.0 × 10⁻⁴M (c)
Te 5.0 × 10⁻⁴M (b)
Cu 8.0 × 10⁻⁴M (a)
Fig. 4 Linear sweep voltammogram for a mixture solution of
8:0104M-CuCl
2and5:0104M-TeO2with 0.1 M-HCl.
0.0 0.5 1.0 1.5
0.0 0.5 1.0 1.5 2.0 2.5 3.0 3.5 4.0
(3)
(2)
(1)
Limiting Current Density,
|
Jd
|
/ A
m
-2
Cu2+ Ion Concentration, C / M ( = kmol m-3 ) × 10-3
Fig. 5 Total diffusion limited current density vs. Cu2þion concentration
for three solutions containing different amounts of HTeOþ
2 ions: (1) no
tellurium added; (2) 2:0104M-Te; and (3) 4:0104M-Te. The
[image:3.595.51.285.304.477.2] [image:3.595.307.545.564.738.2]From eq. (3), we can write as follows:
Rf¼
KCu½CunTe
KTe½TenCu
ð5Þ
Since the values ofKCuandKTein A m2M1 are given by
the slopes of the plots in Figs. 5 and 6, respectively, we can describe the ratio,Rf, as follows:
Rf ¼
152ð12Þ
415ð12Þ
4
2
½Cu
½Te ¼0:72ð0:02Þ
½Cu
½Te ð6Þ
3.3 Film deposition under controlled diffusion
The [Cu]/[Te] ratio in the solution was changed from 1 to 5 while keeping the tellurium ion concentration constant at
2:0104M. All the films were potentiostatically deposited at0:4V, where, as demonstrated earlier, the current density would be governed solely by the diffusion rate. The total charge for each film was about 5000 C m2. The films
obtained were about 1mm thick, with the deposition rate corresponding to about 2mmh1 at 3 A m2. Figure 7 shows
the composition of the films as measured by ICP analysis correlated with calculations obtained with eq. (6) (indicated by the solid line). The Cu/Te ratio of the films was linearly related to the [Cu]/[Te] ratio of the solution. Moreover, eq. (6) accurately represented the relationship demonstrated by the experimental results. Thus, eq. (6) effectively provides us with the solution composition necessary to prepare a given film.
Films were then potentiostatically electrodeposited at
0:25 to 0:55V at intervals of 0.05 V from a bath containing 1:0103M-CuCl
2 and 4:0104M-TeO2.
These potentials are within the range where control would be solely by the diffusion rate. As shown in Fig. 8, the Cu/Te ratio in the deposited films was constant at 1.78. Thus, the Cu/Te ratio in the films was independent of the deposition potential under the diffusion-limited condition.
Figure 9 shows XRD patterns for samples which were deposited at different potentials from (a) 0:35V and (b)
0:25 to 0:55V from a bath containing 1:0103
M-CuCl2and4:0104M-TeO2. The films deposited over this
potential range showed diffraction corresponding to the (100) plane of crystalline Cu2Te.20)In particular, the sample with
the Cu/Te ratio closest to 1.78, i.e., the film deposited at
0:35V, which had a Cu/Te ratio of 1.7–1.8, showed the sharpest diffraction peak. In contrast, the film deposited at
0:55V exhibited a rather broad diffraction peak. The potential applied may promote the inverse segregation of tellurium.
4. Conclusions
We successfully controlled the Cu/Te ratio to prepare crystalline Cu2Te film via electrodepostion. The copper–
tellurium films were co-deposited under diffusion-limited, potentiostatic conditions. The diffusion-limiting condition was elucidated by examining, through linear sweep voltam-metry, a series of copper–tellurium compound deposits obtained from solutions of different compositions. The limiting current density for the diffusion of copper was not affected by the simultaneous deposition of tellurium ions.
0.0 0.1 0.2 0.3 0.4 0.5 0.0
0.5 1.0 1.5 2.0 2.5 3.0 3.5 4.0 4.5
(3)
(2)
(1)
Limiting Current Density,
|
Jd
|
/ A
m
-2
HTeO2
+
Ion Concentration, C / M ( = kmol m-3 ) × 10-3
Fig. 6 Total diffusion limited current density vs. HTeOþ
2 ion concentration
for three solutions containing different amounts of Cu2þ ions: (1) no
copper added; (2)5:0104M-Cu; and (3)1:0103M-Cu. The slopes
of the plots are, respectively, 425, 417 and 396 A m2M1.
0.0 0.5 1.0 1.5 2.0 2.5 3.0 3.5 4.0 4.5 5.0 5.5 0.0
0.5 1.0 1.5 2.0 2.5 3.0 3.5 4.0
[Cu / Te] (Film)
[Cu / Te] (Solution)
experimental data by ICP
[Cu / Te]film = 0.72 [Cu / Te]sol
Fig. 7 Copper to tellurium ratio, as measured by ICP, for a set of films deposited in solutions of different [Cu]/[Te] compositions. The solid line was calculated based on eq. (6).
-0.2 -0.3 -0.4 -0.5 -0.6
0 20 40 60 80 100
experimental values composition reference line
Cu content in deposited film (at%)
Cathode potential, E / (V vs. Ag / AgCl)
Fig. 8 The relationship between composition and deposition potential under potentiostatic electrodeposition at 303 K from a bath containing
1:0103M-CuCl
2and4:0104M-TeO2. The solid line indicates the
[image:4.595.52.285.70.243.2] [image:4.595.307.543.77.246.2] [image:4.595.50.285.571.748.2]This indicated that copper and tellurium were co-deposited onto the electrode surface. The Cu/Te ratio in the films, as measured by inductively coupled plasma (ICP), showed a linear correlation with the [Cu]/[Te] ratio in the solution. The Cu/Te ratio in the film was barely affected by difference in the deposition potential. Crystalline Cu2Te films were
obtained with potentials of0:25to0:55V vs. Ag/AgCl. The film closest to the stoichiometry showed a sharp diffraction peak. The process control demonstrated in this study will allow the preparation of various semiconductors considering the material design.
REFERENCES
1) P. Bottcher: Agnew. Chem. Int. Ed. Engl.27(1988) 759–772. 2) C. D. Lokhande and S. H. Pawar: J. Phys. D: Appl. Phys.20(1987)
1213–1214.
3) I. S. Chuprakov and KH. Dahmen: Chem. Mater.10(1998) 3467–3470. 4) H. Saloniemi, T. Kanniainen, M. Ritala and M. Leskela: Thin Solid
Films326(1998) 78–82.
5) R. Chen, D. Xu, G. Guo and L. Gui: J. Mater. Chem.12(2002) 2435– 2438.
6) J. W. Gardner: Engl. Electr. J.18(1963) 16–21.
7) W. Lehmunn: J. Electrochem. Soc.104(1957) 45–50. 8) D. A. Cusano: Solid State Electron.6(1963) 217–232. 9) M. Aven and D. A. Cusano: J. Appl. Phys.35(1964) 606–611. 10) P. J. Mosticat: Phys. Status Solidi.11(1972) 531–538.
11) G. P. Sorokin, G. Z. Idrichan, L. V. Derkach, E. V. Kovton and Z. M. Sorokina: Izv. Akad. Nauk S. S. S. R. Neorg. Mater.10(1974) 969– 974.
12) K. Srudhar and K. Chattopadhyay: J. Alloys Compd.264(1998) 293– 298.
13) B. Li, Y. Xie, J. Huang, Y. Liu and Y. Qian: Chem. Mater.12(2000) 2614–2616.
14) K. Murase, H, Uchida, T. Hirato and Y. Awakura: J. Electrochem. Soc.
146(1999) 531–536.
15) J. Herrero and J. Ortega: Sol. Energy Mater.17(1998) 357–368. 16) Allen J. Bard and Larry R. Faulkner:Electrochemical Methods, (John
Wiley and Sons, Inc, United States of America, 1980) p. 32. 17) I. Barin: Thermochemical Data of Pure Substances Part II, (VCH,
1989).
18) M. Pourbaix:Atlas of Electrochemical Equilibria in Aqueous Solution, (Pregamon Press, Oxford, 1966) p. 385.
19) R. K. Pandey and S. N. Chandra: Handbook of Semiconductor Electrodeposition, (Marcel Dekker, Inc, New York, 1996) p. 44. 20) JCPDS Data Base, Card No. 39-1061 (unindexed peaks), JCPDS,
Swarthmore, PA.
22
24
26
0
500
1000
0 500 1000
25
30
35
40
45
Cu2Te Ti
(100) (101) (110)
(103)
(2θ θ / degree)
-0.25V -0.3V -0.35V -0.4V -0.45V -0.5V -0.55V
Intensity / cps
(a)
(b)
Fig. 9 X-Ray diffraction patterns of films electrodeposited at 303 K from hydrochloric acid electrolytes ([HCl] = 0.1 M, pH = 1.0) containing1:0103M-CuCl
2and4:0104M-TeO2. The film in (a) was deposited at0:35V, while the films in (b) were obtained
[image:5.595.101.496.72.351.2]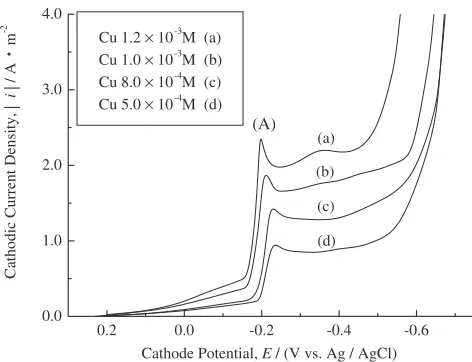
![Fig. 7Copper to tellurium ratio, as measured by ICP, for a set of filmsdeposited in solutions of different [Cu]/[Te] compositions](https://thumb-us.123doks.com/thumbv2/123dok_us/368986.534351/4.595.50.285.571.748/copper-tellurium-ratio-measured-lmsdeposited-solutions-dierent-compositions.webp)
![Fig. 9X-Ray diffraction patterns of films electrodeposited at 303 K from hydrochloric acid electrolytes ([HCl] = 0.1 M, pH = 1.0)containing 1:0 � 10�3 M-CuCl2 and 4:0 � 10�4 M-TeO2](https://thumb-us.123doks.com/thumbv2/123dok_us/368986.534351/5.595.101.496.72.351/diraction-patterns-lms-electrodeposited-hydrochloric-electrolytes-containing-cucl.webp)
