Similarly as the definition, neither the classification of services is clearly defined. Since the definition of services is not unanimous for the practice, it uses to be purposefully adapted. A rational solution often is to define services by the list of activities based on their classification.
CLASSIFICATION OF SERVICES
At present, there exits several classification ap-proaches and schemes in the area of services. The basic classification rules were set by Hill. Hill's rules are based on the differentiation of two types of serv-ices: services connected to commodities and services for people. The first group – services connected to
commodities – includes such activities which change the physical properties or the state of commodities. There belong namely freight transport or repair and maintenance services. The second group – regarding persons – includes such activities which are chang-ing the physical or psychical state of people, e.g. personal transport, communications, education, culture, health and personal services. Many activities (e.g. financial, insurance or computer services) can regard both groups. Hill’s wide definition helped to clarify the unifying criteria, it is, however, less us-able for the empirical and analytic activities in the area of services.
For the orientation in the problem, we can list several up to now used classification approaches for the area of services:
World trade with services in globalisation processes
Světový obchod službami v globalizačním proces
V. JENÍČEK
University of Economy, Prague, Czech Republic
Abstract: Services become an important participant of the international economic relationships during the last 20 to 30 years. Since the sector of services used formerly to be applied rather more on the national level, we speak of the inter-nalisation of services, which become an important article of international trade. Compared to the dynamics of world trade with tangible goods, services reach higher year-to year increases and their share in the world trade turnover still increases. The explanation lies in the growing importance of services connected to the level of the economy development and in the foreign trade with services liberalisation. The value of the services export on the world level reached approx.1.5 trill. USD in 2000. The value of the world export of tangible goods was 5.5 trill. USD in the same year, so that export of services covered approximately one fifth of the total world tangible and non-tangible goods. The share of services in the world export (tan-gible and non-tan(tan-gible) grew continually.
Key words: world trade with services, classification of services, services in foreign trade, structure of the trade with services
Abstrakt: Služby se staly v posledních dvaceti až třiceti letech významným účastníkem mezinárodních ekonomických vzta-hů. Protože sektor služeb se dříve uplatňoval spíše v národním měřítku, hovoří se o procesu internacionalizace služeb, které s stávají důležitým artiklem mezinárodního obchodu. Ve srovnání s dynamikou světového obchodu se hmotným zbožím dosahují služby vyšších meziročních přírůstků a jejich podíl na světovém obchodním obratu se stále zvyšuje. Vysvětlen je v rostoucím významu služeb spojeným se stupněm vyspělosti ekonomiky a v liberalizace mezinárodního obchodu službami. Hodnota vývozu služeb v celosvětovém měřítku v roce 2000 dosáhla cca 1,5 bil. USD. Hodnota světového vývozu hmotného zboží činila ve stejném roce 5,5 bil. USD, takže podíl služeb pokrýval zhruba jednu pětinu celkového světového hmotného i nehmotného vývozu. Podíl služeb na celkovém světovém (hmotném i nehmotném) vývozu se nepřetržitě zvyšoval. Klíčová slova: světový obchod službami, klasifikace služeb, služby v zahraničním obchodě, struktura obchodu službami
The contribution presented at the international conference “Foreign trade and globalisation processes” 20–21st
1. Services are often dividend according to the cha-racter of their performance into:
– distribution services– transport, communica-tions, trade
– producer oriented services, often called also production services or business services – fi-nancial, extension, computer, software, trade conjunctural, construction, engineering, leasing, information, advertisement, marketing, book-keeping, law, telecommunication, real estate, research and development etc.
– social services– health care, education, culture, state administration,
– personal services – tourism, recreation, public catering, services for household maintenance (Browning, Singelman 1975).
2. From this classification, Noyelle a Stanback (1982) issued in the 80s by dividing services into six ca-tegories:
– distribution services – transport, communica-tions, wholesale trade,
– the complex of community services – central administration, finances, insurance, NGOs,
– non-profit services – health care and educa-tion,
– retail trade,
– consumers services – hotels and restaurants, personal services, repairs, free time services, household services,
– governmental services.
In this classification, the position of important business services is not clear.
3. Another classification scheme is offered by Gardey (1986), who combines the criteria introduced by Hill and extended them by the view of measuring productivity of services into:
– productive services(the resulting product can be measured as commodity) which is connected either to:
– movement or modification of commodities (e.g. freight transport, repairs),
– or sale of commodities (trade, real estates of-fices),
– or the movement of persons (e.g. personal trans-port),
– productive non-material services of the trad-able character (measuring if the result is difficult) – finances, research and development
– non-material tradable services – health, educa-tion and entertainment services,
– organisational services (services in the sphere of management) – public administration. In both latter cases, measuring of the result is prac-tically impossible.
4. The International Standard Industrial Classifica-tion (ISIC) identifies 138 activities in the services sphere. The sector of services is, according to this classification, divided into six areas:
– public and construction services,
– services for wholesale and retail trade, hotels and restaurants,
– transport, stocking, communication and financial services,
– services connected with leasing of the movable and immovable things, real estate services, public administration, defence, social services accord-ing to the law,
– services connected with education, health care and social care,
– other community, social and personal services, household services etc.
5. The U.N. classification issues from the System of National Accounts. In the frame of this system, services are divided into nine groups:
– trade, repairs of motor vehicles and consumers goods,
– hotels, restaurants,
– transport, communication,
– financial mediation (activities of financial institu-tions and insurance),
– commercial services (inter-enterprise services, computer, economic, administration, legal etc., commercial services for the population),
– public administration, defence, social security, legal courts,
– education,
– health and veterinary services,
– other services (research, development, activities of social, recreational and sports institutions). 6. The GATT division which was taken over by the
WTO structure of services as follows:
– from the macro-economic viewpoint:
– services materialised in goods – films, audio- and visual recordings, magnetic media with informa-tion, books etc
– services complementary to trade with tangible goods – marine transport, manipulation with goods, storing, port services, other transport services land, water and air, insurance, banking services directly connected with tangible goods, representation services, advertisement etc.
– Services of substitution character to trade with tangible goods – leasing, charter, franchising, repairs and maintenance,
legal, engineering, accounting and other services, transfers of real estates, telecommunications, data processing, information services, services for tourism etc.
– from the micro-economic viewpoint: – trade services
– professional services – legal, auditing, account-ing, fiscal, architectonic, engineeraccount-ing, health, veterinary, social care etc.
– computer and the related services (advising at the hardware and software installation, computer databases etc.)
– research and development services
– real estate services
– leasing
– other trade services – advertising, market re-search, managerial and consulting services, scien-tific and technological advisory services, human resources services, polygraphic, conference and other services
I. communiaction services – postal services
– currier services
– telecommunication services (phone, cable, teletex, data transfer, electronic data exchange, e-mail etc.)
– audio-visual services (cinema, wireless, TV, re-cording etc.)
– other telecommunication services
II. building and the related ingeneering services – building for communal purposes
– building for other purposes
– installations
– building completing
– other building services
III. distribution services IV. commissionary services
– wholesale
– retail
– franchising
– other distribution services
V. educational services
– in the sphere of basic education
– in the sphere of secondary education
– in the sphere of higher education
– in the sphere of adult education
– other educational services
VI. environment protection services
– sewage cleaning services – refuse liquidation services – asanation and related services
– other environment protection services
VII. financial services
– insurance services
– banking and other financial services
VIII. (other than under I.)
– hospitals
– other health services – socal services
IX. travelling and tourism
– services of hotels and restaurants – travel agencies services
– services for tourism
– other services connected with travelling
X. recreational cultural and sports services
– entertainment (theatre, concerts etc.) – press agencies services
– services of libraries, archives and museums – sports and recreation services
– other related services
XI. transport services
– sea transport
– internal river transport – air transport
– cosmic transport – railway transport – oil- and product-ways – combined ransport – other transport services
XII. other services not included elsewhere
Classification of services in international trade
is done according to the rules of the balances of pay-ment statistics used by the IMF and WB:
– Transportation
– Passenger services
– Freight – includes transport costs, transport in-surance and other supporting services during transport, stocking, loading and unloading of the cargo, packing and unpacking of goods, forward-ing, transloading
– Other transportation – includes on one hand serv-ices to passenger transport (including accompanying services like ticket reservation, personal luggage transport etc.), on the other services of the port (i.e. services in the narrow sense not included in payments for transport, like loading of fuel, airport charges, port charges etc.), then charter of transport means and also different other transport services like air post and other.
– Travel – services in the areas as business trips, student and study trips, field trips and other travel (travelling in the narrow sense: tourism, holiday travelling, family trips, health care, sport events, conferences etc.)
– Other private services – includes:
– Communications (including post, cable, phone, te-lecommunication and other services based on it)
– Consultancy (through press, TV, wireless, post etc.)
– Broker services (i.e. payments for services provided by brokers to their customers, brokerage, mediation, financial services, and the like, financial services provided by banks, insurance companies and finan-cial houses in the form of fee for services)
– Management (i.e. accounting, auditing, controlling services etc.)
– Operational leasing (other than charter),
– Journals and other periodicals supplied through mail order,
– Refining services and repairs, services support-ing trade with commodities, as for example stock exchange services – termed transactions, arbitrary services etc.
– Professional and technical services (development, research, instruction services, know-how), incomes of the owners of patents, copyrights and other non-financial non-tangible assets (incomes of this kind are often of the character of payments for the use of patents, licenses and copyrights and are generally included among the payments evoked by the sale or purchase of services).
In the categorisation and definition of services in the international trade, there are also used the important terms of Factor Services and Non-fac-tor Services.
Factor services are financial transfers including the use of labour or capital (production factors, hence factor services) abroad. It means financial transfers of wages, yields from the invested capital, dividends, interest rate, leasing payments etc. These services are non-tradable in the international market, i.e. they are not the object of international trade. Non-factor serv-ices are tradable servserv-ices, their transfer is connected with the market mechanism and their are the object of international trade. In the sense of international habits and utilised definitions of services, we under-stand under the international trade with services the trade with non-factor services only.
The GATT publications include transport services, tourism and other private services under the head-ing of “commercial services”. Some services are from their definition tradable only in domestic markets, these are not included into the international eco-nomic relationships. It regards e.g. social services, some environmental services, communal services, governmental services etc.
Most professional services (banking, financial and insurance services, public relation services, research
and development, market research etc.) were for a long time excluded from international trade for the reasons of the internal market protection. At present, when the liberalisation negotiations regarding trade with services take place, already a wide range of services, including namely finance, banking and insurance, are using global communication structures, highly developed data transfer technologies and approach to databases, what is the basic prerequisite of inter-national competitiveness.
The differentiated opinions on trade classification led to the agreement on forming n unified, commonly used classification of international trade with serv-ices. On the forming of it, the following international organisations participated:
– European Committee (EUROSTAT),
– International Monetary Fund,
– Organisation for Economic Co-operation and De-velopment (OECD),
– United Nations Organisation,
– United Nations Conference for Trade and Develop-ment (UNCTAD),
– World Trade Organisation (WTO).
The listed organisations published by the end of 2000 the proposal of common classification under the title the Manual on Statistic of International Trade in Services.
From the extensive proposal of 160 pages, which includes the conceptual frame for creating an interna-tional statistics on internainterna-tional trade with services, we include further the most important parts.
This first Manual on Statistic of International Trade in Services represents an important step towards creating a more transparent and more detailed system of classification and evidence of services. It is aimed at serving the needs of both the processors and users of the international trade in services statistics. Even though its primary use was supposed to be that of the persons processing statistics, it is also an important tool for governmental and non-governmental organi-sations using statistical information regarding trade in services. Moreover, it can help also to traders and all other users who need to predict the development in this area.
multilateral round, called GATS 2000, was just only started and is going on.
The unified statistical frame is necessary for the analysis of the ingoing globalisation, which brings about internalisation both of production and trade, as well as monitoring of the sector of services perform-ance. The unified statistics issues from the need of a more detailed approach to the trade with services.
The term “international trade with services” is in the Manual construed for the wide use. In the general sense, it covers the trade with services as the trade between residents and non-residents. It extends the notion of the trade by services supplied by local en-terprises. In the Manual, these transactions are listed as the Foreign Affiliated Trade in Services – FATS. In the Manual, there are discussed certain categories of services which do not get into the existing standard of international statistics.
The Manual issues from the internationally agreed standards used by some international organisations. In the first place, these are the standards of the IMF “Balance of Payments Manual” – 5th issue (BPM5),
edited in 1993, which includes recommendations for defining, evaluation, classification and record-ing of the trade in services among residents and non-residents1. Another important standard is the
System of National Accounts 1993 (1993 SNA), which supports many of the recommendations included in the Manual regarding the data on services supplied by the foreign affiliates. Even if there has been re-corded a considerable progress in the unification of definitions and classifications, still there are many unsolved questions in the area, for the further ne-gotiations on which the Manual, however, supplies a good base.
For the evidence of trade with services between residents and non-residents, the Manual recom-mends to issue from the standards used in the frame of the BPM5, to develop this classification into the extended classification of services in the balance of
payments (Extended Balance of Payments Services – EBOPS) classification. In the Manual, there are outlined the relations among the EBOPS classification, the CPS (Central Product Classification) and the List of Services in the frame of GATS (“GNS/W/120”).
Methodological procedures regarding the identi-fication of services supplied by the foreign affiliates are not developed here. The labours directed by the OECD and EUROSTAT, which are reflected in the Manual offer an international consensus. Close to it is the ISIC data structuring of international organisa-tions (IS1C Categories for Foreign Affiliates – IFCA). Information on the activities of the foreign affiliates should include data on their sales.
The definitions used in the GATS ask for informa-tion outside the scope of the BPM5 and FATS. The lack of this information offers a space for the further negotiations.
The Manual offers a description of the important services incorporated in the international trade, as well as it is in the GATS nomenclature. However, the detailed classification of the system is missing. It regards namely the new types of services as tele-communications, financial services, environmental services and Internet services. The Manual recom-mends continuing further in developing this area and the negotiations.
The Manual recommends a series of continual solutions for creating of internationally accepted standards of statistical data on international trade with services. Many countries regard the labours in this feld as long-term ones. The list includes a series of recommendations for the implementation phase of the offered solutions in the individual countries.
POSITION OF SERVICES IN FOREIGN TRADE
The analysis of the role and position of services in the world economy is based namely on the statistical
1 The notions of residents and non-residents are utilised in the U.N. statistics (National Accounts) and the IMF
data of the UNCTAD (United Nation Conference on Trade and Development), and that the Handbook of Statistics. Further resources are the yearbook Balance of Payments Statistics Yearbook, IMF. Both UNCTAD statistics, from which the majority of analyses in this work issue for the data comparison reasons are methodologically different, differently organised and there are some other differences in them:
– the Handbook of Statistics includes data for 171 countries in the area of services. The data for the individual country are structured into 10 sub-groups (1 services total, 2. transport, 3. tourism, 4. com-munication, 5. constructions, 6. computer and information services, 7. financial and insurance services, 8. other business services, 9. fees and licence fees, 10. personal, cultural and recreation services).
– the Handbook of Statistics includes data of 174 countries (compared to the CD-ROM, it includes further Taiwan, Azerbaijan and Georgia and be-sides data for Belgium-Luxembourg, it includes also separate data for Luxembourg, it does not list Iraq). It does not include structuring into individual types of services, on the contrary, compared to the CD-ROM, in includes macro-aggregates for the geographical groups (world total, developed market economies, developing countries and Central and Eastern European countries – CEECs).
Both statistics work with the following economic-geographical structuring:
– Developed market economies (24 countries): – America: Canada and the U.S.,
– Europe: Belgium-Luxembourg, Denmark, Finland, France, the Netherlands, Ireland, Island, Italy, Ger-many, Norway, Portugal, Austria, Greece, Spain, Sweden, Switzerland, Great Britain,
– Asia: Israel and Japan,
– Oceania: Australia and New Zealand,
– CEECs (14 countries): Albania, Byelorussia, Bul-garia, Czech Republic, Estonia, Latvia, Lithuania, Hungary, Moldavia, Poland, Rumania, Russian Fed-eration, Slovakia and Ukraine
– Developing countries: all other hitherto not listed countries of Africa, Asia, Europe, Latin America and Oceania.
The only regularly published resources on interna-tional services are the statistics of the IMF, namely the Balance of Payments Statistics Yearbook. In this yearbook, there are every year published the payment balances of all the IMF member countries (169 coun-tries). The balance of payments is the most impor-tant overview of all economic transactions realised
between the national economy and abroad for the given period of time (usually 1 year). The Balance of Payments Statistics Yearbook uses a very rough structuring for the needs of analyses in the sphere of services, which are divided as follows:
– transport services (further divided into freight, personal transport and other transport),
– services for tourism,
– governmental services (not used in international trade),
– other services.
The role of services in economy
World economy undergoes a permanent develop-ment, connected during the last decades with a deep structural transformation issuing from the deepening specialisation which influences in a considerable way the economy and consequently also the social sphere of the whole society. One of the dominant features of structural transformation is the massive “production” and consumption of services. This process is often called the “third industrial revolution” or “ascending of the economy of services” or also even “entering the information society“.
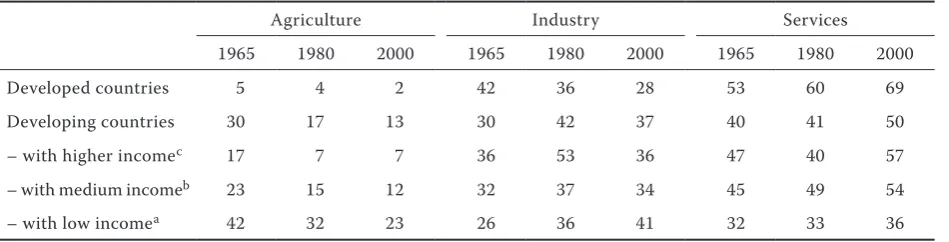
The share of services in the GDP creation belongs among the often-used indicators of the economy de-velopment level. The more developed is the economy of the given country, the higher is usually the share of services (the tertiary sector) in the GDP creation and the total employment. The validity of this rule is supported by statistical data of most countries (Table 1).
At present, services create about 70% of GDP in developed countries. Their share has grown namely to the detriment of industry. Among developing countries, a very little developed tertiary sector is recorded namely in the countries with especially low performance of economy (per capita GDP be-low 800 USD). In some areas, developing countries have a specific comparative advantage in the trade with services. It regards namely transport services for tourism.
account-ing and auditaccount-ing, choice and schoolaccount-ing of employ-ees up to specific activities, projecting or supply or performing of catering, repairs, cleaning etc. Here, it is relevant to poise a question to which extent has the enormous development of services during the last decades caused by the statistical evidence shift of activities from the primary and secondary into the tertiary sector. The share probably cannot be enumerated.
The considerable development of services in the world economy dates back from the beginning of the 80s of the 20. century. The dynamics of the services development was (besides the mentioned shift of ac-tivities recording) namely by the following factors: – technological development demands still wider
accompanying of material flows by the non-ma-terial ones which thus decreases labour costs of production
– since the 80s, there are recorded high increments of foreign direct investments into services, an enormous international movement of labour, great development of the trade with knowledge-based services (know-how, licences),
– urbanisation and expansion of public sector call for the development of the communal and accom-panying services
– deterioration of the Bretton-Wood monetary system evoked an enormous development of banking and consulting services,
– demand for telecommunication and audio-visual services increases;
– the development of micro-electronics and infor-mation technologies evoked the development of the international transfer of information – the development of computer technologies evokes
the need for new services in the sphere of software, data and information processing,
– management of enterprises demands specialised services in the sphere of management and human resources etc.
Economic-geographical structure of the foreign trade with services
The UNCTAD statistics divide world from the economy and geography viewpoint into developed countries, developing countries and Central and Eastern European countries (CEECs). The content of these groups was supplied at the beginning of this chapter.
Developed market economies show a high share in the world trade with services in the long-term, period. Territorial structure of this trade undergoes considerable changes during time.
The share of developing countries and the CEECs increases to the detriment of the economically de-veloped countries. The share of dede-veloped countries in the total export of services moves between 74 to 80% with a slightly declining tendency. The share of developing world is in the range 19–22% with a growing tendency. The CEECs share 4% in the world export of services (Table 2).
The biggest exporters of services are economically developed countries led by the U.S., which export in value more than the double of the services export of the Great Britain, which ranks at the second place. The U.S. cover 1/5 and top ten biggest exporters then over 2/3 of the world export of non-tangible goods. The top ten of the biggest exporters is not changing, there were only some changes in the countries sequence.
[image:7.595.64.539.84.205.2]A high share between the value of the export of services and tangible goods is reached by Austria (52.4%) and Spain (46.6%), both countries namely
Table 1. Development of the GDP structure according to sectors (in %)
Agriculture Industry Services
1965 1980 2000 1965 1980 2000 1965 1980 2000
Developed countries 5 4 2 42 36 28 53 60 69
Developing countries 30 17 13 30 42 37 40 41 50
– with higher incomec 17 7 7 36 53 36 47 40 57
– with medium incomeb 23 15 12 32 37 34 45 49 54
– with low incomea 42 32 23 26 36 41 32 33 36
a developing countries with per capita GDP up to 800 USD b developing countries with per capita GDP 800–4 000 USD c developing countries with per capita GDP over 4 000 USD
owing to the demand for tourism services. On the opposite, a low rate is recorded by Germany (14.6%) and Japan (15.9%); both countries traditionally reach a high passive balance in the non-tangible goods trade. Both countries are strongly oriented on the tangible goods export, which demands increased volumes of the accompanying services. Both Germany and Japan import these services. The top ten of the service exporters is almost identical with the top ten of the tangible goods exporters, only in services Canada was replaced by Austria.
A stable position in the second ten of the services exporters is held by the developed European countries of the smaller economic size (Switzerland, Denmark and Norway), regularly placed here are Singapore and Korea, and during the last years, the top twenty was entered by China and Turkey.
The incorporation of the CEECs into international trade with services is – similarly as in tangible goods – relatively weak. Russia gained 12.4 bill. USD for the export of services, which ranks it only at the 22nd
place in the world, Poland 10.9, the Czech Republic 7.4, Hungary 4.9, Croatia 4.0, Ukraine 3.9, Slovakia 2.3 and Slovenia 2.0 bill. USD.
In the world import, developed economies partici-pated by 71.8%‚ developing countries by 24.8% and the CEECs by 3.4%. From the economic-geographical viewpoint, the structure of the services import is similar to that of export since the big exporters are usually also gig importers. The biggest changes in
the import of services structure occurred, the same as in export, in the developing world.
The biggest exporters of services are simultaneously also their big importers; only the sequence of countries is different. In the import of services, the U.S. lead the same as in export, followed by Germany and Japan. These three countries cover almost 1/3 of the import of services (33.8%). The top ten biggest importers participate in the world import by 63.5%.
Among the other important importers of services (over 20 bill. USD), we can include China (28.8), Spain (27.5), South Korea (23.5), Sweden (21.8) and Ireland (20.0).
The most important changes in the export of services occurred in the frame of developing world (Table 3). The increase of the developing countries share in the export of services was unanimously caused by the great increase of the trade of some East Asia countries (namely Singapore, Korea, Thailand, China and Taiwan) to the detriment of the other developing regions (above all the countries of Latin America and Africa). The share of the Latin America countries in the world trade dropped to 17.5% in 2000 and the share of the Africa countries down to 7.5% (Jeníček 2005).
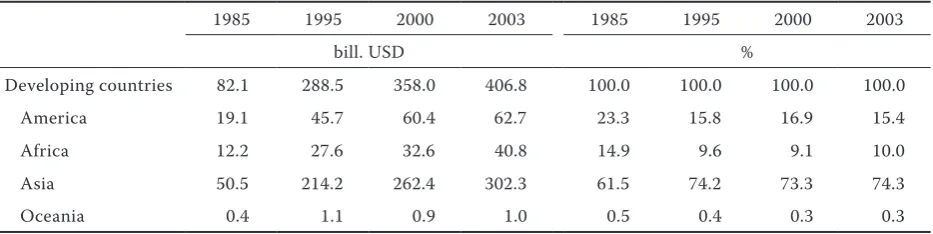
[image:8.595.62.533.491.576.2]From the developing regions, the most incorporated ones in the international trade with services are the Asian countries. In 2000, they covered 72% of the developing countries trade with the export in the value of 212 bill. USD. In the frame of Asia, there
Table 2. Development of the export of services according to economic-geographical groups
1985 1995 2000 2003 1985 1995 2000 2003
bill. USD %
World total 407.476 1 239.719 1 528.032 1 860.351 100.0 100.0 100.0 100.0 Developed countries 320.313 930.372 1 143.254 1 409.325 78.6 75.0 74.8 74.1 Developing countries 82.119 288.537 358.005 406.798 20.1 23.3 23.4 21.9 Source: Handbook of Statistics, UNCTAD 2004
Table 3. Development of the import of services in developing countries
1985 1995 2000 2003 1985 1995 2000 2003
bill. USD %
Developing countries 82.1 288.5 358.0 406.8 100.0 100.0 100.0 100.0
America 19.1 45.7 60.4 62.7 23.3 15.8 16.9 15.4
Africa 12.2 27.6 32.6 40.8 14.9 9.6 9.1 10.0
Asia 50.5 214.2 262.4 302.3 61.5 74.2 73.3 74.3
Oceania 0.4 1.1 0.9 1.0 0.5 0.4 0.3 0.3
[image:8.595.65.532.630.747.2]grew quickly the share of the East Asia (from 42% in 1985 to 57% of the total developing countries export in 2000). This high share of East Asia was caused, as was already mentioned, by the considerable exports of Singapore (30.4 bill. USD), South Korea (25.4), China (24.5), Taiwan (16.6), Thailand (15.6), Philippines (15.1) and Malaysia (14.9). From the other Asian countries outside the mentioned eastern region, important is the share of Turkey (23.2 bill. USD).
The lowest share in the export of developing regions is that if the economically weakest continent, Africa (7.7%‚ 22.5 bill. USD) with the still decreasing tendency (in 1985, the share of Africa in the world export was almost 12%). Important exporters in this region are the North Africa countries – Egypt (7.8 bill. USD – about ¼ of this volume flows from the manage-ment of the Suez Canal), Morocco and Tunisia (about 2.5 bill. USD). The UNCTAD statistics do not supply the data for the South Africa Republic. According to other data, not compatible to the UNCTAD statistics (Balance of Payments Statistic Yearbook), South Africa Republic is after Egypt the second biggest exporter of services.
From the area of Latin America, the biggest suppliers of services are Mexico (11.9 bill. USD), Brazil (7.1 bill.), Argentina (4.5), Chile (4), Dominican Republic (2.4) and Columbia (2.0).
Also in the import of services, there is the most intensively included Asia from the developing regions, which in 2000 covered 69% of the developing coun-tries trade with the export value 222 bill. USD. In the frame of Asia, similarly as in export, the biggest is the share of the East Asia countries (57%). So high a share was caused by the considerable imports of the newly industrialised countries of the region (Singapore, Korea, Taiwan and Thailand, further China, Turkey
Philippines and Malaysia). The lowest share in the developing countries import is that of Africa (9.2%, 29.9 bill. USD) with the still declining tendency.
From the area of Latin America, the most impor-tant buyer of services is Brazil (15.7 bill. USD) and Mexico (12.6 bill. USD).
Type structure of the trade with services
Definition structure of services issues from the Balance of Payment Manual, issued by the IMF, supplemented and extended at some activities by the OECD classification, which is used also by the EUROSTAT.
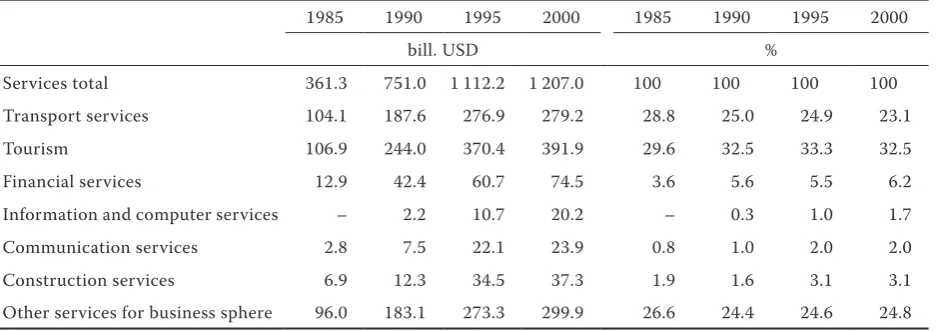
The structure of the world export of services is the following (Table 4):
– the share of transport services declines continually, during 15 years it decreased by 5.7 points (from 22.8 to 23.1%);
– the share of tourism increased from 29.6% to 32.5%;
– the share of financial services almost doubled (from 3.6 to 6.2%‚ i.e. by 2.6 points);
– the share of information and computer services is hitherto small, it is registered only since 1990, when it was 0.3% in the total services, however, its dynamics is high, during 8 years it increased almost six times (from 0.3 to 1.7%);
– the share of communication services increased almost 2.5 times (from 0.8 to 2%);
– the share of construction services increased from 1.9 to 3.1%;
[image:9.595.66.540.581.747.2]– the share of other services for business recorded a slight decrease (from 26.6 to 24.8%‚ i.e. by 1.8 points).
Table 4. Development of the world services export structure
1985 1990 1995 2000 1985 1990 1995 2000
bill. USD %
Services total 361.3 751.0 1 112.2 1 207.0 100 100 100 100
Transport services 104.1 187.6 276.9 279.2 28.8 25.0 24.9 23.1
Tourism 106.9 244.0 370.4 391.9 29.6 32.5 33.3 32.5
Financial services 12.9 42.4 60.7 74.5 3.6 5.6 5.5 6.2
Information and computer services – 2.2 10.7 20.2 – 0.3 1.0 1.7
Communication services 2.8 7.5 22.1 23.9 0.8 1.0 2.0 2.0
Construction services 6.9 12.3 34.5 37.3 1.9 1.6 3.1 3.1
Generally, the trade with services is conditioned by the size and level of development of the country, the relation between export and import is, however, conditioned by the specific conditions of the relevant country.
CONCLUSION
Hitherto, there does not exist a quite unanimous definition of services, neither is the nomenclature in this area fully stabilised. The rational solution becomes the definition of services according to activities of the base of their classification.
At present, services create in the developed econo-mies about 70% of GDP. The share of service in GDP and employment belongs among the indicators of the economy level of development. Efficient functioning of services is of basic importance for the perform-ance, productivity and competitiveness of the whole economy (Richardson 2000).
Services become an important article of the in-ternational trade. Compared to the dynamics of the world trade with tangible goods, they reach a higher year-to-year dynamics; they represent almost 1/5 of the world trade turnover.
International trade with services is ruled by the developing countries. Nevertheless, their share in the world trade with services declines (from 80% in 1990 to 73% in 2000). The CEE transforming economies register a small, but amazingly growing share.
We have not even approximate information on the real development of the international trade with serv-ices (in comparable prserv-ices). The choice of a reliable indicator by which we could eliminate the impact of price development in the international trade with services practically does nor exist.
The intensity of the individual countries incorpora-tion into the trade with services (measured by the per capita value of the services export) fluctuates in the developed countries in a wide range from less than 500 USD (Japan) up to almost 4 000 USD (Austria). Similarly as the export of commodities intensity, the value of the export of services per capita depends considerably on the size of the country and the de-velopment level of its economy but the values
cha-racterising the intensity of the country incorporation into the trade with commodities and the trade with services show considerable differences. The more efficient is the country in the export of commodities, relatively the less efficient it uses to be in the trade with services. By the same methodological procedure, we find out that the countries with a higher export of commodities show a relatively higher import of services. The correlation analysis certifies the relation-ship between the level of the “productive” services import and the export of commodities.
Among “net exporters” of services, there are on the first places the countries attractive for tourists. However, most countries with the active balance of the trade with services base their balance rather on the export of productive services. Dominant for them are the incomes connected with transport services, important are financial and information services. The highest negative balance of the trade with services (in the rate to turnover) is shown by Ireland, Japan and Germany – generally very successful exporters of commodities.
An important share in their passive balance is formed by the extensive import of “productive services”. It corresponds with the knowledge that the countries efficient in the sphere of commodity export usually show a high intensity of the “productive services” import.
The structure of the world export of services changes. The share of transport services declines, the share of tourism services and construction serv-ices increases, the dominant change is the growing importance of financial, information, computer and communication services (Jeníček 2006).
REFERENCES
Jeníček V. (2005): Development Economics. CUA Prague.
Jeníček V. (2006): International Trade and Developing Countries. CUA Prague.
Richardson M. (2000): Globalisation and International Trade Liberalisation: Continuity and Changes. Chelenham, Eldgar.
Arrived on 26th July 2006
Contact address: