Identification and Classification of Bulk Paddy, Brown,
and White Rice Cultivars with Colour Features Extraction
using Image Analysis and Neural Network
Iman Golpour, Jafar Amiri pArIAn and reza Amiri ChAyJAnDepartment of Agricultural Machinery Engineering, Faculty of Agriculture. Bu-Ali Sina university. hamedan, Iran
Abstract
Golpour I., ParianJ.A., Chayjan R.A. (2014): Identification and classification of bulk paddy, brown, and white rice cultivars with colour features extraction using image analysis and neural network. Czech J. Food Sci., 32: 280–287.
We identify five rice cultivars by mean of developing an image processing algorithm. After preprocessing operations, 36 colour features in RGB, HSI, HSV spaces were extracted from the images. These 36 colour features were used as inputs in back propagation neural network. The feature selection operations were performed using STEPDISC analysis method. The mean classification accuracy with 36 features for paddy, brown and white rice cultivars acquired 93.3, 98.8, and 100%, respectively. After the feature selection to classify paddy cultivars, 13 features were selected for this study. The highest mean classification accuracy (96.66%) was achieved with 13 features. With brown and white rice, 20 and 25 features acquired the highest mean classification accuracy (100%, for both of them). The optimised neural networks with two hidden layers and 36-6-5-5, 36-9-6-5, 36-6-6-5 topologies were obtained for the classification of paddy, brown, and white rice cultivars, respectively. These structures of neural network had the highest mean clas-sification accuracy for bulk paddy, brown and white rice identification (98.8, 100, and 100%, respectively).
Keywords: stepdisc analysis; HSI; HSV back propagation algorithm, bulk images
Rice (oryza sativa L.) is one of the most consumed crops in the world. The white rice is the vital food for a large part of the world population. Different food products are made from different classes of rice, therefore the identification of the rice cultivars is one of the most important factors for consum-ers. The identification of the rice cultivar class is a significant quality control standard for the Iranian food grain industries. Physical parameters of the rice cultivars, including colour, size, shape, and texture, are quality indices for the inspection of bulk rice samples (Tahir et al. 2007).
Quality control is one of the important topics in the food industry because, after harvesting, food prod-ucts are sorted and graded in different grades based on the quality parameters. Nowadays, the quality of rice is estimated intellectually and manually through
visual inspection by experienced resourceful people. Manual inspection however, is time consuming; in addition, the result of this method may be not reli-able due to human errors or unskilled technicians. Generally, this traditional method is exclusive, te-dious, and unreliable due to its intellectual nature (Sansomboonsuk & Afzulpurkar 2008).
The rice cultivars are so similar to one another that their identification is difficult. Machine vision technology (MVT) supplies an alternative to the
manual inspection of grain samples (Visen et al.
implement in automotive industry. With recent ad-vances in the computational power and memory of personal computers, machine vision systems can be applied for online inspection of agricultural products
(Choudhary et al. 2008).
Usually the image processing method consists of preprocessing and main processing. In the preproc-essing stage, segmentation, background removal, and object detection is done. These operations are necessary for the extraction of the morphological features (main processing) and can be used for the grain cultivars classification in the automation of rail car unloading operations at grain handling facilities. In recent years, several researches have been done into the on application of computer vision systems and artificial neural networks to identify the grain.
Paliwal et al. (2001) used eight morphological
fea-tures of five different cereal grains to train diverse ANN architectures. They obtained classification accuracies of 97% for wheat and oats and about 88% for barley and rye using four layer back propagation architecture for the ANN. Zayas et al. (1996) studied the cultivar classification of wheat. In this study, the pattern recognition methods were applied to the data base of the combined parameters for wheat kernels of six classes and seventeen varieties of soft and hard wheat. Colour and texture features are used to develop a neural network model for the classifica-tion of different food objects like Idli, Wada, Bonda etc., as proposed in (Anami et al. 2005). Anami et al. (2003) developed a method for the classification and gradation of different grains such as Ground nut, Bengal Gram, wheat, etc.
Many researchers have used artificial neural net-work to identify and classify the bulk of grain samples of five grain types, namely barley, oats, rye, wheat, and durum wheat using colour and textural features, and classification accuracies of over 98% were obtained for all grain types (Visen et al. 2004; Anami et al. 2006). A method for the classification and gradation of different grains (for a single grain kernel) such as groundnut, Bengal gram, wheat etc., was described
by (Anami et al. 2003). The determination of the
potential of the morphological features to classify different grains, classes, cultivars, damaged grains, and impurities using statistical pattern recognition techniques was the main focus of many studies (Keefe 1992; Spairstein & Kohler 1995). Sapirstein and Kohler (1999) investigated the effect of sampling on the precision and accuracy of the digital image analysis of different commercial sample grades of Canada Western Red Spring (CWRS) wheat.
Some researchers examined the use of colour fea-tures for the wheat classification and identification
of damaged kernels in wheat (Neuman et al. 1989;
Luo et al. 1999a). Only few works were carried out to incorporate textural features (Majumdar & Jayas 2000; Anami et al. 2005). Many studies also used the features of colour, morphology, and texture for the identification of grains and their quality using pattern classification (Shantaiya & Ansari 2010; Anami et al. 2011). Visen et al. (2002) used morphology and colour features for classification of Canadian grains, that the best classification accuracies (98.7, 99.3, 96.7, 98.4, and 96.9 for barley, CWRS wheat, CWAD wheat, oats, and rye, respectively) having been obtained by using specialist probabilistic neural networks. Most of the previously published studies have concentrated on identifying grain types from digital images one by one. While the pattern recognition approaches for the classification of bulk grain samples can be effective and reliable, rice crop has many postharvest stages such as drying, hulling, and whitening. The safe level of the moisture content is different for each cultivar compared to the others, so the cultivar identification in drying period can help to terminate the process at a specific value of the moisture content. The determina-tion of the moisture content of each cultivar in each stage is important. The identification of cultivars for hulling and whitening processes led to an intensive decrease in the broken rice content. Before starting the operations, the respective apparatuses should be adjusted for each cultivar. In addition, little work is cited on bulk rice images instead of single grain im-ages in the Iranian cultivar classification. Thus, the objective of this research was to classify bulk paddy, brown, and white rice cultivars using colour features.
MATERIAL AND METHODS
adequate moisture content (change of paddy rice to brown). The whitening of brown rice was carried out by a laboratory rice whitener (Setekka TM 05, Japan).
Methodology. The classification process of the rice cultivars included the image acquisition, preprocess-ing, feature extraction, use of neural network, and classifier using MATLAB® 2010, as explained bellow. Image acquisition. Images of three types of prod-ucts (paddy, brown and white rice) were acquired using the scanner Hp Scanjet G3110 (Hewlett-Packard Co., Beijing, China). All images had 300 dpi resolution and 540 × 390 pixels in BMP format. Accordingly, 1350 images were prepared (90 images for each type of cultivar). Every image had 3 repetitions of each rice sample.
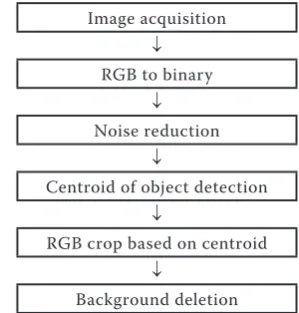
Preprocessing. This stage consists of image seg-mentation and noise reduction (Figure 2). The aim of this stage was the extraction of three sub images from the main image. The preprocessing implemen-tation is shown in Figure 3.
Colour feature extraction. An algorithm was devel-oped for the extraction of 36 colour features of bulk rice images (Table 1). The Eqs (1) to (4) were applied to calculate the mean, variance, standard deviation, and range for all sub images (Anami 19 et al. 2011).
Fajr
Khazar
Neda Shiroodi
Tarom mahali
(a)
(b)
(c)
[image:3.595.66.459.80.232.2]Tarom Mahali Shiroodi Neda Khazar Fajr
Figure 1. Used rice cultivars: (a) brown rice, (b) white rice, and (c) paddy
Mean = ∑xx∑y P(x,y) (1)
Variance = ∑x,y P(x – µ)2 P(x,y) (2) Range = Max (P(x,y)) – Min (P(x,y)) (3)
σ =
√
1 nΣ
(xi – µ)2 (4) n – 1 i=1The Hue (H), Saturation (S), Intensity (I) components of HSI colour space, and Hue (H), Saturation(S), and Value (V) of HSV colour space were extracted from
Image acquisition
↓
RGB to binary
↓
Noise reduction
↓
Centroid of object detection
↓
RGB crop based on centroid
↓
[image:3.595.336.486.389.546.2]Background deletion
[image:3.595.67.531.589.758.2]Figure 2. Preprocessing flowchart Table 1. Extracted features for classification of rice
No. Features No. Features No. Features
1 red mean 13 Hhsi mean 25 Hhsv mean
2 red variance 14 Hhsi variance 26 Hhsv variance
3 red range 15 Hhsi range 27 Hhsv std
4 red std 16 Hhsi std 28 Hhsv range
5 green mean 17 Shsi mean 29 Shsv mean
6 green variance 18 Shsi variance 30 Shsv variance
7 green range 19 Shsi range 31 Shsv std
8 green std 20 Shsi std 32 Shsv range
9 blue mean 21 intensity mean 33 value mean
10 blue variance 22 intensity variance 34 value variance
11 blue range 23 intensity range 35 value std
12 blue std 24 intensity std 36 value range
(a)
(b)
RGB components using Eqs (5) to (10) (Anami et al.
2011; Neelamma et al. 2011).
I = 1/3 (R + G + B) (5)
Shsi = 1 – 3 [min (R, G, B)] (6) (R + G + B)
Hhsi = arccos
{
[(R – G) + (R – B)]/2}
(7) [(R – G)2 + (R – B)(G – B)]1/2V = max (R, G, B) (8)
Shsv = V – min (R, G, B)/V (9) Hhsv = (G – B)/6S, if V = R
Hhsv = 1/3 + (B – R)/6S, if V = G
Hhsv = 2/3 + (R – G)/S, if V = B (10)
Neural network and classifier. Artificial neural
network of MATLAB® 2010 a software was used for
the classification of bulk rice. All 36 colour features were used in the training and testing of the artificial neural network. The multilayer feed forward neural network with back propagation (BP) algorithm was developed for the classification of rice cultivars as shown in Figure 4 (Anami et al. 2011). Firstly, a ran-dom section of data was used for the network train-ing and the residual data was used for the testtrain-ing. One and two hidden layers were implemented in the network training. Two decision indices of confusion matrix and classification accuracy were applied to
identify the rice cultivars in three modes of paddy, brown, and white rice. The number of neurons in the input layer was equal to the number of properties, i.e. 36 neurons, and the output layer according to the number of cultivars was equal to the number of rice category, i.e. five neurons. A five-bit binary number represented the category of classification (10000 to Fajr, 01000 to Khazar, 00100 to Neda, 00010 to Shi-roodi, 00001 to Tarom Mahali) (Figure 4).
Levenberg-Marquardt (LM) back propagation algorithm was used for the network training. The training, validation, and neural network testing were supplied using 1350 patterns (90 images for each cultivar). The network was trained and tested for 400 epochs and then applied to the validation of the data set. This epoch number was adequate to allow sufficient events before the training process was stopped. The optimised neural network was trained with the termination error (TE) = 0.01, learning rate (lr) = 0.08, and momentum coefficient (mc) = 0.6. The important features were selected by means of STEPDISC analysis and were used as neural network inputs (SAS 2004).
RESULTS AND DISCUSSION
[image:4.595.63.534.85.164.2]Classification process. As shown in Table 2, the Mean classification accuracies acquired 93.3% for
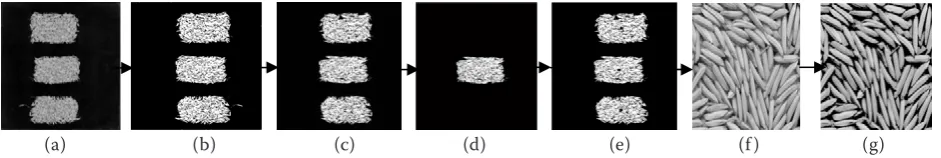
Figure 3. Preprocessing implementation process: (a) RGB image, (b) binary image, (c) noise reduction, (d) object separation,(e) centroid detection, (f) RGB image crop, and (g) background deletion
[image:4.595.63.427.577.756.2]
(a) (b) (c) (d) (e) (f ) (g)
Figure 4. Structure of neural network
Input layer
Hidden layer Output layer
Red variance
Value mean
Hhsi mean
Green variance
Green mean
Ri
ce
c
ul
tiv
ar
s
Fajr
Neda
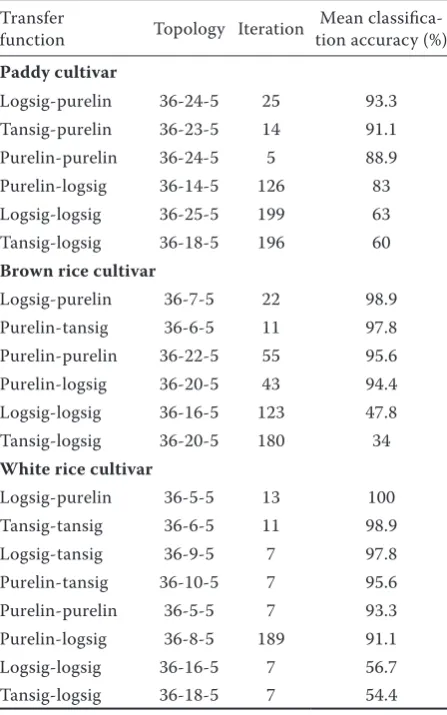
paddy cultivars (Fajr, Khazar, Neda, Shirooodi, Tarom mahali) with one hidden layer of neural network, respectively. According to Table 2, after network train-ing and simulation of the paddy data set, the results showed that the activation function of logsig with output transfer of purelin was the best structure and training algorithm of LM networks with LM training algorithm (topology of 36-24-5). Further, the activa-tion funcactiva-tion tansig with output transfer of logsig presented poor results for classifying of the paddy cultivars. As illustrated in Table 2, the classification results of the brown rice cultivars were better than the classification of paddy cultivars because the mean classification accuracy of brown rice acquired 98.9% with the activation function of logsig and output transfer of tansig (topology 36-7-5). The results of neural network for white rice cultivars classification are better than the results of paddy and brown rice classification because the classification accuracy was 100% for all cultivars (topology 36-5-5). The highest classification accuracy for paddy was obtained with
topology of 36-6-5-5 and two hidden layers. The number of neurons in the first and second layers was 6 and 5, respectively. The mean classification accu-racy of paddy cultivars for data set testing acquired 98.8%. The classification accuracy of these cultivars with the optimised network and two hidden layers showed great similarity compared to the results of the optimised network with one hidden layer.
To establish suitable topology, several neurons were placed in different layers for classification of brown rice cultivars. The result showed that the topology of 36-9-6-5 was the best one for identifying the brown rice cultivars. Thus, the highest average classification accuracy for this topology was 98.8%. After training and testing the networks with two hidden layers and different neurons, the highest mean classification accuracy acquired 100% with topology 36-6-6-5 in the identification of white rice cultivars. This re-sult is equal to the rere-sults of the network with one hidden layer with the mean classification accuracy equal to 100%. For the simplification of the network, the network with one hidden layer is suggested to identify these cultivars. These results were similar in the detection of phalaenopsis seeding diseases using colour and textural features by Yi (2007).
Feature selection. Several colour features had great effects on the cultivar classification. If one of these properties is selected to identify the cultivars, other features have no significant effect on the identifica-tion of improvement. Hence, some of them are un-necessary features. In order to study the importance level of the colour features, the STEPDISC analysis was used (Paliwal et al. 2004; Yan et al. 2005) to select the significant features.
Colour feature models for paddy. According to correlation coefficient of paddy, 13 features were selected in the classification model, because they were significant to the classifier. The selected features were arranged based on the decreasing level of the contribution in the classification model (Table 3). This was because the excessive number of features adversely affects the classifier by introducing
redun-dancies and increasing the complexity (Luo et al.
1999b). As a result, a useful feature may get over-shadowed by other features and may not contribute very much in the presence of certain input features.
The blue mean was the most important colour feature (average squared canonical correlation, ASCC = 0.191) and the average of intensity was not an important feature (average squared canonical correlation, ASCC = 0.681).
[image:5.595.64.288.401.759.2]Discriminant analysis was implemented with 5, 10, and 13 features. The mean classification accuracy
Table 2. The best topologies for classification of paddy, brown and withe rice cultivars
Mean classifica-tion accuracy (%) Iteration Topology Transfer function Paddy cultivar 93.3 25 36-24-5 Logsig-purelin 91.1 14 36-23-5 Tansig-purelin 88.9 5 36-24-5 Purelin-purelin 83 126 36-14-5 Purelin-logsig 63 199 36-25-5 Logsig-logsig 60 196 36-18-5 Tansig-logsig
Brown rice cultivar
98.9 22 36-7-5 Logsig-purelin 97.8 11 36-6-5 Purelin-tansig 95.6 55 36-22-5 Purelin-purelin 94.4 43 36-20-5 Purelin-logsig 47.8 123 36-16-5 Logsig-logsig 34 180 36-20-5 Tansig-logsig
White rice cultivar
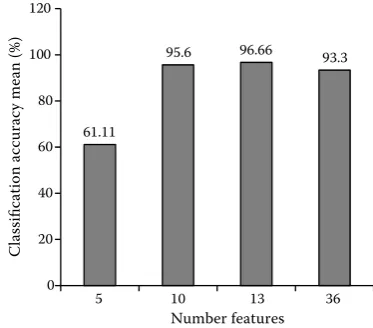
was calculated with all 36 features. After the feature selection, the mean classification accuracy using the first five features was poor (Figure 5). The mean ac-curacy – for paddy classification with the first five features was acquired 61.11%. The level of features contribution (see ASCC values) beyond the first 5 features was poor (Table 3).
[image:6.595.67.538.101.518.2]When all of 13 features were used, the mean ac-curacy was 96.66%. It was the highest acac-curacy in the identification of paddy cultivars. Also, with the first ten features, the mean classification accuracy acquired was 95.66%. Using 10 and 13 features, the mean classification accuracies were higher than the mean classification accuracies using 36 features (Figure 5). This result showed that only the first 13 features should be used. Classifying bulk paddy using the first 10 colour features instead of 36
fea-Table 3. STEPDISC analysis for the best colour features of paddy, brown and white rice
No. Features Canonical Corre- Average Squared lation (ASCC)
Partial r²
Paddy rice
1 blue mean 0.191 0.7642
2 green mean 0.293 0.8625
3 Shsv mean 0.457 0.8324
4 Shsi mean 0.626 0.6911
5 Hhsv mean 0.643 0.3086
6 Hhsi mean 0.662 0.4260
7 Shsv variance 0.668 0.2924
8 intensity variance 0.674 0.3025
9 green variance 0.675 0.0417
10 blue range 0.678 0.0323
11 Shsi variance 0.679 0.0244
12 Shsv range 0.680 0.0187
13 intensity mean 0.681 0.0177
Brown rice
1 Hhsi mean 0.170 0.6817
2 value Std 0.217 0.5718
3 red mean 0.318 0.4925
4 green mean 0.489 0.9121
5 blue mean 0.540 0.3726
6 Shsv mean 0.657 0.7654
7 Hhsv mean 0.688 0.2632
8 Shsi mean 0.772 0.4436
9 Shsv std 0.785 0.2393
10 Shsi range 0.790 0.0717
11 Shsv range 0.794 0.0782
12 Shsi std 0.801 0.0673
13 Hhsv std 0.804 0.9210
14 Shsi variace 0.811 0.0797
15 Hhsi variance 0.815 0.0845
16 intensity std 0.816 0.0649
17 blue variance 0.818 0.0773
18 Hhsi std 0.821 0.0791
No. Features Canonical Corre- Average Squared lation (ASCC)
Partial r²
19 red variance 0.826 0.0638
20 Hhsv variance 0.829 0.0418
21 blue std 0.829 0.0392
22 intensity variance 0.834 0.0852
23 Shsv variance 0.836 0.0547
24 value variance 0.840 0.0214
25 value mean 0.845 0.1191
White rice
1 blue mean 0.229 0.9160
2 Shsi mean 0.370 0.5726
3 Hhsv mean 0.421 0.4562
4 Red mean 0.471 0.6047
5 Shsv mean 0.512 0.2136
6 Shsv variance 0.551 0.1950
7 Shsi std 0.559 0.2386
8 green mean 0.592 0.1352
9 Hhsi mean 0.613 0.2126
1 Hhsv variance 0.633 0.1100
11 Shsi variance 0.642 0.1145
12 Shsi range 0.656 0.0786
13 Hhsi variance 0.666 0.0596
14 blue variance 0.670 0.0546
15 Shsv std 0.677 0.0437
16 value range 0.679 0.0396
17 value variance 0.681 0.0396
18 intensity variance 0.686 0.0647
19 blue std 0.690 0.0491
20 green variance 0.694 0.0447
21 value mean 0.698 0.0420
22 red range 0.701 0.0282
23 red variance 0.703 0.0390
24 green std 0.706 0.0253
25 intensity std 0. 710 0.0532
61.11
95.6 96.66 93.3
0 20 40 60 80 100 120
5 10 13 36
Classification accuracy mean (%)
Number features
Figure 5. Classification accuracies of bulk paddy samples using input of different features
[image:6.595.318.505.567.731.2]Colour feature models for brown rice. Table 3 shows the ranking of colour features for brown rice bulk. After STEPDISC analysis for the feature selec-tion, the hue mean was the most significant feature in circuits of level contribution (average squared canonical correlation, ASCC = 0.170), and the value of mean feature was the least significant feature (av-erage squared canonical correlation, ASCC = 0.845), because they were highly correlated. The STEPDISC analysis was carried out to determine the level of contribution of each colour feature of brown rice bulks to the colour model so that al1 the redundant features could be eliminated.
The results show, that, after the colour feature selection of all 36 features using STEPDISC analysis, six features of the selected parameters were reported by Majumdar and Jayas (1999). The mean clas-sification accuracy of brown rice with the first five features was (77.7%). The mean accuracy with both of 20 and 25 features were acquired 100%. But with 10 and 15 features, the mean accuracies were earned 97.77% and 93.33 %, respectively (Figure 6).
Colour feature models for white rice. Table 3 reveans that the number of features had a significant effect on improving the classification accuracy of the cultivars. The 25 features of the 36 extracted colour features were selected and ranked according to their contribution to the discriminatory powers of the cor-responding feature model. The colour features were quite powerful in discriminating the classification of white rice cultivars.
The blue mean feature with minimum (ASCC = 0.229) was selected as the most important feature and it played a vital role in the classification of bulk rice cultivars. The saturation mean became the second most important feature with ASCC = 0.370 (Table 3). This was because of the STEPDISC analysis process where first the most significant features were selected
(for example, blue mean), then the rest of the fea-tures were selected depending on their correlation with the features already being selected. Also, the significant difference between the means was the most important feature for these five cultivars.
The mean classification accuracies were very low (40%) for the first five features while they were very high (100%) for both 20 and 25 features (Figure 6). Majumdar and Jayas (1999) reported the classifi-cation accuracy close to 100% using images of bulk samples. For all discussed models, with an increase in the number of features, the classification accura-cies increase to a certain extent and then they remain constant or gradually decrease in analogy with the study conducted by Petersen (1992) on the identifi-cation of weed seeds by shape and textural analyses.
CONCLUSIONS
This study proved that the image analysis can be used to classify the rice cultivars as a new approach using colour features extraction of bulk grain images instead of single grain images. The classification accuracy obtained using different input feature sets for paddy, brown, and white rice cultivars was over 92%. In the classification of paddy cultivars the best results were obtained using the neural network with two hidden layers with topology 36-6-5-5, and the highest classification accuracy being 98.8%. Also brown rice and white rice cultivars could be classi-fied with close to 100% classification accuracy using just the 20 first features set.
References
Anami B.S., Burkpalli V., Angadi S.A., Patil N.M. (2003): Neural network approach for grain classification and gradation. In: Proceedings 2nd National Conference
on Document Analysis, and Recognition, Mandya, India, July 11–12, 2003: 394–405.
Anami B. S., Savakar D.G., Makandar A., Unki P.H. (2005): A neural network model for classification of bulk grain samples based on color and texture. In: Proceedings of International Conference on Cognition and Recogni-tion, Mandya, India, December 22–23, 2005: 359–368. Anami B.S., Savakis D.G., Unki P.H., Sheelawant S.S.
(2006): An artificial neural network model for separation, classification and gradation of bulk grain samples. In: IEEE 1st International Conference on Signal and Image
Processing, Hubli, India, December 7–9, 2006: 511–520. Anami B.S., Pujari J.D., Yakkundimath R. (2011): Identi-fication and classiIdenti-fication of normal and affected
agricul-40
77.7
98.8898.8810010098.9 97.793.33 010 100 100
0 20 40 60 80 100 120
white brown
Classification accuracy mean (%)
Product type
5 10 15 20 25 36
[image:7.595.73.276.87.223.2]Features:
tural/horticulture produce based on combined color and texture feature extraction. International Journal of Com-puter Application in Engineering Sciences, 1: 356–360. Choudhary R., Paliwl J., Jayas D.S. (2008): Classification
of cereal grains using wavelet, morphological, colour, and textural features of non-touching kernel images. Biosystems Engineering, 99: 330–337.
Keefe P.D.A. (1992): Dedicated wheat grading system. Plant Varieties and Seeds, 5: 27–33.
Luo X.Y., Jayas D.S., Symons S.J. (1999a): Identification of damaged kernels in wheat using a color machine vision system. Journal of Cereal Science, 30: 49–59.
Luo X.Y., Jayas D.S., Symons S.J. (1999b): Comparison of statistical and neural network methods for classifying cereal grains using machine vision. Transactions of the ASAE, 42: 413–419.
Majumdar S., Jayas D.S. (1999). Classification of bulk samples of cereal grains using machine vision system. Journal of Agricultural Engineering Research, 73: 35–47. Majumdar S., Jayas D.S. (2000): Classification of cereal grains using machine vision. III. Texture models. Transac-tions of the American Society of Agricultural Engineers (ASAE), 43: 1681–1687.
Neelamma K.P., Virendra S.M., Yadahalli R.M. (2011): Color and texture based identification and classification of food grains using different color models and haralick features. International Journal on Computer Science and Engineering (IJCSE), 3: 3669–3680.
Neuman M., Sapirstein H.D., Shwedyk E., Bushuk W. (1989): Wheat grain color analysis by digital image pro-cessing: II. Wheat class determination. Journal of Cereal Science, 10: 183–188.
Paliwal J., Visen N.S., Jayas D.S. (2001): Evaluation of neural network architectures for cereal grain classifica-tion using morphological features. Journal of Agricultural Engineering Research, 79: 361–370.
Paliwal J., Borhan M.S., Jayas D.S. (2004): Classifica-tion of cereal grains using a flatbed scanner. Canadian Biosystems Engineering, 46: 3.1–3.5.
Petersen P.H. (1992): Weed seed identification by shape and texture analysis of microscope images. [Ph.D. Dis-sertation.] The Danish Institute of Plant and Soi1 Science. Copenhagen, Denmark.
Sansomboonsuk S., Afzulpurkar N. (2008): Machine vision for rice quality evaluation. Technology and Inno-vation for Sustainable Development Conference (TISD 2008): 343–346.
Sapirstein H.D., Kohler J.M. (1995): Physical uniformity of graded railcar and vessel shipments of Canada Western Red Spring wheat determined by digital image analysis. Canadian Journal of Plant Science, 75: 363–369. Sapirstein H.D., Kohler J.M. (1999): Effects of sampling
and wheat grade on precision and accuracy of kernel features determined by digital image analysis. Cereal Chemistry, 76: 110–115.
SAS (2004): SAS/STAT 9.1 Users Guide. SAS Institute Inc., Cary.
Shantaiya S., Ansari M.U. (2010): Identification of food grain and its quality using pattern classification. Inter-national Conference [ICCT-2010], December 3–5, 2010. Special Issue of IJCCT, 2: 70–74.
Tahir A.R., Neethirajan S., Jayas D.S., Shahin M.A., Symons S.J., White N.D.G. (2007): Evaluation of the ef-fect of moisture content on cereal grains by digital image analysis. Food Research International, 40: 1140–1145. Visen N.S., Paliwal J., Jayas D.S., White N.D.G. (2002):
Specialist neural networks for cereal grain classification. Biosystems Engineering, 82: 151–159.
Visen N.S., Paliwal J., Jayas D.S., White N.D.G. (2004): Image analysis of bulk grain samples using neural net-works. Canadian Biosystems Engineering, 46: 7.11–7.15. Yan Z.L., Fang F., Ying Y., Xiu-Qin R. (2005): Identifica-tion of rice seed varieties using neural network. Journal of Zhejiang University Science, 6B: 1095–1100.
Yi H.K. (2007): Application of artificial neural network for detection phalaenopsis seeding diseases using color and textural features. Journal of Computers and Electronics in Agriculture, 57: 3–11.
Zayas I.Y., Martin C.R., Steele J.L. Katsevich A. (1996): Wheat classification using image analysis and crush force parameters. Transactions of the American Society of Agricultural Engineers (ASAE), 6: 2199–2004.
Received for publication May 19, 2013 Accepted after corrections September 16, 2013
Corresponding author: