JOURNAL OF FOREST SCIENCE, 51, 2005 (4): 177–185
For the establishment of the value Au (Au – value of major harvest at the end of rotation age) which was used as the basis for forest valuation, the cal-culation of logging costs was based on linear inter-polation as no more detailed data were probably available. Another possibility how to use logging costs are some calculation procedures for the de-termination of damage to forest crops according to currently valid Regulation No. 55/1999. The analysis of enumerative data proved that by using identical qualities that are used for forest valuation it is pos-sible to create to logging costs more accurate and more appropriate for individual combinations age and height of trees for all 13 groups of trees. Thus the calculation of logging costs would get much closer to the real growth dynamics of particular tree species. The expected simplification of calculation method could be a secondary but not less important result of this work.
Carrying out preparatory works I incidentally found out that there were some deviations from common tree species classification into the groups according to their growth, technical,
technologi-cal or operational characteristics. For example, the hornbeam is deduced from the beech for forest valu-ation, but for the yield determination (according to Schwappach mass tables and mensurational [yield] tables of Forest Management Institute in Brandýs nad Labem) – according to ČERNÝ et al. (1994) – it is deduced as a separate tree species. Birch ranks among soft-wooded broadleaves for the determina-tion of time consumpdetermina-tion standard, but in the techni-cal tables it belongs to hardwood broadleaves. Lime is deduced from beech for yield determination, for the purposes of logging and skidding it has, however, to be considered as a soft-wooded broadleaved tree. These differences affect logging costs.
These facts made me avoid a schematic approach and be careful with taking the achieved results and procedures for definite. When calculating model logging costs, I decided to carry out careful analysis of the creating of groups of trees. I created a com-parison table where all tree species listed in forest operational units (Forests of the Czech Republic in Hradec Králové, joint stock companies, private or corporate forest farms) were introduced as separate
A contribution to creating groups of trees for forest
valuation
M. MICHALČÍK
Faculty of Forestry and Wood Technology, Mendel University of Agriculture and Forestry Brno,
Brno, Czech Republic
ABSTRACT: During the construction of model logging costs for valuation of forest stands, by accident I found out differences between some species included in the groups of tree species. Differences within the groups of species may cause errors in logging costs of some species, for example with hornbeam, all species of linden, all species of rowans and horse chestnut. With the help of simple calculations it was proved that the differences could be very large, that they were more than forty per cent, it means they were significant. On the basis of my further research it is envisaged to increase the number of groups of trees from 13 to 16. The purpose is to give the most accurate background to make up a model of logging costs. In the second step it is expected that the model can provide the results for more or fewer groups of trees more easily if statistical methods are used. But this problem is not a part of this paper.
Ta
ble 1. The
cl assific ation of par tic ul ar sp ec ie sin to the gr oup sof tr ee s Mar k Re as on f or t he c re
ating of t
he g roup of tr ee s Tr ee sp ec ie s Sp ec ific ation No. I. Sp ec ific ation No. I I. SD1 For t he de duc
ting of time
consum ption f or c ut ting SM all k ind
s of gen
us Pice a and Abie s , Pseudot su ga BO all k ind
s of gen
us Pi nu s and La ri x, T axu s, J un ip er us and t he ot her c onif ers BK all k ind
s of har
d-wo ode d de ciduou s tr ee s e xc ept gen us Betu la and Sor bu s BR all k ind
s of s
of t-wo ode d de ciduou s tr ee s w ith gen us Betu la and Sor bu s SD2 For t he de ter
mining of g
row th st age for c ut ting SM 9 sit e c la ss es all k ind
s of tr
ee
s e
xc
ept two f
ollow ing line s D G 5 sit e c la ss es Pseudot su ga
and all k
ind s of Al nu s BR 3 sit e c la ss es all k ind
s of gen
us Betu la , F ra xi nu s, S or bu s and Popu lu s trem ul a and Ai la nth us a lti ss ima SD3 For c alc ul
ation of middle tr
ee ma ss of tr ee s ( by fir m Top olr po) SM all k ind
s of gen
us Pice a JD all k ind
s of gen
us Abie s BO all k ind
s of gen
us Pi nu s, T axu s, J un ip er us
and all ot
her C
OF
MD
all k
ind
s of gen
us La ri x D G Pseudot su ga BK Fa gu s s ylvatic a
, all k
ind
s of gen
us Acer , T ili a and Ae scu lu s h ip oc ast an um DB all k ind
s of gen
us Q uercu s, Ul m us , P lat an us , M al us , P yr us and Ju gl an s re gi a and n ig ra , and t he ot her H W D T JS all k ind
s of gen
us Fr axi nu s and Ai la nth us OL all k ind
s of gen
us Al nu s and C ast ane a H B C ar pi nu s b etu lu s A K Ro bi ni a p seudo ac aci a TP all k ind
s of gen
us Popu lu s and Sa lix BR all k ind
s of gen
us Betu la and Sor bu s SD4 For t he de ter
mining of middle tr
ee ma ss f or s kidding SM all k ind
s of gen
us Pice a and Abie s , Pseudot su ga BO all k ind
s of gen
us Pi nu s and La ri x, T axu s, J un ip er us and t he ot her C OF BK Fa gu s s ylvatic a, all k ind
s of gen
us A cer , F ra xi nu s, Ul m us , S or bu s, J ugl an s, R obi ni a, P ru nu s, M al us , P ir us , Che stn ut , P lat an us , A ila nth us and t he ot her H W D T H B C ar pi nu s b etu lu s BR all k ind
s of gen
us Betu la , T ili a, A ln us and Popu lu s trem ul a and t he ot her S W D T TP all k ind
s of gen
Mar
k
Re
as
on f
or t
he c
re
ating of t
he g
roup
of tr
ee
s
Tr
ee
sp
ec
ie
s
Sp
ec
ific
ation
No. I.
Sp
ec
ific
ation
No. I
I.
SD5
For t
he de
ter
minin
g of
time
consum
ption f
or s
kidding
SM
all k
ind
s of gen
us
Pice
a
and
Abie
s, P
seudot
su
ga
BO
all k
ind
s of gen
us
Pi
nu
s,
La
ri
x, T
axu
s, J
un
ip
er
us
and t
he ot
her C
OF and S
W
D
T
BK
all k
ind
s of H
W
D
T
SD6
For f
or
est v
alu
ation
SM
all k
ind
s of gen
us
Pice
a
JD
all k
ind
s of gen
us
Abie
s
BO
all k
ind
s of gen
us
Pi
nu
s, T
axu
s, J
un
ip
er
us
and all ot
her C
OF
MD
all k
ind
s of gen
us
La
ri
x
D
G
Pseudot
su
ga
BK
Fa
gu
s s
ylvatic
a, C
ar
pi
nu
s b
etu
lu
s,
all k
ind
s of gen
us
Acer
, T
ili
a, A
escu
lu
s
DB
all k
ind
s of gen
us
Q
uercu
s, Ul
m
us
, P
lat
an
us
, M
al
us
, P
yr
us
and
Ju
gl
an
s re
gi
a
and
n
ig
ra
,
and t
he ot
her
H
W
D
T
JS
all k
ind
s of gen
us
Fr
axi
nu
s
and
Ai
la
nth
us
OL
all k
ind
s of gen
us
Al
nu
s
and
C
ast
ane
a
O
S
Popu
lu
s trem
ul
a
A
K
Ro
bi
ni
a p
seudo
ac
aci
a
TP
all k
ind
s of gen
us
Popu
lu
s
(e
xc
ept
P. trem
ul
a
) and
S
al
ix
BR
all k
ind
s of gen
us
Betu
la
and
Sor
bu
s
C
OF – ot
her c
onif
ers
H
W
D
T – ot
her har
d-wo
ode
d de
ciduou
s tr
ee
s
SW
D
T – ot
her s
of
t-wo
ode
d de
ciduou
s tr
ee
s
[image:3.595.84.358.74.761.2]Ta
ble 1 t
o b
e c
on
tin
ue
species which occur in the stands of the Czech Re-public and I analysed them.
MATERIAL
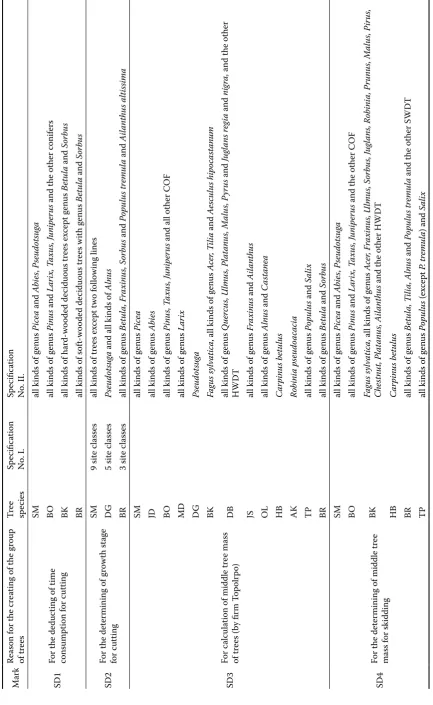
Particular tree species are classified into groups of trees according to needs:
– for the calculation of middle tree mass (the official basis for the calculation in forest management ta-bles opened to the public by Forest Management Institute in Brandýs nad Labem) 13 groups of trees are used,
– for forest valuation 13 groups of trees are distin-guished as well (Property Assessment Regulation No. 540/2002), but they do not correspond to the preceding ones,
– for the deduction of growth stage for cutting, tree species are divided into 3 types according to the number of site classes as follows: spruce (9 stages), Douglas fir (5 stages) and birch (3 stages). The growth stage is an important characteristic that substantially (about 20%) affects cutting costs even with the same tree species and average cut-ting tree mass,
– to determine the standard of time consumption for cutting, 4 type species are used (spruce, pine, beech and birch),
– to determine the rate of output for skidding, 3 type species are used (spruce, pine, and beech), – for deduction of average tree mass for skidding,
6 type species are used (spruce, pine, beech, horn-beam, birch and poplar).
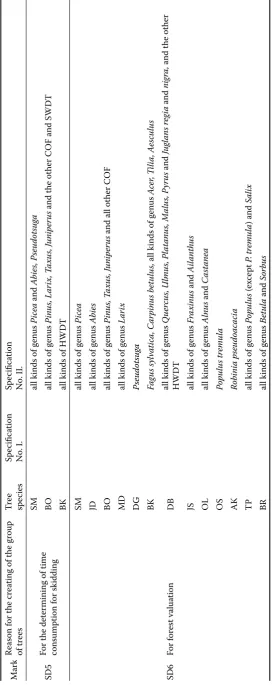
Table 1 shows a detailed description of species classification into the groups, according to particular types. In Table 2 all species that can be found (even if only theoretically) in the stands of the Czech Re-public are introduced. They are listed and sorted in alphabetic order so that their coincidence according to tree species criteria could be compared.
There are 80 species listed but it need not be the total number because smaller groups of trees with similar characteristics are also included (for example other coniferous trees, other soft-wooded broad-leaved trees or other hard-wooded broadbroad-leaved trees, all clones of poplar, etc.). Out of 80 species there are 8 tree species (i.e. 10%) that by grading in tree types show differences from the model applied so far to law-making for forest valuation.
METHODS
It is obvious from Table 2 that most species (about 90 per cent) can be graded in 6 groups of trees with-out problems. Only hornbeam, all limes, rowans and
horse chestnut differ from the groups of trees they are assigned to for valuation.
The measure of difference varies with particular species.
Hornbeam
Its group of trees for forest valuation is beech, but hornbeam differs from beech in group number 3 (for determination of middle tree mass for cutting, which is very important) and in group number 4 for derivation of middle tree mass for skidding.
Lime
All species of lime differ from beech. It is its type group of trees for forest valuation. Limes differ from beech even in three groups of trees: in group num- ber 1 (for determination of time consumption for cut-ting), in group number 5 (for determination of time consumption for skidding) because as opposed to beech lime is a soft-wooded broadleaved tree, and in group number 4 for deducting the middle tree mass for skidding because it has another type of branching. Rowan
The group of tree species for forest valuation is birch, but all rowans differ from birch in two groups: in group 4 (for deducting the middle tree mass for skidding where their grading comports with beech) and in group number 5 (for deducting the time con-sumption for skidding) where rowans are considered as soft-wooded broadleaves and correspond there-fore to the type of spruce.
Horse chestnut
It differs from beech (which is its type group of trees for forest valuation) similarly like lime, but in two types only. First, in group number 1 (determination of time consumption for cutting), second in group 5 (for deducting the time consumption for skidding) be-cause as opposed to beech, chestnut is a soft-wooded broadleaved tree both for cutting and skidding.
As the differences become evident solely in the case of grading the species in groups of trees that determine the time consumption for cutting and skidding, it is not possible to ignore their economic impact. We must try to determine the level of devia-tion from the type group of trees, in other words it is important to determine if it is necessary to take the differences into consideration.
RESULTS
Ta
ble 2. The
cl assific ation of par tic ul ar sp ec ie st o the gr oup sof tr ee s No. Sp ec ie
s in L
atin Sp ec ie s Gr
oup of trees
D T1 D T2 D T3 D T4 D T5 D T6 No. Sp ec ie
s in L
atin Sp ec ie s Gr
oup of trees
influence the calculation of final yield value (Au) and of age value factor (fa). I present a simple comparison of direct logging costs that were calculated in the same technical, field and climatic conditions.
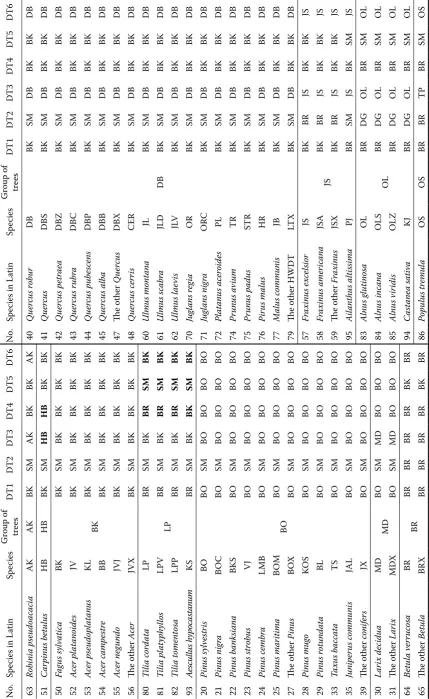
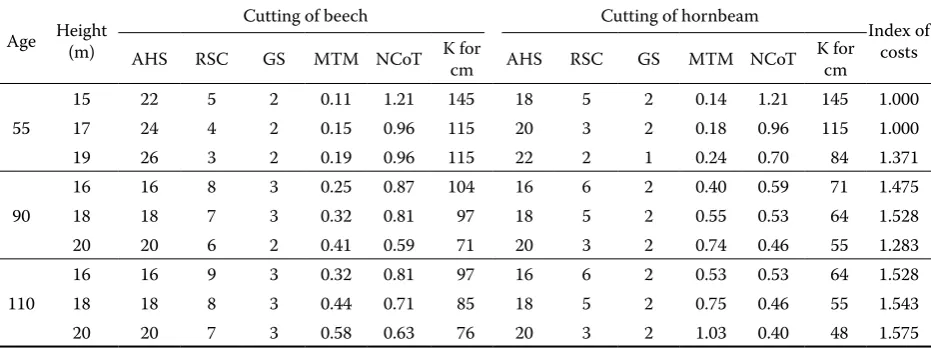
Tables 3 and 4 show direct costs of cutting and skidding (it was calculated according to HINDLS et al. 1999). Table 3 compares direct costs of cutting be-tween the species beech and hornbeam and Table 4 shows differences in direct costs of skidding between the species beech and lime. To make the comparison relevant and as objective as possible, we compared the values at equal age and tree height of these spe-cies. These two examples were chosen because both species (hornbeam and lime) are calculated equally for the determination of final yield value – from beech. Even a common assessment proves that the differences are very sharp, as we can see from the indices of values for particular species that reach tens of per cents. On the basis of these results we can say that all 16 groups of trees must be considered for the calculation of average cost value.
Causes of differences and calculation analysis
The reasons for cost value differences are not uni-fied. Different values of costs between beech and hornbeam are mainly caused because:
a) both of these two species have main growth dynamics at different age. The same values of the tree height in relation to the same age result from the fact that in beech the value reflects the bad growth caused by low site class, low genetic quality or specimen vitality as opposed to high value site class in hornbeam;
b) differences in logging costs between equally char-acterized specimens of both species will rise with age;
c) the fact that both species are hard-wooded broadleaves and have 9 site classes affects the differences in logging costs least of all;
d) the supposed differences in skidding costs are caused by richer branching of hornbeam, which means that from one tree more pieces arise which must be put together for skidding.
The reasons for different skidding cost values be-tween beech and lime are caused:
a) equally chosen values of tree height and age were compared. The groups of trees were not selected, they resulted from comparison according to groups of trees. In order to provide for maximum objectivity I chose the same technology of skid-ding, the same starting costs of one-hour-opera-tion (240 CZK) and the same skidding distance (500 m);
66
Sor
bu
s a
ucu
pa
ri
a
JR
JR
BR
BR
BR
BK
BO
BR
1
Pice
a a
bie
s
SM
SM
SM
SM
SM
SM
SM
SM
67
Sor
bu
s tor
m
ina
lis
BR
K
BR
BR
BR
BK
BO
BR
2
Pice
a pu
ngen
s
SMP
SM
SM
SM
SM
SM
SM
68
Sor
bu
s a
ri
a
MK
BR
BR
BR
BK
BO
BR
3
Pice
a ma
ri
ana
SMC
SM
SM
SM
SM
SM
SM
18
Pseudot
su
ga t
axifol
ia
D
G
D
G
SM
D
G
D
G
SM
SM
D
G
4
Pice
a s
pi
nu
lo
sa
SM
S
SM
SM
SM
SM
SM
SM
10
Abie
s a
lb
a
JD
JD
SM
SM
JD
SM
SM
JD
5
Pice
a omor
ic
a
SMO
SM
SM
SM
SM
SM
SM
11
Abie
s g
ra
nd
is
JD
O
SM
SM
JD
SM
SM
JD
6
Pice
a en
gel
ma
ni
i
SME
SM
SM
SM
SM
SM
SM
12
Abie
s concolor
JDJ
SM
SM
JD
SM
SM
JD
9
The
ot
her
Pice
a
SMX
SM
SM
SM
SM
SM
SM
13
Abie
s k
orei
ana
JDK
SM
SM
JD
SM
SM
JD
87
Popu
lu
s b
al
sa
m
ifer
a
TP
TP
BR
SM
TP
TP
SM
TP
14
Abie
s V
eitc
hi
i
JDV
SM
SM
JD
SM
SM
JD
88
Popu
lu
s n
ig
ra
TP
C
BR
SM
TP
TP
SM
TP
16
The
ot
her
Abie
s
JD
X
SM
SM
JD
SM
SM
JD
89
The
ot
her
Popu
lu
s
TPX
BR
SM
TP
TP
SM
TP
90
Cultiv
at
ed
Popu
lu
s
TP
S
BR
SM
TP
TP
SM
TP
91
Sa
lix c
apre
a
JIV
BR
SM
TP
TP
SM
TP
92
Sa
lix a
lb
a
V
R
BR
SM
TP
TP
SM
TP
97
The
ot
her
SW
D
T
LMX
BR
SM
TP
BR
SM
TP
[image:6.595.77.282.58.760.2]Ta
ble 2 t
o b
e c
on
tin
ue
b) as the most serious cause of different logging costs appears the fact that norm consumption of time in lime is deduced from conifers while beech ranks among hard-wooded broadleaves. It means that specific time consumption for hard-wooded broadleaves is by 30 or 40 per cent higher (it was calculates according to CHAJDIAK et al. 1989) and corresponds to the final skidding costs ratio between beech and lime;
c) the less important reason for logging cost dif-ferences is different growth dynamics of lime compared with beech. It becomes evident in low middle tree mass of the cut tree with the same age and height of tree.
Consequences of differences
The described situation cannot be considered as a disaster but the fact that more than two per cent of all species are permanently assessed incorrectly is not desirable. The differences have relatively massive deviations as described in Tables 3 and 4. They reach values about 40 per cent and more. The impact of the differences is quite small from the national point of view, but the impacts on individual forest owners can be very perceptible in regions with broadleaved trees. As the cost valuation of forest property con-cerns mainly private owners, it is necessary to use
this information for the calculation of Auand fa, which are the main factors to express the compulsory forest value.
CONCLUSION
The differences found out by analysis justify the opinion that the number of groups of trees should be enlarged from 13 to 17, or at least to 16. The extended number would include respective types hornbeam, lime, rowan and horse chestnut. The reason to omit the horse chestnut (considering 16 groups of trees) is the fact that from the economic point of view it is unimportant, its existence in forest crops is only on a theoretical level, and there is no need to create a new type for it. It can be assigned to the group of soft-wooded broadleaved trees which are represented by lime.
[image:7.595.65.531.75.249.2]It is not popular to increase the number of groups of trees even under the circumstances when the negative impacts can be eliminated by use of com-puters. In my opinion it is, however, the right step allowing more accurate calculations. The objective could be to unify the cost charges in the smallest number of groups of trees but on the basis of more accurate calculations by means of good statistical methods. I assume that the described method is not only possible but also attainable. It cannot, however, Table 3. Comparison of logging costs
Age Height (m)
Cutting of beech Cutting of hornbeam
Index of costs AHS RSC GS MTM NCoT K for cm AHS RSC GS MTM NCoT K for cm
55
15 22 5 2 0.11 1.21 145 18 5 2 0.14 1.21 145 1.000
17 24 4 2 0.15 0.96 115 20 3 2 0.18 0.96 115 1.000
19 26 3 2 0.19 0.96 115 22 2 1 0.24 0.70 84 1.371
90
16 16 8 3 0.25 0.87 104 16 6 2 0.40 0.59 71 1.475
18 18 7 3 0.32 0.81 97 18 5 2 0.55 0.53 64 1.528
20 20 6 2 0.41 0.59 71 20 3 2 0.74 0.46 55 1.283
110
16 16 9 3 0.32 0.81 97 16 6 2 0.53 0.53 64 1.528
18 18 8 3 0.44 0.71 85 18 5 2 0.75 0.46 55 1.543
20 20 7 3 0.58 0.63 76 20 3 2 1.03 0.40 48 1.575
AHS – absolute height site class
RSC – relative site class (according to Schwappach and others) GS – growth stage
MTM – middle tree mass
NcoT – norm consumption of time per one calculation unit for the cutting K for cm – costs in Czech crowns per one cubic meter
Conditions of the calculation of costs
1. Both species are cut by chain saw with costs of 120 crowns per one hour 2. For both cases simple consumption of time excluding surcharge was used 3. Both species are of the same age and height of cut tree
be described here because the solution to this prob-lem would make the work too extensive.
This paper signifies the trend and step sequence leading to the objective, in my opinion, positively. On the basis of stated facts I decided to work on the construction of model costs in future. It will partly enable to find out to what extent the used logging costs corresponding to particular values Au
and fa conform to their growth dynamics and it will partly enable to make easier cost calculation for the determination of damage to forest crops (or crop destruction, thefts, etc.).
Acknowledgement
I am very grateful to Mgr. LIBUŠE RUDINSKÁ for helping me to translate the text into English.
References
HINDLS J. et al., 1999. Analýza dat v manažerském rozho-dování. Grada Publishing: 346.
ČERNÝ M., PAŘEZ J., MALÍK Z., 1994. Růstové tabulky hlavních dřevin České republiky. Ústav pro výzkum lesních ekosystémů – IFER, s. r. o., Davle nad Vltavou:24. CHAJDIAK J., KVETKO J., PARDELOVÁ R., REPÁŠ V.,
ŠLAUKOVÁ I., 1989. Ekonomická statistika. Bratislava, Alfa VTEL: 330.
[image:8.595.66.534.72.235.2]Received for publication September 9, 2004 Accepted after corrections November 11, 2004 Table 4. Comparison of skidding costs
Age Height (m) Skidding of beech Skidding of lime Index of costs MTM1 MTM2 NCoT K for cm MTM1 MTM2 NCoT K for cm
55
15 0.14 0.08 0.74 178 0.11 0.08 0.55 132 1.345
17 0.18 0.09 0.74 178 0.15 0.08 0.55 132 1.345
19 0.24 0.13 0.74 178 0.19 0.10 0.51 122 1.451
90
16 0.40 0.20 0.56 134 0.25 0.15 0.39 94 1.436
18 0.55 0.28 0.56 134 0.32 0.18 0.39 94 1.436
20 0.74 0.33 0.42 101 0.41 0.20 0.29 70 1.448
110
16 0.53 0.24 0.42 101 0.32 0.18 0.39 94 1.077
18 0.75 0.33 0.42 101 0.44 0.23 0.29 70 1.448
20 1.03 0.33 0.42 101 0.58 0.28 0.29 70 1.448
MTM1 – middle tree mass for cutting MTM2 – middle tree mass for skidding
NcoT – norm consumption of time per one calculation unit for skidding K for cm – costs in Czech crowns per one cubic meter
Conditions of the calculation of costs
1. Both species are skidded by universal tractor with costs of 240 crowns per one hour 2. For both cases simple consumption of time excluding surcharge was used
3. Wood is skidded from the locality “stump” to the place for subsequent transport directly, skidding distance is 500 m 4. Both species are of the same age and height of cut tree
5. Costs are calculated on the direct cost level
Příspěvek k tvorbě skupin dřevin pro účely oceňování lesa
M. MICHALČÍK
Lesnická a dřevařská fakulta, Mendelova zemědělská a lesnická univerzita v Brně, Brno, Česká republika
Z dostupných informací vyplývá, že pro kalkulaci těžebních nákladů při konstrukci dat použitých jako podklady v oceňování lesních porostů hodnoty Au
(hodnota mýtní výtěže ve věku obmýtí) a fa (věko-vý hodnoto(věko-vý faktor ve věku a) bylo nutné využít lineární interpolace, protože podrobnější podklady pravděpodobně nebyly k dispozici. Analýzou jsem zjistil, že využitím shodných veličin, jaké se použí-vají pro ocenění lesních porostů, lze vytvořit mode-lové náklady přesnější pro všech 13 dosud používa-ných skupin dřevin.
Při přípravných pracích jsem však náhodně obje-vil, že některé dřeviny (HB, LP, JR a KS) se od běž-ného zařazení dřevin do skupin podle jejich charak-teristik výrazně liší. Kalkulací jsem zjistil, že rozdíly dosahují hodnot až kolem 50 %. Rozdíly zjištěné analýzou opravňují k názoru, že by bylo účelné roz-šířit počet skupin dřevin pro účely oceňování lesa ze 13 na 16, tedy o samostatné typy: habr, lípa, jeřáb. Kaštan koňský (KS) je na rozdíl od ostatních uvede-ných dřevin z hospodářského hlediska bezvýznam-ný a jeho přítomnost v lesních porostech je spíš jen teoretická. To nevytváří potřebu tvořit pro něj sa-mostatnou skupinu.
následně rozdíly v nákladech na těžbu a soustřeďování dříví u habru, všech lip, jeřábů a kaštanu koňského. Za pomoci jednoduchých kalkulací bylo prokázáno, že odchylky nákladových sazeb mohou dosahovat až několika desítek procent. Na základě podrobného rozboru je navrženo rozšíření dosavadního počtu skupin dřevin ze 13 na 16, jejichž cílem je po-skytnout co nejpřesnější podklady pro tvorbu kalkulací nákladů pro modelování Au a fa. V dalším kroku se pak očekává, že nákladový model může být za použití statistických metod významně zjednodušen (alespoň pro výkon soustřeďování dříví) na několik málo skupin dřevin. Řešení zjednodušení modelu však není obsahem práce.
Klíčová slova: habr; lípa; jeřáb; kaštan koňský; těžební náklady; skupiny dřevin
Jsem si vědom, že zvyšování počtu skupin dřevin není právě aktuální, avšak pro dobu akutní potřeby je prozíravé mít k dispozici nový model, protože umožňuje přesnější výpočty. Cílovým stavem by potom mohl být postup ke sjednocení nákladových sazeb do co nejnižšího počtu skupin dřevin, ale na základě přesnějších podkladových propočtů s vy-užitím celé škály statistických metod. Mám za to (a moje další práce na této problematice o tom svědčí), že takový postup je nejen reálný, ale i do-sažitelný, avšak nemůže být obsahem této práce. Zato však zde naznačuje směr a sled postupných kroků k cílovému stavu. Na základě zjištěných sku-tečností je možné v budoucnu pokračovat na tvor-bě takových modelových nákladů, které umožní jednak prověřit, nakolik se dosud použité těžební náklady (odpovídající jednotlivým hodnotám Au a fa) shodují s objektivní růstovou dynamikou dře-vin, jednak umožní usnadnit (případně i metodic-ky sjednotit) výpočet nákladů pro účely stanovení výše škod na lesních porostech (ekonomicky odů-vodněné úplné vlastní náklady na těžbu a soustře-ďování dříví).
Corresponding author:
Ing. MILOSLAV MICHALČÍK, Mendelova zemědělská a lesnická univerzita v Brně, Lesnická a dřevařská fakulta, Lesnická 37, 613 00 Brno, Česká republika