Risk elements accumulation in vegetable, par-ticularly in areas irrigated with wastewater, may by a threat to human health. Soil contamination by risk elements due to non-decay by time and long biological half-lives has been severely consid-ered. Main sources of risk elements in agricultural soils are usually various, such as irrigation with wastewater; application of agricultural fertilizers, pesticides and organic manures; disposal of urban or industrial wastes; mining and smelting process; atmospheric pollution resulting from motor ve-hicles and combustion of fossil fuels (Nicholson et al. 2003). Due to long-term irrigation with do-mestic sewage and industrial effluent containing heavy metals, contamination in agricultural soils has become significantly higher than the back-ground value (Rodriguez et al. 2008). Because of the low precipitation and high evaporation rates in a semi-arid climate, the use of urban and industrial
wastewater in agricultural fields is unavoidable. Deterioration of environmental conditions and increasing reliance on agrochemicals have led to a growing public concern over the potential accu-mulation of heavy metals and other contaminants in agricultural soils (Nicholson et al. 2003).
High concentration of heavy metals in agricul-tural soils affect the crops output and quality. It deteriorates growth, morphology and metabolism of microorganisms in soils (Giller et al. 1998). In recent years, with the rapid industrialization and urbanization, heavy metal contamination has be-come an important issue in many countries (Chen et al. 2008). Iran and other countries located in the arid belt of the Earth face severe water scarcity.
In order to partially meet the demand for water of their large urban populations, the governments in these countries are compelled to re-use a sig-nificant volume of urban and industrial wastewater
Spatial distribution and mapping of risk elements pollution
in agricultural soils of southern Tehran, Iran
A. Hani
1, E. Pazira
2, M. Manshouri
3, S. Babaie Kafaky
1, M. Ghahroudi Tali
41
Department of Agriculture and Natural Resources, Science and Research Branch,
Islamic Azad University, Tehran, Iran
2
Faculty of Agriculture and Natural Resources, Science and Research Branch, Islamic
Azad University, Tehran, Iran
3
Department of Water Sciences and Engineering, Science and Research Branch, Islamic
Azad University, Tehran, Iran
4
Geography Department, Tarbiat Moalem University, Tehran, Iran
ABSTRACT
In order to evaluate risk elements and their spatial distribution in agricultural fields south of Tehran, statistics, geostatistics and geographic information system (GIS) were used. The content of Hg, As, Pb, Mo, and Be were de-termined in 106 samples. The results showed that primary inputs of As and Hg were due to anthropogenic sources, while Pb, Mo and Be were associated with pedogenic and anthropogenic factors. Ordinary kriging was carried out to map the spatial patterns of risk elements and disjunctive kriging was used to quantify the probability of risk ele-ments concentrations higher than their guide value. The results show that As, Hg, Mo and Be exhibit pollution risk in the study area. The high pollution sources evaluated were related with usage of urban and industrial wastewater for agricultural practice. The results of this study are helpful for risk assessment of environmental pollution for de-cision making for vegetable production and ecosystem improving.
Keywords: geostatistics; multivariate statistical analysis; risk elements; agricultural soil; Tehran
(contaminated by heavy metals) in agriculture (Yargholi 2008). The metropolis of Tehran produces about 6 m3/s of wastewater, which is used for the irrigation of crops and vegetables in more than one thousand square kilometers of agricultural fields located in the plains of southern Tehran. Sewage wastes from different areas of Tehran have been transferred to southern areas of the city along two rivers for 70 years. In this situation, several vegetable species which are the main part of the daily diet of Tehran’s population have been pro-duced using domestic and industries wastewater since many years. Thus, due to rapid develop-ment of urbanization and industrialization, soil pollution with risk elements in southern Tehran has become an urgent problem. Long-term use of wastewater resulted in the accumulation of risk elements in soil and their transfer to various crops under cultivation, with levels of contamination that exceed permissible limits. There is no legislation regarding metal concentrations in agricultural and urban soils in Iran. A few studies were done on the metal levels in agricultural soils that received wastewater (Salmasi and Tavassoli 2006). Heavy metals pollution in soil is commonly estimated by interpolating concentrations of heavy metals sampled at point locations, so that each heavy metal is represented in a separate map (Webster and Oliver 2001). The methods of geostatistics use
the stochastic theory of spatial correlation both for interpolation and for apportioning uncertainty (Goovaerts 1997). Moreover, geostatistics has been successfully applied in investigating and mapping soil pollution by heavy metals, in recent years (Romic and Romic 2003).
Geostatistics provides a set of statistical tools for incorporating spatial coordinates of observations in data processing (Goovaerts 1999). Recent stud-ies attempted to apply both multivariate analyses and GIS techniques in agricultural soil studies (Facchinelli et al. 2001). There are few detailed studies that were undertaken to determine the risk element contents in agricultural soils in Iran, thus the aim of the present study is to determine; (1) Metal distribution through geostatistical analysis to identify their spatial patterns in the region, (2) Identification of the natural or anthropic sources of individual metals in the soils using geostatisti-cal and multivariate statistigeostatisti-cal analyses and (3) Mapping the environment quality and risk assess-ment in agricultural soils in south of Tehran.
MATERIAL AND METHODS
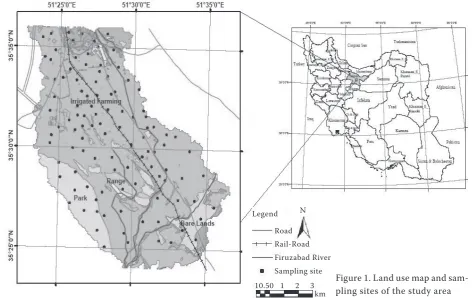
[image:2.595.62.535.464.762.2]Study area. The study area is located in a vegetable planting region (35°33'39'' ~35°24'15''N, 51°35'29'' ~ 51°25'03''E) situated in southern Tehran with an
Figure 1. Land use map and sam-pling sites of the study area Legend N
Road Rail-Road Firuzabad River Sampling site 10.50 1 2 3
area of 800 km2 (Figure 1). This zone is character-ized by mild-cold winters and semi-arid continental climate with an average annual rainfall of 232 mm (for the period 1993–2003, in Mehrabad Station), with a minimum and a maximum average annual temperature of –4 and 42°C. The agricultural lands in south of Tehran are well known for vegetable production. The main soil types in the study area are Typic Calciorthids and Natric Camborthids. Most the agricultural lands were irrigated with wastewater and sewage from Tehran city. The large population (about 10 million) and dense industrial activity in Tehran discharged a great amount of wastewater into the urban environment.
Sampling and chemical analysis. A total of 106 surface soil samples (0–25 cm in depth) were taken corresponding to agricultural lands basis of a land use map at 1:100.000 scale in July 2008. Heavy metals from anthropogenic sources are mainly accumulated at surface and most of the roots of vegetable crops are located down at this depth (Ross 1994). Sampling sites were selected randomly. A composite soil sample consisted of 5-subsamples obtained using stainless steel hand auger at regu-lar distances from each other. Subsamples were mixed into one composite sample for each soil and were analyzed in triplicate. The coordinations of the sample locations were recorded with a global positioning system (GPS) receiver. About 1 kg of each sample was stored in a polyethylene pack-age and transported to the laboratory. The soil samples were air-dried for several days at room temperature (20–22°C), ground and sieved to 2 mm for analysis of their properties. Soil samples were digested by aqua regia with a mixture of nitric and hydrochloric acids according to the 3050B method of the United States Environmental Protection Agency (USEPA 1996). As and Hg were determined with an AFS dual-channel atomic fluorescence. The concentrations of Pb, Mo, and Be were determined using inductively coupled plasma atomic emission spectroscopy (ICP-ES; 138 Ultrace; Jobin Yvon). Standard reference material (GBW-07401) of soils was applied for quality as-surance and control (QA/QC). The quality control performed included a daily analysis of standard and replicate analysis of samples and blanks. The satisfactory recoveries rate for Hg, As, Pb, Mo, and Be were 92.7–106.4%, 94.2–103.6%, 87.9–112.1%, 85.6–104.2% and 89.5–107.4%, respectively.
Geostatistics. Geostatistics uses the technique of variogram to measure the spatial variability of the recognized variable and provides the input parameters for the spatial interpolation of kriging
(Webster and Oliver 2001). Kriging has been widely used as an important interpolation method at dif-ferent scales, especially in soil pollution (Chen et al. 2008). The semivariogram γ (h), measures the mean variability between two points x and x + h, as a function of their distance h, for data location at discrete sampling locations. The semivariogram is an autocorrelation statistic defined as follows (Isaaks and Srivastava 1989):
N(h)
g(h) = 1 Σ [Z(xi) – Z(xi + h)]2 2N(h) i=1
Where: Z (xi) is the value of the variable Z at point i, Z (xi+ h) is the value of the variable Z at point i + h, and N(h) is the number of sample couples points separated by the lag distance h.
The experimental variogram measures the average degree of dissimilarity between non-sampled values and nearby data value and thus can depict autocor-relation at various distances. The variogram model is chosen from a set of mathematical functions that describe spatial relationship and is usually fitted by weighted least squares and range, nugget and sill are then used in the kriging procedure. In this study, to make distribution maps, several spatial interpolation techniques were evaluated for the best results, such as Kriging, Global/Local Polynomial Interpolation (G/LPI), Inverse Distance Weighting (IDW) and Radial Basis Functions (RBF). We used kriging (Ordinary kriging) as a spatial interpolation technique to make distribution maps because it is very flexible and allows users to investigate graphs of spatial autocorrelation and allow prediction, pre-diction standard error, and probability maps and at the same time minimize the error of predicted values. The statistics of the differences between the measured and predicted values at sampled points is often used as an indicator of the performance of an inexact method (Burrough and McDonnell 1998).
positive estimates counteract each other and re-sultant ME tends to be lower than actual error (Nalder and Wein 1998). RMSE provides a measure of the error size, but it is sensitive to outliers as it places a lot of weight on large errors (Hernandez-Stefanoni and Ponce-Hernandez 2006).
MSE suffers the same drawbacks as RMSE. Whereas MAE is less sensitive to extreme values (Vicente-Serrano et al. 2003) and indicates the extent to which the estimate can be in error (Nalder and Wein 1998). The difference between the known data and the predicted data is calculated using mean error and it should be a value near zero. The RMSE quantifies the error of the predicted surface. The variability of the prediction is evaluated by comparing the ASE and RMSE. If the ASE is greater than the RMSE the variability of prediction is overestimated. Because the ME is a function of the scale of the data, the ME is standardized to the MSE by dividing the predic-tion error by their predicpredic-tion standard error. The MSE should be a value near zero. In ordinary krig-ing, the probability maps depend on the kriging standard errors. If ASE is close to the root-mean squared prediction error, assessment of variability in prediction error has been done correctly. If the average standard error is greater or less than root-mean-squared prediction error, prediction has been made over and underestimating, respectively.
The disjunctive kriging technique is applied for as-sessment of pollution risk to evaluate the probability that the true value of soil risk element at non-sampled points exceeds the specified thresholds. It provides an estimate of the conditional probability that a random variable located at a point, or averaged over a block in two-dimensional space, exceeds certain thresholds. It is assumed that the concentration of a radionuclide is a realization of a random variable Z(x), where x denotes the spatial coordinates in two dimensions. If a threshold concentration zc is defined, marking the limit of what is acceptable, then the scale is dissected into two classes, which are less than and more than zc.. The soil must belong to either class at any place. The values 0 and 1, respectively, can be assigned to two classes, thereby creating a new binary variable, or indicator, which is denoted by Q [Z(x) ≥ zc] (Lark and Ferguson 2004).
Multivariate statistics and data transforma-tion. The test of normality of the data set was performed with the Kolmogorove-Smirnov (K-S) test, skewness and kurtosis parameter. It is nec-essary to normalize the data transformation for environmental variables as they have a lognormal pattern (Krige 1960). The principal component analysis (PCA) was employed for identification of
risk element sources. The PCA converts the vari-ables under investigation into factors or principal components and correlation among the original variables can be minimized and measured ele-ments into fewer groups. In addition, Varimax and Kaiser Normalization rotation was applied to maximize the variance of the factor loading across variances for each factor.
Multivariate statistical analyses and descriptive statistical parameters of the data were performed by SPSS (V.13) software packages (SPSS Inc., Chicago, USA) for Windows. Geostatistical analysis, semivar-iogram model fitting and spatial distribution using ordinary kriging were performed with GIS software ArcGIS V.9.2 (ESRI Co, Redlands, USA)
RESULTS AND DISCUSSION
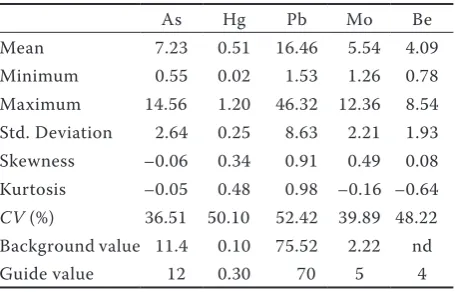
[image:4.595.305.533.598.744.2]Descriptive statistics and normality test. The basic descriptive statistics for raw data of risk elements is summarized in Table 1. Raw data sets show positive skewness except As. It is seem that the skewness and kurtosis for these risk elements are low and they had not passed the Kolmogorov-Smirnov normality test (K-S p). Since further statis-tics and geostatisstatis-tics analysis needs data to follow a normal distribution, the significance levels of the Kolmogorov-Smirnov normality test (K-S p) for the row data are shown in Table1. The mean concentrations of Hg, Mo and Be in analyzed samples were higher than background level values, while the mean concentrations of As and Pb were lover than their background levels provided by the Ministry of Industries and Mines Geological Survey of Iran (Alavi Naeini et al. 2005). A large coefficient of variation (CV%) of Hg and Pb in
Table 1. Summary statistics for heavy metals concentra-tions (mg/kg) in top soil
As Hg Pb Mo Be
Mean 7.23 0.51 16.46 5.54 4.09
Minimum 0.55 0.02 1.53 1.26 0.78
Maximum 14.56 1.20 46.32 12.36 8.54
Std. Deviation 2.64 0.25 8.63 2.21 1.93
Skewness –0.06 0.34 0.91 0.49 0.08
Kurtosis –0.05 0.48 0.98 –0.16 –0.64
CV (%) 36.51 50.10 52.42 39.89 48.22
Background value 11.4 0.10 75.52 2.22 nd
Guide value 12 0.30 70 5 4
soils, which reached 50.10 and 52.42, respectively, implied a great heterogeneity in soils and suggest that extrinsic factors such as human activities may be a primary source of these metals. High con-centrations (i.e. above background levels) coupled with a high coefficient of variation suggest anthro-pogenic inputs for metal elements (Manta et al. 2002). However, some researchers (Facchinelli et al. 2001) suggest that wastewater is the main source of these elements in agricultural soils, especially in densely populated areas with an inefficient cleaning process. The lowest CV% of As, Mo and Be exhibit a weak variation, and their content was almost constant in local and their values may be probably caused by lithogenic process.
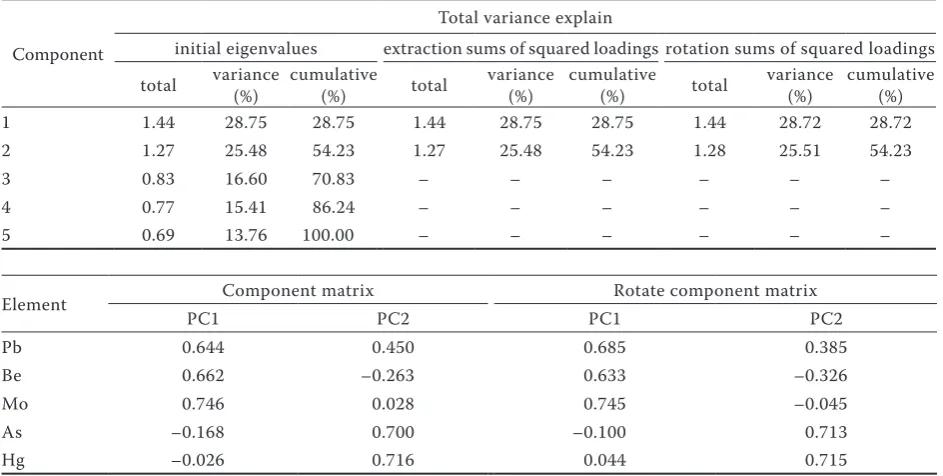
[image:5.595.63.535.79.317.2]Multivariate analysis. In order to better describe the relationship among risk elements, principal component analysis was performed. The results of PCA for risk element concentration in soil are illustrated in Table 2. The rotation of the matrix contributes to clarify ambiguities in component matrix. Based on eigenvalue (eigenvalue > 1), two main PCs explained 54.23% of the total variance (Table 2). The first PC (PC1) explains 28.72% of total variance and consists of Pb, Mo and Be. The initial component matrix (PC1) indicates that Pb, Mo and Be are associated, displaying high value in the first component.
This may indicate that the contamination of Pb, Mo and Be may originate from the same sources, such as the lithogenic process. The second PC (PC2)
explains 25.51% of the total variance and consists of As and Hg. These metals can be defined as an anthropogenic component due to the presence of high levels in some soils. Relatively lower loading factors of these metals in the first component imply that other sources, such as wastewater and industrial contamination, may control the concentrations of As and Hg. The high As and Hg levels may be related to wastewater, vehicle and industrial fumes.
Geostatistical analysis. The experiment semi-variogram depicts the variance of the sample values at various separation distances. The ratio of nug-get to sill (nugnug-get/sill) can be used to express the extent of spatial autocorrelations of environmental factors. If the ratio is low (< 25%), the variable has strong spatial autocorrelations at a regional scale. A high ratio of nugget effect (> 75%) plays an important role in spatial heterogeneity of soil properties .To some extent, the spatial variabil-ity of risk elements may be affected by intrinsic factors (pedogenic factors such as soil parent material) and extrinsic factors (anthropogenic factors such as agricultural practices). In general, strong spatial dependence of soil properties can be affected by intrinsic factors and weak spatial dependence can be affected by extrinsic factors (Cambardella 1994).
The ratio of nugget to sill of As and Hg was more than 0.75 showing week spatial dependence due to the effects of extrinsic factors such as industrial production, soil practice management and use of Table 2. Total variance explained and component matrixes for elements
Component
Total variance explain
initial eigenvalues extraction sums of squared loadings rotation sums of squared loadings total variance (%) cumulative (%) total variance (%) cumulative (%) total variance (%) cumulative (%)
1 1.44 28.75 28.75 1.44 28.75 28.75 1.44 28.72 28.72
2 1.27 25.48 54.23 1.27 25.48 54.23 1.28 25.51 54.23
3 0.83 16.60 70.83 – – – – – –
4 0.77 15.41 86.24 – – – – – –
5 0.69 13.76 100.00 – – – – – –
Element Component matrix Rotate component matrix
PC1 PC2 PC1 PC2
Pb 0.644 0.450 0.685 0.385
Be 0.662 –0.263 0.633 –0.326
Mo 0.746 0.028 0.745 –0.045
As –0.168 0.700 –0.100 0.713
Hg –0.026 0.716 0.044 0.715
wastewater. The ratio of Pb, Mo and Be was between 0.25 and 0.75; they have moderate spatial dependence, indicating that intrinsic and extrinsic factors such as industrial production, agricultural practice, parent material and topography changed their spatial cor-relations. The attribute of the semivariogram model and best-fit model parameters that are used as input
to kriging interpolation are summarized in Table 3. The results show that soil As, Hg, Pb, Mo and Be were fitted with Circular, Stable, J-Bessel, Hole effect and Tetra-spherical models, respectively.
[image:6.595.64.534.79.175.2]Trend analysis was applied to diagnose aniso-tropic parameters of risk elements and their char-acteristic trends, which is helpful for removing a Table 3. Semivariograms models and parameters of heavy metals
Metal Semivariogram model Nugget (C0) Sill (C0 + C) C0/(C0 + C) Range RMSE Anisotropy Angle
As Circular 7.447 8.406 0.886 19041 0.989 82.6
Hg Stable 0.041 0.052 0.796 18633 0.952 298.8
Pb J-Bessel 41.097 73.478 0.557 3541 0.952 23.7
Mo Hole Effcect 3.541 5.023 0.705 5347 0.999 296.2
Be Tetra spherical 1.393 4.349 0.679 4945 0.997 3.6
As Be
Hg Mo
[image:6.595.75.438.298.766.2]Pb
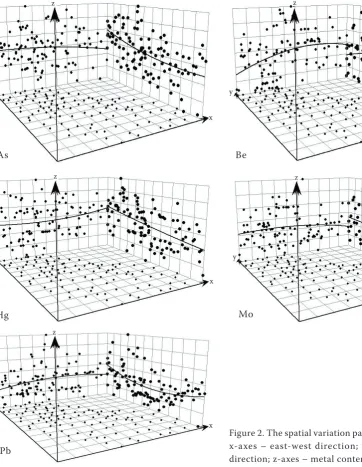
Figure 2. The spatial variation patterns of risk elements. x-axes – east-west direction; y-axes – south north direction; z-axes – metal content
y y
z
x
z
x
y
z
x
y
y
z
z
x
trend from the dataset before using kriging. The results of trend analysis are illustrated if Figure 2. The elements of Hg and Mo demonstrate straight line pattern in both east-west and south-north directions. While As and Pb show an inverted U-shape curve in south-north direction and As, Pb, Mo and Be show second order pattern in east-west direction.
Spatial distribution and risk assessment. The distribution maps of risk elements including As, Hg, Pb, Mo and Be concentrations are illustrated in Figure 3. They show that the spatial variation of risk element concentrations generate from their semivariograms.
[image:7.595.65.534.176.765.2]The distribution of As and Hg had a clear boundary in the west of the area. Their spatial distribution maps
Figure 3. Filled contour maps of soil As, Hg, Pb, Mo and Be in agricultural soils
Soil As (mg/kg) Filled Contuors
Soil Hg (mg/kg) Filled Contuors
Soil Mo (mg/kg) Filled Contuors Soil Pb (mg/kg)
Filled Contuors
show similar geographical trends; since there were around the Firuzabad River, the usage of wastewater from the river obviously affects the soil risk element concentrations. In the distribution map of Be, it is a wide area from northeast to southeast. However, the arable lands were widely irrigated with urban and industrial wastewater, which had a large effect on As, Hg and Pb soil concentration.
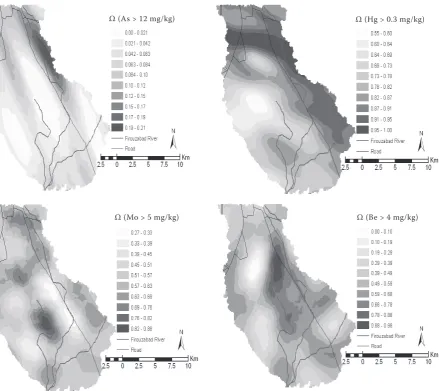
The estimate probability of exceeding the thresh-old was kriged by disjunctive kriging (Figure 4). The results show that the As, Hg, Mo and Be exhibited the pollution risk. For soil Hg, the north-east to south-west of study area had high pollution risk, where the estimate probability (Ω [Hg ≥ 0.3mg/kg]) reached 0.82–1.00; the high probability of exceed-ing threshold values of Hg in the north to south are highly correlated with vegetable area. For soil As, the map shows that the areas with high risk are mainly located in the north-west study area, where estimate probability (Ω [As ≥ 12mg/kg]) reached 0.12–0.21.
However, there were 85 and 27 samples in which Hg and As contents exceeded the guide values, respectively. They suggest the pollution fact of farmlands in southern Tehran; the application of pesticides and industrial and urban wastewater in this area might be important cases of the Hg and As pollution risk and the areas with estimate probability cannot be regarded as safe for veg-etable growth.
The probability map of Mo and Be exhibits many hotspots. The highest risk areas (Ω [Mo ≥ 5 mg/kg]) and (Ω [Be ≥ 4 mg/kg]) are distributed in southern Tehran, due to the wastewater applications with high concentration of risk elements (Table 1) and agricultural practices.
[image:8.595.90.530.59.450.2]The risk element concentrations in the topsoil of south of Tehran agricultural lands had an increas-ing trend due to wastewater irrigation and usincreas-ing of fertilizers and pesticides in the past decade. Based on multivariate statistical analysis and Geostatistical analysis, the concentrations of As and Hg were likely Figure 4. Estimated probability maps of As, Hg, Mo and Be
Ω (As > 12 mg/kg) Ω (Hg > 0.3 mg/kg)
affected by anthropogenic factors and had high risks for environmental pollution and human health. In fact, a point source of contamination for these risk elements was not perceived in the study area, while the concentration of Pb, Mo and Be were re-lated to the pedogenic and anthropogenic factors (e.g. the discharge of wastewater). The study results demonstrated that the spatial variability of five risk elements in farmland was apparent in the southern Tehran. This result presented here could be used for planning, risk assessment and decision-making in environmental management.
Acknowledgement
The authors wish to thank the Islamic Azad University, Science and Technology branch labo-ratories complex for financial support (Grant No. 13/3/640). The authors would like to thank all the editors and reviewers for their comments in development and improvement of this paper.
REFERENCES
Alavi Naeini M.R., Mozafari A., Najjaran M. (2005): Geochemical and Heavy Mineral Exploration in Tehran. Scale: 1:100000. Ministry of Industries and Mines Geological Survey of Iran.
Burrough P.A., McDonnell R.A. (1998): Principles of Geographical Information Systems. Oxford University Press, Oxford, 333. Cambardella C.A., Moorman T.B., Novak J.M., Parkin T.B., Turco
R.F., Konopka A.E. (1994): Field-scale variability of soil properties in central Iowa soils. Soil Science Society of American Journal,
58: 1501–1511.
Chen T., Liu X.M., Zhu M.Z., Zhao K.L., Wu J.J., Xu J.M., Huang P.M. (2008): Identification of trace element sources and associated risk assessment in vegetable soils of the urban-rural transitional area of Hangzhou, China. Environmental Pollution, 151: 67–78. Facchinelli A., Sacchi E., Mallen L. (2001): Multivariate statistical
and GIS-based approach to identify heavy metal sources in soils. Environmental Pollution, 114: 313–324.
Giller K.E., Witter E., McGrath S.P. (1998): Toxicity of heavy metals to micro-organisms and microbial processes in agricultural soils. Soil Biology and Biochemistry, 30: 1389–1414.
Goovaerts P. (1999): Geostatistics in soil science: state–of–the–art and perspectives. Geoderma, 89: 1–45.
Goovaerts P. (1997): Geostatistics for natural resources evalu-ation. Applied Geostatistics Series. Oxford University Press, New York.
Hernandez-Stefanoni J.L., Ponce-Hernandez R. (2006): Mapping the spatial variability of plant diversity in a tropical forest: comparison of spatial interpolation methods. Environmental Monitor Assess-ment, 117: 307–334.
Isaaks E.H., Srivastava R.M. (1989): An Introduction to Applied Geostatistics. Oxford University Press, New York.
Krige D.G. (1960): On the departure of ore value distributions from lognormal models in South African gold mines. Journal of Chemical, Metallurgical and Mining Society of South Africa,
61: 231–244.
Lark R.M., Ferguson R.B. (2004): Mapping risk of soil nutrient defi-ciency or excess by disjunctive and indicator kriging. Geoderma,
118: 39–53.
Manta D.S., Angelone M., Bellanca A., Neri R., Sprovieri M. (2002): Heavy metals in urban soils: a case study from the city of Palermo (Sicily), Italy. Science of the Total Environment, 300: 229–243. Nalder I.A., Wein R.W. (1998): Spatial interpolation of climatic
Normals: test of a new method in the Canadian boreal forest. Agricultural and Forest Meteorology, 92: 211–225.
Nicholson F.A., Smith S.R., Alloway B.J., Carlton-Smith C., Chambers B.J. (2003): An inventory of heavy metals inputs to agricultural soils in England and Wales. Science of the Total Environment,
311: 205–219.
Robinson T.P., Metternicht G. (2006): Testing the performance of spatial interpolation techniques for mapping soil properties. Computer and Electronic in Agriculture, 50: 97–108.
Rodriguez J.A., Nanos N., Grau J.M., Gil L., Lopez-Arias M. (2008): Multiscale analysis of heavy metal contents in Spanish agricultural topsoils. Chemosphere, 70: 1085–1096.
Romic M., Romic D. (2003): Heavy metals distribution in agricultural topsoils in urban area. Environmental Pollution, 43:795–805. Ross S.M. (1994): Toxic Metals in Soil-Plant Systems. JohnWiley
and Sons Inc, Chichester.
Salmasi R., Tavassoli A. (2006): Pollution of south of Tehran ground waters with heavy metals. International Journal Environmental Science and Technology, 3: 147–152.
USEPA (1996): United States Environmental Protection Agency, Method 3050B: Acid Digestion of Sediments, Sludges, Soils, and Oils. SW-846., Washington D.C.
Vicente-Serrano S.M., Saz-Sánchez M.A., Cuadrat J.M. (2003): Comparative analysis of interpolation methods in the middle Ebro Valley (Spain): application to annual precipitation and temperature. Climate Research, 24: 161–180.
Webster R., Oliver M. (2001): Geostatistics for Environmental Sci-entists. In: Statistics in Practice. Wiley, Chichester.
Yargholi B., Azimi A.A., Baghvand A., Liaghat A.M., Fardi G.A. (2008): Investigation of cadmium absorption and accumulation in different parts of some vegetables. American-Eurasian Journal of Agriculture and Environment Science, 3: 357–364.
Received on January 18, 2010
Corresponding author: