The effects of 3D visualizations and Desire for Control in changing consumer´s behavioral intentions
Swetlana Schwarz University of Twente
Supervisor Sjoerd de Vries
Peter de Vries
2011
Swetlana Schwarz Stadtskamp 2B 48629 Metelen
Abstract
The aim of this research is to clarify whether the newly developed technology of 3D virtual house visualization can contribute to consumer understanding, attitude formation and decision confidence to invest in the house based on the visualization. In order to do so, the concept of virtual experiences is introduced and the definition of what exactly virtual experiences are is discussed. Furthermore, a research model is proposed in this study. It states that virtual house experiences (VHE) affect consumer’s behavioral intentions through the joint effects of vividness and interactivity. It is assumed that these characteristics directly affect consumer’s knowledge and attitude formation, while these two variables influence consumer’s decision confidence. Therefore, the question of consumer´s knowledge, attitude and decision confidence is analyzed in the present research and in addition, consumer’s individual level of desirability of control is assumed to have a significant impact on their resulting behavior.
The experiment was investigated with the help of an online questionnaire, by comparing participants’ reactions to two different types of house visualizations: a static 2D house image
and an interactive 3D visualization of a house or property. Three-hundred-eight subjects
Outline
Chapter 1 Introduction... 4
1. Research Question... 4
Chapter 2 Literature Review ... 6
2.1. Learning from experiences: The need for product experiences. ... 6
2.1.1. From real to virtual Product Experiences (VPE) and their effect on behavior. ... 8
2.1.2. Interface Features and Types of virtual experiences (VE) ... 9
2.2. The characteristics of three dimensional visualizations. ... 13
2.2.1. Media Richness (Vividness). ... 13
2.2.2. Effects of vividness on consumer’s behavior ... 13
2.2.3. Interactivity.. ... 14
2.2.4. Effects of interactivity on consumer’s behavior. ... 15
2.3. Analyzing the virtual house simulations of the company Viality ... 16
2.4. Desirability of Control.. ... 17
2.4.1. Individual’s desirability for control ... 18
2.5. Hypotheses ... 19
2.5. Research model ... 20
Chapter 3 Methods ... 21
3.1. Pilot-study. ... 21
3.1.2. Participants.. ... 21
3.1.3. Stimulus ... 22
3.1.4. Results ... 22
3.2. Main research ... 23
3.2.1. Experimental group ... 23
3.2.2. Participants ... 23
3.3. Material ... 24
3.3.1. Procedure ... 25
3.3.2. Questionnaire Design. ... 26
3.3.3. Independent variables ... 26
3.3.4. Dependent Variables ... 27
Chapter 4 Data Analyses and Results...28
4.1.1. Reliability Analysis ... 28
4.1.2. Manipulation Check ... 29
4.2. Hypothesis testing ... 29
4.2.1. Mediator. ... 30
4.2.2. Moderator ... 31
4.2.3. Decision confidence ... 32
4.2.6. Additional testing ... 32
Chapter 5 Conclusion... 33
Chapter 6 Discussion and Implications... 34
Chapter 7 Limitations and further research...36
Chapter 8 References...37
List of Figures 2.1. The direct to indirect experiences spectrum ... 7
2. Research Model ... 20
3.1. Stimulus material used on the exhibition ... 22
3.3. stimulus material used in the main experiment ... 25
4.2. Mediator ... 34
List of Tables 2.1. Interface Features in 3D product simulations ... 10
2.2. Three Categories of virtual product experiences ... 11
4.1. Cronbach´s Alpha ... 28
4.2. Mean number of decision confidence ... 30
4.2.1.Regression Analysis between variables ... 30
5. Summery of Hypothesis in the research ... 34
1. Introduction
Three dimensional visualization has become more and more common with the improvement of the virtual environment. The search of technologies that provide consumers with vivid experiences can be found in several genres: 3D Product visualization, 3D movies and computer-games. Virtual visualization is still a new area that needs more clarification to be understood, primarily in its effects on consumer behavior. Certainly, there are research investigations about the effect of virtual experiences that are generated by 3D visualizations on consumers, from different perspectives in academic literature. For example, researcher found that consumers paid close attention and became emotionally engaged in product evaluation when they were faced with virtual experiences. Others reported to gather more product knowledge by interacting with virtual products (Li, Daugherty and Biocca, 2002; 2003). Based on prior research, there is evidence that 3D visualizations have an effect on consumer’s behavior. But if there is evidence, how does it affect consumer´s behavior and which features characterize then 3D objects? These are two of the central questions in the present research.
Even though there is academic literature about 3D visualization and virtual experiences, no attempts have been made to apply virtual experiences in the architectural field, at least not by 3D visualization, like the current research does. The company “Viality” is using an innovative way of 3D visualization in their virtual house simulations that not only serves as stimulus material in this present paper, but also even more asks for comparable research in this field. The goal of the present research is to make the first attempt to understand in how far 3D virtual house simulations can provide potential buyers with the essential information to gather knowledge, establish a positive attitude and feel confident in decisions to invest in the house.
Because of the highly interactive visualization, a second scope will be introduced in this research, namely consumer’s high and low desirability to control. Several theorists and researchers have discussed the importance of a general motivation to control one's environment and thereby to satisfy a need to feel masterful and competent. Therefore one logical elaboration of this line of thinking is the identification of relatively stable individual differences in the motivation to control the events in one's life. Based on the research perspective, on event might be the interaction with 3D visualizations, whereby those positive or negative outcomes are depending on the individuals traits to have a high or low desire to control.
Research Questions
The following research question arises from the before mentioned research scope:
What is the effect of virtual house simulations on consumers´ knowledge, attitude and decision confidence? And to what extent does consumer´s level of desirability for control influence this effect?
In order to answer this problem statement, the following sub questions can be derived:
• What are virtual house simulations? How are they conceptualized?
• What are virtual experiences? And how does it affect consumer´s behavior?
• What are the consumer’s knowledge, attitude and decision confidence in virtual house
simulations? How can they be defined?
• In which way does the degree of controllability influence consumer behavior in users
2. Literature review
Before we start to understand what virtual house simulations are, we first need to understand how consumers learn from evaluations of experiences. The following chapter starts with a literature review and discussion of direct and indirect product experiences. Then it reviews the existing literature on 3D virtual product experiences to give an understanding how it can simulate direct product experiences. The various basic technical methods that are suitable for generating virtual experiences are summarized, afterwards. Followed by, the classification of three VPE types, and corresponding product arrangements. Afterwards, the chapter includes two fundamental aspects of virtual experiences and 3D visualizations, Media Richness and Interactivity - and the relationship between them. In addition to it, the academic literature on desirability of control is reviewed and introduced as scope of interested for this research. The chapter ends with hypotheses that are proposed for the present research.
2.1 Learning from experiences: The need for product experiences
Learning from experiences is in this study a central concept, because it is likely to influence
behavior by being driven of internal attributions and motivation (Smith and Swinyard, 1982).
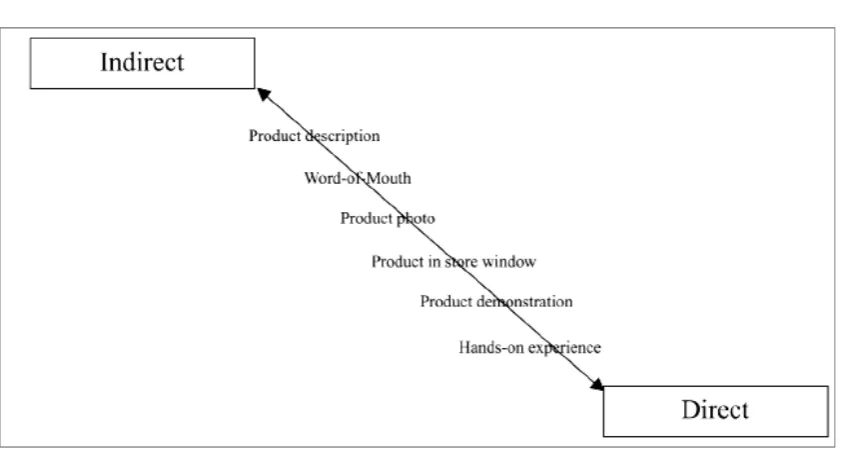
Researchers have documented that consumers learn about products through two main forms of experiences, namely direct and indirect experiences (Daugherty, Li and Biocca, 2008). Indirect product experiences are conveyed often through types of media like advertising or brochures. They provide potential customers with information to inspire them and make them aware of the product features. Customers learn from that information and are able to generate product knowledge. Unfortunately, indirect information sources that can also be word of mouth may be lost or details may be distorted. High levels of information fidelity are therefore provided by direct product experiences. Direct product experiences involve a customer´s direct feeling, touching, and trial of a product. Direct product experiences are unmediated and offer consumers to interact with the product in its full sensory capacity (Daugherty et al, 2008). To clarify the difference between both experiences Mooy and Robben (2002) conceptualized the consumer’s product experiences as a spectrum from indirect to direct experiences (see Fig.2.1). Whereby, consumer interaction increases as well as the use of relevant senses in information processing while moving from indirect to direct product experiences on this spectrum.
Figure 2.1: The direct to indirect experiences spectrum Source: Mooy and Robben (2002)
Along the spectrum, product descriptions are the most indirect experiences consumers can have with a product. Such indirect experiences can be obtained by consumers from traditional print advertisings, because there is no interaction at all. Product photos for example are further down on the spectrum and communicate to the consumers by reflecting the ideas of the agency or the supplier. On the lowest level of direct experiences, consumers can directly try the product and have physical access. Mooy’s and Robben’s (2002) concept illustrates that the lower the spectrum, the more direct interaction consumers have with the product. Based on the spectrum- model, interaction as the number of sensory aspects available is the most important distinction between indirect and direct experiences. Sensory cues including sight, feel, smell, sound and taste. Combined together, these cues form an informative, vivid and impressive presentation of products.
Marks and Kamins (1988) support this model, by illustrating stronger attitudes in consumers’ confidence who were exposed to product trials than in consumers exposed to advertising. In addition consumer’s attitudes among subjects, who try products directly, compared to subjects who are exposed to the products through advertising, demonstrate greater predicative power of attitudes formed through direct experiences.
In summary, past studies have yielded substantial evidence that direct product experiences are effective in conveying relevant product information, and therefore they lead to stronger beliefs, confidence and attitudes than indirect product experiences, as for example advertising.
2.1.1 From real to virtual Product Experiences (VPE) and its effect on behavior.
Direct product experiences are absent in the online environment. The computer interface mediates the relationship between consumers and products and therefore provides consumers with indirect product experiences. For example, if a product is presented in a static image or photo the richness of information about its full appearance might be reduced online as compared to a product that can be touched. Hence the haptic sense is lost and consumers are inhibited in judging the product quality that might influence their attitudes and their information processing. A way to overcome this problem is to develop an opportunity to make the interface invisible. By using an invisible interface information could be perceived with fidelity and little meandering (Norman, 1998). Therefore, virtual technology is suggested to make interfaces invisible and provide the opportunity to emulate direct experiences. This new type of consumer experience is called virtual product experience (Li et al. 2001), that is discussed in the next part.
The innovation of the virtual product experiences is suggesting to make the mediated interfaces invisible. Three dimensional (3D) visualizations allow consumers to virtually feel, touch, and try online products by manipulating product presentations, trying products functions, and customizing products in online environments. In other words, users are able to rotate objects, move them, zoom-in and out as well as change their attributes, colors and textures by using their mouse and keyboard (Oh, Yoon, & Hawley, 2004). In doing this consumers are able to access product information that is similar to direct product experiences with the benefit that virtual product experiences (VPE) are more flexible. Because virtual technology allows consumers for example to virtually change the color of the product like to
virtually engrave names on a wedding ring; features that may not be feasible in a physical shopping-environment.
Several prior researches have focused on examining whether virtual experiences have benefits in product demonstrations in the same manner as direct product experiences. For example, Li et al. (2001) have found that participants who examined products, tended to feel a high level of presence, enjoyed product inspection and were curious and enthusiastic to search product information when interacting with virtual 3D products. Unfortunately, the researchers have used verbal protocol analyses to trace the participant’s virtual experiences that make the study quite explorative. Hence, Li and his colleagues studied the differences between 3D and 2D product experiences, later (Li, Daugherty & Biocca, 2002, 2003). An online advertising was used to simulate the 2D product experience. In addition the researchers divided the products in three categories; material products that can be fully assessed through physical contact like the bedding material, geometric products that can be fully recognized through vision like a wristwatch and mechanical products that must be demonstrated through product behavior like a laptop. The results yield that consumers have significant higher product knowledge and show more attention and engagement in evaluating products when interacting with 3D products online.
In summary, prior studies have examined the effect of virtual experiences from various perspectives, comprising the communication of product knowledge, product evaluation and attitude formation. Researchers have found that consumers were more enthusiastic, fell more pleasure and establish higher overall – attitude when interacting with virtual products. In addition to it, the studies acknowledge that virtual product experiences can simulate direct product experiences.
2.1.2 Interface Features and Types of virtual experiences (VE)
offer consumer this opportunity, behavioral interactions between the consumer and a product need to be simulated to create virtual experiences.
A common overview of the simulated interface features are shown in Table 2.1. The table is adopted and adjusted from Li et al. (2001) and includes only the interface features that are beneficial for the present research study.
Table 2.1 : Interface Features in 3D product simulations
Interface Description
Zooming Allows the product to be moved in 3D by decreasing and increasing the size of the product. For instance, a wristwatch can be zoomed in to appear larger than its actual size for visual inspection of its details.
Rotation Control via the mouse allows the user to rotate the product or environment to view from any angle. For instance, a laptop computer can be viewed from the front, back, or the side.
Shifting Refers to the virtual movement of products by using the mouse to replace the shelf in a virtual environment, for example.
Contextualization The placement of a product in the context to simulate how the product can be consumed. For instance, a sofa can be placed into an elegant room.
Touch and Manipulation
Allows the user to feel haptic forces and product properties such as the texture of a product, its smoothness or softness with the mouse.
Animation Products sensory features are tied to their behaviors. For instance, car door open or hinges when pulled, or pressing buttons to see the functions of a PDA.
Customization The ability to allow the consumer to modify the form or content of the product. For instance, using a computer mouse, a consumer may change the colors of a sofa to see how well it matches to the room.
Spatial Navigation Users move through environments. Products are demonstrated in a commercial space such as a virtual mall to allow people to window shop by strolling through 3D or other simulation of physical shopping behavior.
The simulations of behavior intentions, as zooming products, rotating and shifting them allow consumers to interact in the virtual environment as they were interacting in real life. With regard to the interface features, following categorizations must be summarized to give a precisely understanding of the features that characterize products, in the context of virtual product experiences. The categories are:
• Objects that have a three-dimensional appearance
• Objects that form an environment that can be `entered´ and viewed from the `inside´.
• Objects that can be customized and evaluated in relation to other products.
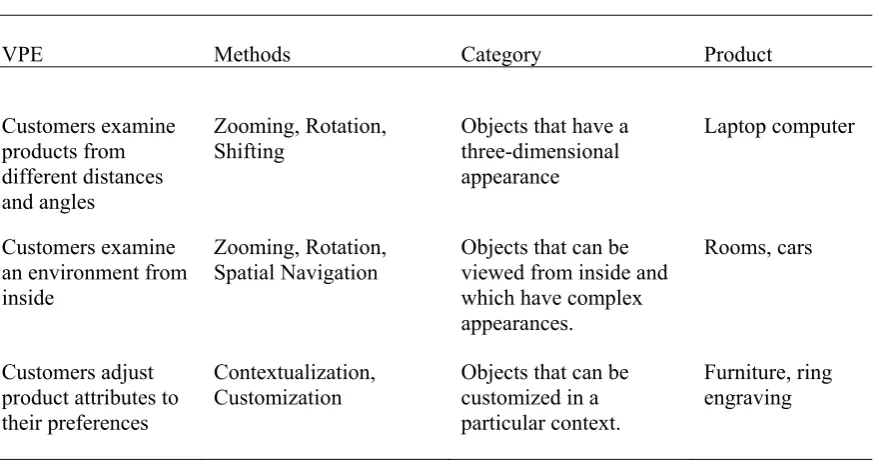
[image:12.595.70.510.375.608.2]The three categories of virtual product experiences are presented in Table 2.2. The interface features form Table 1 and product types are also included here. It must be noticed that there are also more types of virtual product experiences, as for example functional ones that are currently not relevant for this study.
Table 2.2: Three Categories of virtual product experiences
VPE Methods Category Product
Customers examine products from different distances and angles Zooming, Rotation, Shifting
Objects that have a three-dimensional appearance
Laptop computer
Customers examine an environment from inside
Zooming, Rotation, Spatial Navigation
Objects that can be viewed from inside and which have complex appearances.
Rooms, cars
Customers adjust product attributes to their preferences
Contextualization, Customization
Objects that can be customized in a particular context.
Furniture, ring engraving
Research has found that the inspections in 3D can provide customers with detailed product appearance – information that can engage customers, who are interacting with the interfaces (Li et al., 2003). The second type allows consumers to feel that they are situated within a particular virtual environment. They can navigate within the environment and examine its interior settings. On the website www.pro-bankpersonal.de for example, consumers can walk through the bank office and take a look inside the rooms. Also the inspection of car interiors is possible with the creation of 3D environments (www.honda.com). Through the inspection of the interior, it is assumed that consumers collect product information and in addition generate an interesting shopping experience, while navigating through the environment. The difference between the first and the second virtual experience is that in the first case the rotations happened against a static background, while in the second option the objects form an environment by themselves, where customers feel that they are inside this environment. The third type allows customers to adjust attributes or product context to their preferences. For example, on www.sony.com, customers are able to change the colors of the laptop and are assisted in selecting their preferred colors. Another example is the website www.landsend.com. Here customers can not only customize products but also customize the context where products are to be sampled. The opportunity is named ‘my virtual model’ and allows customers to create a virtual 3D model according to the user’s own specifications, and to try different products to evaluate how they would look like when worn. Obviously, the virtual experiences have increased the conversion rates from browsing to sales (Oh et al. 2008). Maybe it enhanced the confidence in the decision making. Another example that belongs to this product type is the website www.furniturelandsouth.com, one of the largest furniture retailers in North Carolina. 2008 Web Trends tracking data revealed that more than 100,000 unique visitors per day browsed the website and spent an average of more than 13 minutes per visit (Oh et al., 2008). Besides an assortment of furniture the company is also offering a virtual room planner where users can customize and adjust rooms by clicking and shifting elements. The examples show that obviously trials of customizable features provide customers useful opportunities to understand product and context matches. Furthermore, users are engaged by offering them to adjust the appearances of products according to their preferences.
To summarize, interface features are important characteristics of virtual experiences, because they can simulate behavior intentions and contribute to the simulation of an invisible interfaces. There are three important types of virtual product experiences that can be categorized and that are available on present e-commerce websites: Objects that have a
dimensional appearance, objects that form an environment that can be `entered´ and viewed from the `inside´ and objects that can be customized and evaluated in relation to other products. The three groups are important for the understanding of the virtual house simulation concept of the company Viality.
2.2 The characteristics of three dimensional visualizations
Zooming and rotating a virtual product or moving through a virtual environment means actually interacting with the 3D objects in a computer-mediated environment. The possibility to interact with the 3D elements offers the benefit of media richness and objects interactivity. These two important characteristics of 3D - technology need to be explained in more detail.
2.2.1 Media Richness (Vividness)
The first critical media characteristic here is media richness. Media richness also is referred to as vividness (Steuer, 1992). It means the intensity with which a mediated environment is able to present information to the senses. To understand this concept more clearly, two important factors contribute to media richness; first, sensory breadth that describes the number of different sensory channels that a medium applies, as for example a television commercial has more sensory channels – visual and auditory channels – than a single channel media communication like radio. The second factor is depth. It refers to the quality of the information transmitted to the sense (Steuer, 1992). An example of information quality is a picture with many pixels and therefore high resolution quality as compared to a picture with few pixels.
2.2.2 Effects of vividness on consumer’s behavior
findings illustrate that the animated products were producing nearly the same market share rankings compared to direct product experiences. Therefore Dahan and Srinivasan (2000) argue that the interactive and vivid nature of 3D product visualization stimulates mental imagery in consumers in a virtual experience engaging them in the environment or with an object.
According to the findings (Nisbett & Ross, 1980; Dahan & Srinivasan, 2000) vivid information seems to be more likely to engage consumer in cognitive elaboration, because it is interesting and stimulating. The Elaboration Likelihood Model (ELM) indicates that subjects are more likely to initiate a behavior response when the experience is personally relevant. Consumers tend to perceive 3D products as being realistic enough to evaluate the potential benefits and utilities for others (Li et al., 2001) as in addition, 3D visual products tend to stimulate the consumer’s cognitive processing and may therefore result in more favorable and positive attitudes. Lim, Benbasat and Ward (2000) examined the positive impact of media richness in a different way. Instead of analyzing 3D product visualizations, the authors compared the effect of vivid multimedia presentations to simple text-based presentations in changing people’s biases toward their first impression of other people. Their findings had the result that multimedia presentations of humans reduce the influence of first impression bias by the participants. A possible explanation for this effect is that rich media convey more concrete information and are therefore reducing the misinterpretation.
To summarize the literature, media richness is stimulus driven and depends on the technical characteristic of a medium. It conveys information more correctly; it attracts people’s attention and interest and can trigger their cognitive elaboration. Through media richness people are likely to learn and judge more efficiently and establish their attitudes toward the objects.
2.2.3 Interactivity
To understand the topic of interactivity, Steuer´s (1992, p. 84) definition of interactivity is adopted here: “The extent to which users can participate in modifying the form and content of a mediated environment in real time.” The challenge for users to modify the environment is the degree to which they have user control. The degree of control that users maintain in interactions via their computers, can be explained as users’ active roles to dominate the process and contents of their interactions. For example, the users view and respond to the
system by zooming and rotating the object, while the systems simultaneously view and respond to the users by showing the objects features.
The multidimensional construct of interactivity consists of three components, namely speed, which refers to the time needed to manipulate the web content (e.g. the object); range, which refers to the different ways in which content can be manipulated; and mapping, which refers to the similarities between the manipulation in the 3D environment and the manipulation in the real world. A possible example of real-world mapping is a steering wheel, which when turned to the right, turns the car to the right – similar to the movements of a car in the real world (Coyle & Thorson, 2001; Steuer, 1992). In the context of virtual product experiences it is important to point out that unlike video product demonstrations that provide customers with profitable information; virtual products are not rendered unless they receive a stimulus from online customers. Therefore it holds true for 3D product demonstrations that customers actively control the delivery of the product information.
2.2.4 Effects of interactivity on consumer’s behavior
In 2003 the authors conducted a second experiment by researching online customers’ product knowledge, attitudes and purchase decisions with regard to 3D virtual experiences as compared to TV commercials. The purpose of this experiment was to examine whether object interactivity is critical for influencing consumer behavior – in comparison to watching TV commercials where users are not in control – and if it suffices to trigger the imagination of product use. While the authors suggested that the results between the two conditions will not differ in various types of products (material products, touch and feel products), the results reveal the opposite. Participants reported more positive brand attitude and higher purchase intention with 3D experiences than with TV commercials for all kinds of products. No differences were found regarding product knowledge (Li, Daugherty & Biocca; 2003).
Teo, Oh, Liu and Wei (2003) randomly assigned participants to one of three website conditions with a different interactivity level. Each session had the same content and design but differed in the types of interactivity tools available, like feedback forms, search engines or online guestbook. The results confirm that a higher interactivity of websites has a strong positive effect on user satisfaction. Even more it appears to positively influence the effectiveness of information delivery on a website that in turn increases user perceptions of the website’s value and contributes to more favorable attitudes towards the website.
In sum, prior research has suggested that a high level of interactivity in online systems increases user knowledge and understanding of the system by allowing consumers to explore product information by themselves. Furthermore it enhances user confidence in usage behavior and influence user attitude with regard to the use of the system and its credibility. Virtual house simulations can be characterized as high in vividness, because of sensory channels and a high information quality. Furthermore they provide users with a high level of interactivity.
2.3 Analyzing the virtual house simulations of the company Viality
According to table 1”Interface Features”, the house visualization of Viality is characterized by functions that are suitable for a high vividness and interactivity. In the case of the virtual house simulations that served as treatment group, users can rotate, zoom and shift the house as a whole, virtually. They can for example press the option-buttons and take a look under the virtual roof, on the ground plan of the house or switch to different rooms and floors via the button system. This virtual inspection of an object in three dimensions demonstrates the first
category option (customers examine products from different distances and angles) of table 2. Going on to perceive the features of the house-model, users can also “move –into” the house. By scrolling their computer-mouse, participants can enter the virtual rooms and navigate through them. They can take a look into the living room from one perspective and change into another. Users can even start from the ground plan and navigate into the different rooms by zooming in. This opportunity represents the second category option of table 2 (customers examine an environment from inside).
Furthermore, also the last, third category option is presented in the virtual house of Viality (customers adjust product attributes to their preferences). With the button “Furniture switch show/hide” presented on the top of the visualization, customers can customize, whether they like to see the rooms with furniture or not. Via the button system, the furniture in all rooms can be switched on to see the rooms in a “realistic” setting. That has the advantage to provide consumers with a good impression about the room’s dimensions. On the other hand, if consumers choose to switch off the setting-button, the furniture will disappear and present consumers information about the dimensions of the rooms in square-meters.
Consumers could take a virtual look of the house (front, back, left, right, top – sides) and into 3 floor plans (first floor, ground floor, basement) as well as into 6 rooms (master bedroom, bedroom 1, bedroom 2, working room, bathroom, living room, kitchen and guest room) and the terrace.
2.4 Desirability of Control
Three dimensional visualizations have a high character of vividness and interactivity and seem to positively influence users on several dimensions. As already explained above, the interactivity of 3D objects enhances user competence and self-efficacy in gathering information as well as gives users a sense of control. Exactly this controllability is stated to affect positive consumer attitudes (Kettanurak et al., 2001) as it leads to greater product knowledge (Li et al., 2002). The key concept of interactivity, namely user control, may therefore play an important role in the evaluation of 3D objects by consumers.
by jumping from one location in the network to another. The non-linear structure of such action can directly influence the controller´s (user) experiences (Liu & Schrum, 2002). Ariely (2000) investigated that a high controllability results in a greater control of information that in turn leads to a better memory and learning. To anchor his findings he quotes Kleinmuntz and Schkade (1993, 1994), who state that “information control allows consumers to deal with information systems that better fit their individual informational needs and are more flexible”. The positive effect of control can also be explained by the positive effect of interactivity, as already mentioned by Kettanurak et al. (2001) that a high level of interactivity provides users with the independence to examine the objects they want and in the pace at which they want to proceed.
Liu and Schrum (2002) also propose that an active control is positively related to user satisfaction, because it gives users the power to control their online experiences actively. In contrary, the linearity of a medium, as for example television, does not effectively change the user’s viewing experiences, because individuals watch television without taking any important action (Liu and Schrum; 2002). The lack of control might therefore produce stress and lower perceived competency. However, to study high and low controllability also means to take a look on the user’s personal desire for control. The positive influence of a high level of control may vary among individuals with different personality traits and users not always prefer a high or low controllable interface.
2.4.1 Individual’s desirability for control
Desirability for control is the desire to control the events in one´s life (Burger & Cooper, 1979, p. 382). The desire to control events is not identical in all subjects. Burger and Cooper (1979) explain that there are individuals who have a high desire or low desire to control. Persons with a high desire for control generally seek to influence others. They prefer to avoid unpleasant situations or failures by manipulating events to ensure the desired outcomes. A person with a low desire for control is less likely to attempt to influence others and may prefer that many of their daily decisions are made by others (Burger and Cooper, 1979, p. 283). To study the construct of desirability for control, Burger and Cooper (1979) developed a twenty-item questionnaire that has been proved to have a high internal consistency and reliability. There questionnaire includes items as “I enjoy making my own decisions” and “There are
many situations in which I would prefer only one choice rather than having to make a decision” and is further used in this research.
Individuals differ in their desire to control, because users have different personality traits and it may therefore be possible that individuals with a high desire for control might feel more comfortable when interacting with high controllable objects on the internet. On the other hand individuals with a lower desire of control may prefer visualizations that provide less controllability and would feel more comfortable in situation where they do not have to interact with 3D objects. In addition to it, it is assumed that the level of desire for control effect consumers behavior on attitude, object knowledge and decision confidence. People who have a higher desire for control may have more pleasured to interact with 3D products, as be more satisfied.
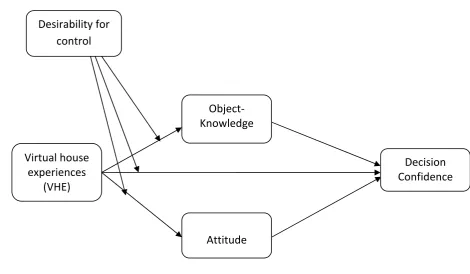
2.5 Hypotheses
After evaluating the theoretical framework presented, the following hypotheses are proposed:
H1: 3D Virtual house experiences (VHE) will, as opposed to 2D, increase consumer confidence in the investment decision.
Consumers gain information through self-efficacy. In the virtual house environment consumers interact and examine the features that are delivered by the technology and therefore gather product information and are able to generate product knowledge. As a result therefore, consumers with high product knowledge will be less uncertain and increase their decision confidence when purchasing a product.
H2: 3D VHE will, as opposed to 2D, increase object-knowledge which, in turn will increase consumer confidence in the investment decision. Object-knowledge mediates the relationship between VHE and consumer confidence in the investment decision.
to examine the virtual objects and gives them the sense of control. This interaction of response and feedback can adjust and improve user understanding of the system that in turn positively affects user confidence.
H3: 3D VHE will, as opposed to 2D, positively affect consumer attitude, which in turn will increase consumer confidence in the investment decision. An Attitude in favor of visualization mediates the relationship between VHE and consumer confidence in the investment decision.
Based on the literature review of desirability of control, following Hypothesis can be proposed:
H4: Consumers with higher desirability for control are more positively affected by 3D house visualizations, while consumers with lower desirability for control are more positively affected by static 2D visualizations. The consumer’s desirability for control will moderate the relationship between VHE and object-knowledge, attitude and decision confidence.
Desirability for
control
20
Decision
Confidence
Attitude
Virtual house
experiences
(VHE)
Object‐
[image:21.595.71.542.424.698.2]Knowledge
3 Method
This chapter discusses the research methodology for this study. The first section illustrates a pre-research that was done to test the appropriateness of the 3D visualization and to analyze possible behavior effect of 3D visualizations. In the second part the experimental main research and the stimulus material as procedure is explained. This chapter ends with the resulting part.
3.1 Pilot-study
In order to test the proposed hypotheses on virtual house simulations a pre-experiment was chosen with a less complex 3D visualization to test the predictions. The main goal of this study was to verify the usability of the 3D condition. Because it had been intended to distribute the research mainly online, it was important to know if users were able to interact with the experimental material. It was assumed that because of the novelty of these visualization forms, users may have handling problems and also problems in understanding the usability functions. Therefore an experiment was conducted on the exhibition “Boot” in Düsseldorf, Germany. Randomly assigned visitors accessed a product-file via a touch monitor. Two files were available. One represents a high level in control 3D object for virtual experiences, while the other control-file was a simple static picture in 2D. In the interactive-file, visitors could zoom in and out, rotate, change colors and test functions of the product, while there were no such options in the 2D- file. Afterwards the visitors were given a questionnaire in order to test the consumer’s product knowledge, attitude toward the product and PDF-file, as well as their purchase intention. The foreground of this testing was the usability and understanding how to use the visualization file for testing purposes.
3.1.2 Participants
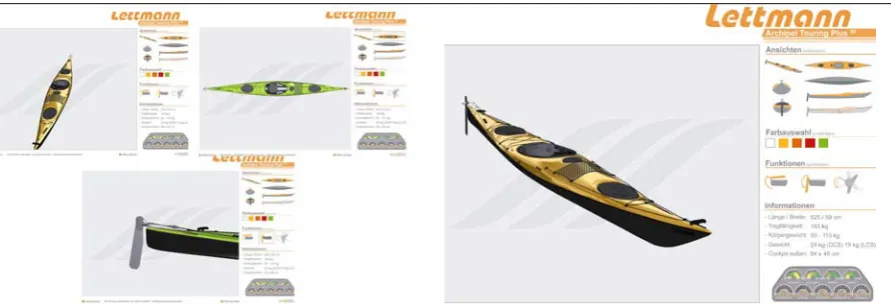
3.1.3 Stimulus
For the stimulus material a 3D visualization of a canoe was chosen. Because it was expected that visitors of the exhibition were interested in boats and therefore more enthusiastic and interested in experiencing a virtual 3D canoe. The company Viality created a PDF-file with the opportunity to interact and customize the object. Figure 3.1 shows the stimulus material of both conditions. The questions were designed to measure the usability character of this file in a simple way. Questions as “the file is easy to use and the functions how to use the file are clearly understood (translated from German)” were asked in both conditions. Furthermore, items like re-using such a file next time and the desire to use a file with similar features for other products were asked in order to measure whether consumers really understood the features and recommended the use of such a file. In addition some attitude and knowledge items were designed to complement the purpose of the survey.
Condition 1: 3D visualization of the canoe meant that visitors could interact with the object, perceive it from different angles and change colors and test its features.
[image:23.595.81.527.359.511.2]Condition 2: Visitors were presented a static image of the canoe. The toolbar on the right explains all important features.
Figure 3.1: stimulus material used on the exhibition
3.1.4 Results
Twenty four subjects participated in the 2D condition, while 34 participants interacted in the 3D condition. To measure if the interactive 3D condition provides a clear understanding of its usability, an independent t-test was used to compare the means of both condition groups. The outcomes of the test show that the conditions do not significantly differ in their means based on the understanding of the file, the usability, recommending use and re-use. To analyze
participant’s decision confidence, attitude formation and knowledge, a one-way ANOVA tests were run. The results illustrate a significant outcomes for the dependent variable attitude (F
(1, 57) = 33.53, p < .001) and give evidence that participants in the 3D condition (M =19.65,
SD = 3.32) rate the stimulus material as being more attractive than did subject in the 2D
condition (M = 13.71, SD = 4.49). There were no significant results found for object
knowledge and decision confidence.
3.2 Main research
The Main research is conducted based on the pilot study. The results from the first research shown that participants in the 3D conditions reported a higher level of attitude toward the stimulus material then did participants in the 2D condition. It is assumed that the effect on object knowledge and decision confidence presented no significant results, due to fact that the stimulus material was not complex enough to gather enough knowledge. In the main research the relation between the condition and consumers behavior is purposed to be significant stronger.
3.2.1 Experimental group
To test the hypothesis, the experiment had a 2 (Virtual House simulations: 3D vs. 2D) x 2 (Desirability for control: high vs. low) between subjects design. Whereby object-knowledge, object attitude and decision confidence intention, served as the dependent variables.
3.2.2 Participants
3.3 Material
The virtual house simulation of Viality formed the basic stimulus material in the primary experiment. Two different types of house visualizations are used as treatments to generate different levels of vividness and interactivity. As already stated above, the range of dimensions and the level of interactivity are influencing virtual object experiences. To increase the range, user control and the content for manipulating need are to be added to the visualization (Jiang & Benbasat, 2004).
3D condition
The stimulus material of both conditions includes a 3D rendering of a detached house. To overcome possible bias, the design of the house was chosen to be identical in both conditions. The house stimuli for this condition were designed as already mentioned in the point Virtual House Simulations of Viality in this research (Appendix B).
2D condition
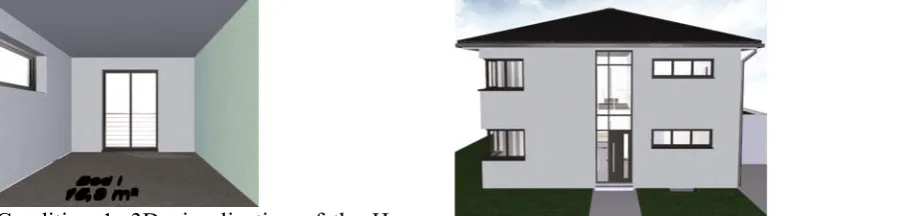
The control condition is presented in Appendix C. The major difference from the virtual condition is that the virtual functions are absent in the house model. Instead consumers are shown a pdf that includes 7 images of the house. The images are static renderings of the 3D house that is used in the first condition. The first two pictures demonstrate the front and back of the house. Three pictures demonstrate the room arrangements of the ground floor, first floor and the basement with the room distribution in square-meters. Following by two addition pictures, one of the living room and one of the bedroom 1. These pictures are used to provide users the best possible picture and knowledge of the house composition that is also – and in a similar way –used by estate agents, at the moment( Fig 3.3).
Condition 1: 3D visualization of the House meant that visitors could interact with the object, perceive it from different angles and walk virtually around
Condition 2: Visitors were presented a static image of the house with 3 additional views.
[image:25.595.73.530.587.695.2]
Figure 3.3: stimulus material used in the main experiment
3.3.1 Procedure
The survey was distributed online. The main reason for choosing this method is its low costs and convenience (Blumberg, Cooper, & Schindler, 2005). Of course, there might be some disadvantages of using the internet for data collection, such as computer skills and technical problems or also misunderstandings in using the stimulus material. However, the pre-research showed that users were able to understand the functions of the virtual pdf and were able to navigate with the mouse as if they were handling the object in real life. Nevertheless, to overcome possible handling problems an introduction of functional control is added to the stimulus material. Furthermore, because the survey is distributed online it is expected that users will have enough computer skills to receive and open the questionnaire. In order to overcome possible technical problems when viewing one of the condition files, the advice to download the newest version of the acrobat reader is given at the beginning of the experiment.
3.3.2 Questionnaire Design
The first page of the questionnaire was the introduction page. On this page respondents were asked to imagine themselves in a situation in which they were planning to build a house. For this reason they would engage an architect to develop a suitable design. To view the architect’s work, participants were requested to download and examine the 3D house model and consider whether they would like to invest in this house or not. The scenario contained a link to a different house model, presenting the house in different levels of interactivity. In addition some technical advice was given. After a thorough examination of the house visualization, participants were prompted to press the button “Did you examine the house visualization thoroughly?” to continue to the next part. Subsequently, questions about interactivity and vividness as well as the dependent variables (knowledge, attitude and decision confidence) were asked. Afterwards 20 questions were included to measure the level of desirability for control. These questions were followed by the internet experience and the satisfaction variable. The last part of the questionnaire contained demographic questions. All questions were asked on a 5-point scale.
3.3.3 Independent variables
The level of objects interactivity and vividness was varied as either presenting 2D static image of a house, or presenting house demonstration that allowed direct manipulation.
The measurement of object interactivity was adapted and modified from Jiang and Benbasat (2003) (see Appendix D). Furthermore, eleven items were used to measure vividness. They were borrowed from Kelly et al. (1989). In addition four items of the telepresence scale were adapted to the measurement. Telepresence is not a main perspective in this research, but was used to establish the feeling of directly experiencing the object. The items of the telepresence scale were developed by Kim and Biocca (1997).
The Desirability of Control Scale was developed by Burger and Cooper (1979) for the purpose of creating a measure of individual differences in the desire for control over life events, more precisely, it focuses on an individual’s “level of motivation to control the events in one’s life” (Burger & Cooper, 1979, p. 381). The scale is an instrument that measures the responses of the participants to 20 items. Each item is using a 5-point Likert scale ranging from “This statement doesn’t apply to me at all” to “This statement always applies to me”. The questions of the scale measuring the desire for control in several areas included desire to make one’s own decisions, to take preventive actions to ensure that situations do not get out of hand, to avoid situations in which others have control, and to control others (Burger & Cooper, 1979). Upon completion the scores were totaled to provide an overall level of desire for control. Higher scores related to a greater need for control in the participants.
The recent research on the scale showed the internal consistency (.70) of the instrument and were comparable to the initial finding (.75) reported by Burger and Cooper (1979). The mean value of the instrument stated 70.44 with a standard variation of 6.95.
3.3.4. Dependent Variables
The dependent variables of this study (knowledge, attitude and decision confidence) were measured using existing scales that have been proven to be reliable. However this was not possible for all constructs. Hence, two new scales have been developed. A five-point Likert Scale was used for all the measurement items (strongly disagree/strongly agree).
Object Knowledge is measured by using the scale of Park, Mothersbaugh and Feick (1994). The subjects were asked to indicate their agreement (strongly disagree/strongly agree) regarding how knowledgeable they felt about the object ranging from “very little” to “very much”. Mothersbaugh and Feick (1994) reported a Cronbach’s alpha of 0.91 for this scale.
Attitude toward the visualization was assessed using a reliably proven scale common in advertising effectiveness measurement (Bruner, 1998). Subjects were asked to indicate how they feel about the house visualization using five-point differential items (bad/good, unappealing/appealing, unpleasant/pleasant, unattractive/attractive, boring/interesting, dislike/like). In addition a self-developed item was used to measure traditional / innovative.
Experience with the Internet is measured with 1 item combined with a 5 point Likert scale,
ranging from “no experience at all” to “a lot of experience”.
Satisfaction refers to the extent to which consumers are happy with the products and services provided. Some literature indicates that consumer satisfaction plays a key role in formulating the purchase intention. In this research context, satisfaction with the architect´s work contributes to the value of decision confidence to “purchase” or invest in the house. Therefore user´s general satisfaction with the architect´s work was measured on one item, ranking from “very unsatisfied” to “very satisfied”.
4 Data Analyses and Results
In this chapter, the findings of the research are presented. The first section discusses the characteristics of the sample. This is followed by reliability tests and the manipulation check. Next, it is checked whether the manipulation performed as intended, followed by the testing of the hypotheses. It should be noted that SPSS was used for the analyses of the data.
4.1.1 Reliability Analysis
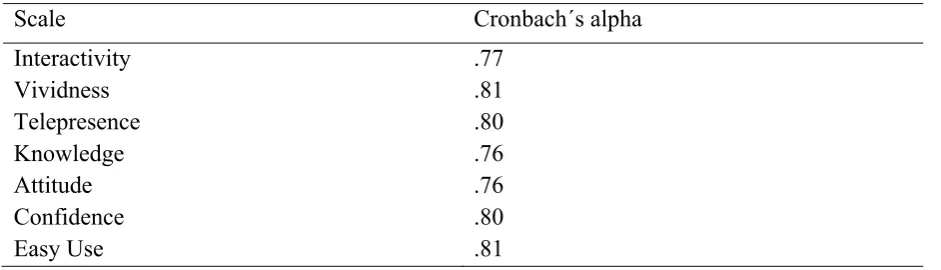
Tabel 4.1: Cronbach´s Alpha
Scale Cronbach´s alpha
Interactivity .77 Vividness .81 Telepresence .80 Knowledge .76 Attitude .76
Confidence .80
Easy Use .81
The reliability analysis shows an internal consistency of alpha .77 and .81 for object interactivity and vividness. The item “The information about the house is vague” to measure objects vividness is deleted from the measurement, because without its deletion the internal
consistency would be low (α =.64). The telepresence (α =.80), confidence (α =.80), perceived
usefulness (α =.81) and attitude toward the visualization (α =.85) present an acceptable
consistency in measuring the underlying construct. Except the scale of object knowledge (α
=.76) and general attitude (α =.76; the item boring/interesting was deleted for the
measurement to hold internal consistency high) lower alphas were provided. However, the general accepted lower limit for Cronbach´s alpha is .70. Therefore the results are still satisfactory.
4.1.2 Manipulation Check
To check whether the manipulation of different levels of interactivity and vividness were successful an ANOVA test was conducted. The level of object interactivity and vividness was manipulated in the experiment. Both conditions contained a different level. The ANOVA was conducted to check whether the manipulation performed as intended. The results indicate that the conditions significantly differ in the value of interactivity (F (1,306) = 265.91, p<.001) but
not in the value of perceived vividness (F (1,306) =0.47, p= .49). Furthermore the
manipulations-check shows that the means of both conditions vary in their interactivity value
between the 2D (M = 8.85, SD = 2.29) and 3D (M = 12.4, SD = 1.52) condition. Hence, the
manipulation was performed only partially as intended. Vividness did not turn out to be significant.
4.2 Hypothesis testing
To test thehypothesis, the Two-Way Analysis of variance was used to determine whether the
[image:30.595.67.530.369.477.2]condition groups of 2D vs. 3D and the level of desire to control, differed among the levels of decision confidence to invest in the house. The outcomes stated that group did have a significant effect (F (1, 304) = 15.27, p< .001); participants in the 3D condition report averaged higher decision confidence than participants in the 2D condition (see Table 4.2). The desirability for control also had a significant effect (F (1, 304) = 7.35, p = .007); people who had a higher desire for control reported on averaged higher rates in decision confidence than those who had a lower desire of control. The interaction effect of group and level of control did not turn out to be significant (F (1, 304) = 1.16, p =.28).
Table 4.2
Mean number of decision confidence by level of desire to control and group condition
Desire for control
Low High
M (SD) M (SD)
3D 9.96 (.22) 10.83 (.20)
2D 9.30 (.23) 9.68 (.26)
4.2.1 Mediator
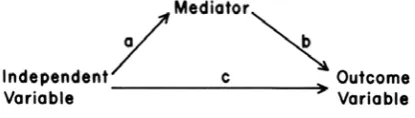
[image:30.595.73.281.666.725.2]To analyze, whether object-knowledge and attitude serve as a mediator between VHE and the dependent variables, a regression analyses for the models should be estimated. To mediation analysis must prove the following estimation: The independent variable must affect the mediator, the independent variable must affect the dependent variable and the mediator must in turn affect the dependent variable. The following figure 4.2 shows the estimations and the table 4.2.1 below summarizes the results of H2 and H3.
Tabel 4.2.1
Regression Analysis between variables: group, object-knowlegde and attitude formation
Object Knowledge
Regression F-value p-value R² β t-value p-value
a 54.86 .001 .15 .39 7.40 .001
b 79.49 .001 .20 .45 15.4 .001
c 17.98 .001 .05 .23 53.94 .001
Attitude
a 18.53 .001 .05 .23 59.75 .001
b 70.73 .001 .18 .43 9.08 .001
c 17.98 .001 .05 .23 53.94 .001
Note: p<.001
To test H2 and H3 the procedure of the linear regression analysis was run with groups, object-knowledge and attitude as independent variable with decision confidence as the dependent
variable. The results underline the significant outcome of the model with an R² = .30. The
analysis illustrates that only attitude (b = .32, t (206) = 6.36, p < .001) and object knowledge
(b =.34, t (206) = 6.46, p < .001) contribute to the relationship of consumers’ decision
confidence. The group variable turns out to provide no significant additional value regarding
consumer’s decision confidence (b = .02, t (306) = .53, p = ns). These findings demonstrate
that object knowledge and attitude as an additional variable in this regression yielded a significant effect of decision confidence. The additional Sobel test showed the mediation of object knowledge (Sobel z = 5.68, p < .001) and the mediation of attitude (Sobel z = 3.82, p < .001) to be significant. The analyses presented here support the hypothesized mediations by knowledge (H2) and attitude (H3).
4.2.2 Moderator
To test the effect of the moderator variable, namely participant’s desirability for control (DOC), the moderation is then supported, if the interaction between the predictor and the moderator is significant.
In the Desirability for control test participants could score a minimum of 20 points and a maximum of 100 points. To classify the participants in one of these control states, a
mediansplit was done, using the option Frequencies in SPSS. The mean score (M = 70, SD =
6.95) obtained in the analyses was used as a reference to classify participants into low desire and high desire for control. In other words, 143 participants who scored above than 70 points were considered to have “high desire for control”, while 165 participants who scored less than or 70 points were considered to have “low desire for control”.
To test the effect of the moderator variable, namely participant’s desirability for control (DOC), the moderation is then supported, if the interaction between the predictor and the moderator is significant. For this purpose a Two Way Variance analysis was conducted. The results of the main- and interaction effects between the variables were as following:
4.2.3 Decision confidence
The results of the interaction effect of the group variable and the moderator variable DOC
were analyzed. The interaction effect turned out to be not significant. For the dependent
variable object knowledge, the results of the two-way ANOVA show that there is a statistically significant main effect for group F (1, 304) = 52.73, p < .001, but no significant is found for the main effect of desirability of control F (1, 304) = .64, p = ns and the interaction effect F (1, 304) = 1.52, p = ns. Similar to the previous results, the ANOVA test illustrates that the main effect for group on attitude turns out to be significant F (1, 303) = 15.84, p < .001. The main effect of desirability of control F (1, 303) = 1.56, p = ns, did not turn out to be significant, nor did the interaction effect F (1, 303) = .12, p = .ns.
4.2.6 Additional testing
house simulations. In addition to this testing, it is also assumed that the variable satisfaction may have the same result. Being satisfied may also contribute to having a positive feeling or attitude toward the product. Therefore, a t-test was run to compare the means between the conditions and consumers stating to be satisfied with the architect’s work. The analysis shows that the means between the conditions indeed vary in their level of satisfaction (3D, M = 3.86, SD = .94; 2D, M = 3.41, SD = .83) with an F (2, 306) value of .12 and a p < .001.
Comparing the means between users who stated to have high or low PC experiences an
second independent t-test was used. Users in the 3D condition (M = 4.66, SD = .67) and users
in the 2D condition (M = 4.42, SD = .87) differ in their PC experiences, namely reported users
in the 3D condition on average have more PC skills than the counterparts (F (2, 306) = 17.36, p < .001). Differences between genders were not found. Furthermore a regression analysis was done in addition and reported a causal relationship between the two condition groups and the attitude toward the visualization that was measured by 5 items (F (2, 306) = 26.8, p < .001, R² = .81). Therefore, it was ascertained that a high interactivity-rate leads to a more favorable attitude toward the visualization in the consumer’s mind b = .28).
5. Conclusion
This chapter interprets the results of the data analysis. It discusses the significance of the results found for the dependent variables.
The major contribution of this research was to answer the research question of;
“What is the effect of virtual house simulations on consumers´ knowledge, attitude and decision confidence? And to what extent does consumer´s level of desirability for control influence this effect?”
The main conclusion, therefore,is that a high interactive 3D house has significant direct effects on consumers’ decision confidence, attitude formation toward the object and knowledge. Consumer´s level of desirability for control does not significantly contribute to this effect.
The results of the analyses clearly show that the condition with the higher level of interactivity, namely the 3D condition, leads to a high level of consumer confidence in the investment decision on the other hand rated participants, who were exposed to the 2D
condition, the decision level of confidence significantly lower. This is in line with the first hypothesis, therefore H1 is supported.
The outcomes of the second analyses illustrate that virtual experiences with the house – model leads to enhanced opportunity and ability to process object-related information. Consumers, who experienced the object in the interactive way, felt fewer limitations in evaluating the house and better understood the construction of it than consumers who only saw the house in 2D. Summarizing, this effect show that if consumers can virtual experience an object, they are more likely to process the object-related information on a deeper level and evaluating the object more extensive. In addition, a deeper level of object knowledge positively influenced consumer´s confidence in the decision process. The finding confirms the second hypothesis.
Confirming the third hypothesis, virtual object experiences positively influenced consumers ‘attitude toward the house, and a high level of attitude also positively influenced consumers decision confidence to invest in the object. The hypothesized significant effect of the variable attitude (H3), as influencers on decision confidence and as a mediator is also confirmed.
[image:34.595.82.522.562.700.2]The last hypothesis proposed could not be verified in this research. High and low desirability for control has not demonstrated to have an interaction effect between the condition group and the dependent variables. Due to a lack of strong evidences, it is not possible to prove the veracity of this assumption. But, in the present research it has been found that interactive 3D visualization do not necessarily positive influence participants with a higher desire of control, as also that static 2D do not influence more positively people with lower desire for control.
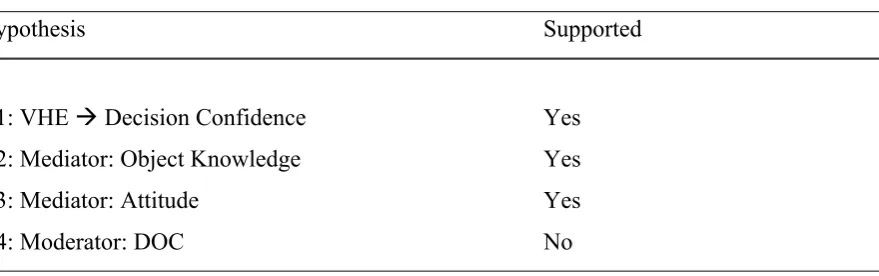
Table 5: summery of Hypothesis in the research
Hypothesis Supported
H1: VHE ÆDecision Confidence Yes
H2: Mediator: Object Knowledge Yes
H3: Mediator: Attitude Yes
H4: Moderator: DOC No
high enough to arouse the experiences of a high vividness in the 3D condition. Furthermore an interesting finding was that participants in the 3D condition tend to state more suggestions and comments for further house-design improvement that did participants in the 2D condition. Even notice that there was no required field to subscribe any suggestions, about 54 participants in the 3D condition, wrote their comments in the line of nationality. Three comments were made by subjects in the control condition. Examples of the 3D – condition comments are “A good work, you can help for rebuilding’s in japan or other destroyed countries too” and “It was really interesting!”
6 Discussion and Implications
The results support the previous theoretical work of Daugherty, Li and Biocca (2006) which argued that 3D product visualizations positive affect consumers attitude and knowledge perception. Daugherty et al. (2006) proposed than consumer will have significant higher product knowledge, learn more effective and will be more engagement in evaluating products when interacting with 3D online. The present results provide empirical support for that proposition. Furthermore reflects the outcomes of consumer’s attitude formation in this research, the findings of Li, Daugherty & Biocca (2002; 2003). The researchers have found that consumers were more enthusiastic, fell more pleasure and establish higher overall – attitude when interacting with virtual products. In the case of the present research the house-concept may stimulate participant’s metal imagination, impart knowledge and lead therefore to trust and confidence in their final decision. Kettanural et al. (2001) state that self- efficacy in gathering information give users a sense of control and improve the understanding of the object – that in turn leads to a higher user confidence. The results of this research provide strong evidence of the influence of interactive visualization on the level of decision confidence.
Even though the last hypotheses proposed could not be confirmed, some findings could represent a matter of future discussion and research. Participants responded differently, according to their degree of desirability for control. People with a high desire for control, tended to have a better attitude and object knowledge, toward the House showed in the 3D condition. Therefore it may be a possibility that the interactivity level of the 3D house is the main causes of the subject’s preferences. Participants, who have a higher need of control, may
indeed perceive the virtual 3D house as more positive and stimulating as did their counterparts.
This study is one of the first attempts to analyze the effects of 3D house visualizations in the context of the effect on consumer’s behavior. The results investigated significant impacts of object interactivity on consumer’s positive perception in knowledge, attitude and consequently decision confidence. This study takes into account the aspects and opportunities of human experiences within the technology and provides guidelines and a focus for estate agents and architects in the architectural field. House demonstrations should incorporate more “experiences” features to address all needs and decrease uncertainty of consumers. Furthermore, should estate agents in developing a house model, mainly address functional requirements that the objects should fulfil. The present study suggests that estate agents
should design more realistic rendering of the interior to generate a more positive attitude
formation, because realistic renderings are assumed to lower the mediation of the computer interface and may contribute to a more favorable attitude aspect. The new and innovative way of the house visualization and its effect on consumers behavior in this study, is suggested to improved performance for estate marketing in terms of consumer overall satisfaction and sale volumes. In addition, estate agents should decide what information (or knowledge) to focus on before developing any 3D houses. Material, size may be important details, but too much information may also overtax and confuse consumers in the online environment. Nevertheless, many companies have already claimed to improve their sales as a result designing and using 3D products. Estate agents could also use media richness as an important way to differentiate retailers and generate satisfied consumers.
7 Limitations and further research
is not examined in the current research was the measure of time participants needed to examine the stimulus material. As also the amount of interface features (e.g. zooming, rotating, shifting) participants used to interact and therefore fully inspect the object in the 3D condition.
Thirty, the novelty of such visualizations may contribute to the favorable outcomes, in this research. Prior research has shown that novelty may arouse people´s attention, stimulate their active information processing and enhance their behavior (Dabholkar & Bagozzi 2002). Therefore, if the VHE is novel to consumers, it is likely that their beliefs, attitudes and behavioral intentions will be enhanced simply due to the novelty of the simulation interfaces; a important concept for additional future research.
Finally, the classification of participants in high and low desire of control was made on a mediasplit. Therefore it might be the fact that participants, who score on average were incorrectly assigned to one of the conditions. Further research should definitely analyze the consumers level of control and interactive 3D visualization on consumers behavior.
8 References
Ariely, D. (2000). Controlling the Information Flow: Effects on Consumers' Decision Making
and Preferences. Journal of Consumer Research, 27, 233-248.
Burger, J. M., & Cooper, H. M. (1979). The Desirability of Control. Motivation and Emotion,
3, 381-393
Coyle, J. R., & Thorson, E. (2001). The Effects of Progressive Levels of Interactivity and
Vividness in Web Marketing Sites. Journal of Advertising, 30(3), 65-77.
Daugherty, T., Li, H. & Biocca, F. (2008)."Consumer Learning and the EVirtual Experience
Relative to Indirect and Direct Product Experience". Psychology & Marketing, 25(7),
568 – 586.
Dan, A. (2000). "Controlling information flow: Effects on consumers' decision making and
preference," Journal of Consumer Research, 27(2), 233-248.
Jiang, Z., & Benbasat, I. (2004). Virtual Product Experience: Effects of Visual and Functional Control of Products on Perceived Diagnosticity and Flow in Electronic
Shopping. Journal of Management Information Systems, 21(3), 111-147.
Kettanurak, V., Ramamurthy, K., & Haseman, W. D. (2001). User attitude as a mediator of learning performance improvement in an interactive multimedia environment: An
empirical investigation of the degree of interactivity and learning styles. International
Journal of Human-Computer Studies, 54, 541-583.
Kelley, C. A., Gaidis, W. C., & Reingen, P. H. (1989). The use of vivid stimuli to enhanc
comprehension of the content of product warning messages. The Journal of Consumer
Affairs, 23, 243–265.
Li, H.,Daugherty, T., & Biocca, F. (2002). Impact of 3-D Advertising on Product Knowledge,
Brand Attitude, and Purchase Intention: The Mediating Role of Presence. Journal of