Short Duration Voltage Disturbance
Identification using FFT Algorithm in
Distribution System
S. Vijaya Laxmi1, Dr. P. V. Ramana Rao2Research Scholar, Dept. of EEE, University College of Engineering, Acharya Nagarjuna University, Guntur, India1
Professor and HoD, Dept. of EEE, University College of Engineering, Acharya Nagarjuna University, Guntur,India2
ABSTRACT:Power quality issues have been a source of major concern in recent years due to extensive use of power electronic devices and non-linear loads in electrical power system. In power systems the common disturbances are voltage sags and swells, usually associated with power system faults. Therefore the effective detection of voltage sags and swells event is an important issue for both voltage sag and swell analysis and mitigation. There are several detection methods for voltage sags and swells such as RMS voltage detection, peak voltage detection, and Fourier transform methods. The most common method used for this is Fast Fourier transformation (FFT) Algorithm, the purpose for using this method is calculation of the root mean square value of the voltage supply. Using the same method that is the calculus of the RMS voltage on a cycle updated every half of cycle. The main objective is to be proposing a Fast Fourier transformation (FFT) algorithm for rapid voltage sag, swell and sag-swell detection better than other methods. This algorithm has the ability to track the amplitude of the voltage sag and swell in real time. Proposed RMS algorithm was compared to existing sag detection methods to show its fastness and robustness. The algorithms for voltage sag and swell detection using MATLAB/SIMULINK software.
KEYWORDS: FFT algorithm, sag, swells, power quality.
I.INTRODUCTION
A fault occurs in transmission (EHV), sub transmission (HV), medium-voltage (MV), and low-voltage (LV) systems and the sags and swells are propagating throughout the power system. The sag\swell distribution experienced by a low-voltage customer includes all these sags of different origin. Due to the increasing use of sensitive equipment, low-voltage sags have become in recent years, one of the central power quality (PQ) [1]-[4] concerns faced by utilities and customers. The voltage sag and swell problems are very serious in power systems, so these are the dominant factors affecting power quality. The sag and swell are generally characterized by magnitude of sag, duration, and frequency. Here the best method for detection of sag as well as swell magnitude is RMS algorithm.
To prevent problems on utility and customer power system, power quality monitoring is necessary. The demand for high quality supply is, one of the key requirements to ensure sustainable economic growth in our increasingly digital-based society. Power quality [1]-[4] is the combination of current quality and voltage quality, involving the interaction between the system and the load. Voltage quality concerns the deviation of the voltage waveform from the ideal sinusoidal voltage of constant magnitude and constant frequency. The power system can only control the quality of the supply voltage; it has no control over the currents that particular type of loads draw. Therefore, the standards in the power quality area are indicates to maintaining the supply voltage within certain limits.
conditions e.g. temporary voltage rise on the un faulted phases during an SLG fault [3]. Swells can also be caused by switching off a large load or energizing a large capacitor bank. Typical values of the voltage sags are between 10% and 90% of nominal voltage. The voltage swell limit is considered to be 110% of the nominal voltage value.
Voltage sags and swells are the consequences of transient events. A user can himself produce voltage dips in its own Installations even if there is no disturbance from the supply network. These voltage dips are produced due to the following causes: faults in the internal network, working of installations that have a high current at start or handling of installations with fluctuating load. Voltage dips determine negative effects especially on electronic equipments that are very sensitive to the magnitude variations of the supply voltage, thus in some situations a simple voltage dip can cause the stopping of devices that have electronic commands.
Fig.1: Power system Network that can produce sag/swell
The main theme of this paper is to present a method for temporary disturbances identification and analysis of voltage profile in distribution system. Several different methods have been used so far in the literature to detect and estimate the voltage magnitude during a voltage event[5]-[6]. The most common method used for this purpose is the calculation of the root mean square (RMS) value of the voltage supply.
II.POWER QUALITY DISTURBANCES
Fig.2: Power quality issues
Power quality issues are shown diagrammatically in figure 1 and figure 2 shows the power system network that creates sag/swell for observation and analysis. Power system disturbances can occur as general phenomenon and these disturbances are of two types-long term duration and short duration disturbances. Long duration disturbances are the disturbances that persist for the duration more than 1 minute. If the duration of the fault is less than 1 minute, the fault is termed as short duration fault. Long duration voltage raise is called over voltage and short duration voltage raise is called swell. Similarly, long duration voltage drop is termed as under-voltage and short duration voltage drop is termed as sag. Sag is a general phenomenon that occurs due to energizing heavy loads or starting of large motors. Swell is another kind which might be produced due to energizing capacitor banks or sudden release in loads[9].
Voltage sag might cause poor efficiency and decreases the life time of the device connected. Swell might cause the device to be damaged. This causes the power system to poor power quality. Poor power quality can cause unexpected power supply failures, equipment failure or malfunctioning, equipment overheating and might lead to reduction in lifetime of the device, increased system losses and production of EMI.
Long term sustained voltage variation if when the supply voltage is zero for more than 1 minute, the long term voltage disturbance is termed as sustained interruption. This sustained interruption cannot be cleared automatically and needs human intervention. Short term variations can be designated as instantaneous, momentary or temporary. Instantaneous variations in voltage vary from time duration 0-30 cycles, momentary variations vary from 30 cycles to 30 seconds and temporary variations vary from 30 seconds to 1 minute in time. Sag is termed as the variation in voltage from 90% to 10% of its final value for short duration. Swell is raise in voltage value from 110% to 180% if its final value. Interruption occurs when voltage or current falls to 0.1 pu in less than 1 minute. When current commutation occurs in power electronic devices, a periodic voltage disturbance is caused which is called notching. Instantaneous rapid change in voltage is called transient. Depending on the type of transient nature, transients are classified into two types- oscillatory and impulsive. Harmonics are power frequency disturbances having frequency which is integral multiples of power frequency. These power frequency disturbances can be decomposed to sum of fundamental quantity and harmonic content. These are mainly produced due to the presence of non-linear loads in the system.
III.FLOW CHART FOR IDENTIFICATION OF FAULT
Fig.3. Flow chart for Fault Identification using RMS analysis
In analysis, design and implementation of discrete signals computation the FFT Algorithm plays important role. Measuring the value of voltage, fault identification exporting to matlab is discussed in detail. The flow chart for identification of fault in distribution system by using FFT algorithm is showed in fig.3 and its each block was explained below.
A. READ SOURCE VOLTAGE FROM EACH PHASE: The fault detection process initially starts from the measurement connected to the power system network. This measurement unit connected to each phase individually. Hence it freely identifies the asymmetrical type of faults. The measured signals have been sending to the further processing of the identification of the faults.
B. PROCESS TO FFT BLOCK: The FFT analysis provides a set of mathematical tools which can be used to break down a signal into its various magnitude components. An FFT Algorithm computes estimator data. Fourier analysis provides a set of mathematical tools which can be used to break down a signal into its various magnitude components. An FFT computes the DFT and produces exactly the same result as evaluating the DFT definition directly, the most important difference is that an FFT is much faster. In the presence of round-off error, many FFT algorithms are also much more accurate than evaluating the DFT definition directly, as discussed below.
X[k] =∑ x[n]. e k = 0, 1…N-1 (1) The inverse DFT is defined as:
x[n] = ∑ x[k]. e k = 0, 1 … N-1 (2)
[1] In equations (1) and (2) above, both x [n] and X [k] may be complex. Thus, with complex x [n] and then using equation (1), N complex multiplications and (N-1) complex additions are required to compute each value of the DFT. Consequently, to compute all values of N, i.e., voltages magnitude have been evaluated accurately with very less span of time.
C. LOAD RMS VOLTAGE INTO MATLAB FILE: The identified voltage magnitude from the RMS block will given
D. TEST FOR SAG: In the matlab file, the identified voltages have been compared to the specified reference voltages with the use of logical operators, if the identified voltage is less the specified voltage given as fault identified as sag. From the standard definition of voltage sag is described as voltage value from 0.9 pu to 0.1pu of nominal value for durations from 0.5 cycle to 1min[1].
E. TEST FOR SWELL: In the matlab file, the identified voltages have been compared to the specified reference voltages with the use of logical operators, if the identified voltage is greater it is considered as swell. From the standard definition is described as voltage value 1.1 pu and 1.8 pu of nominal value for durations from 0.5 cycle to 1mint.
F. TEST FOR SAG/SWELL IN PHASES: If the Sag/Swell have been identified in the pre process then it have to identify whether symmetrical fault or asymmetrical fault. Analysis for identification of fault in the phases has taken here.
G. TEST FOR TRANSIENTS IN PHASES: If the Transients have been identified in the pre process then it have to identify whether symmetrical fault or asymmetrical fault. Analysis for identification of fault in the phases has taken here.
H. DISPLAY RESULT: The end of the identification process is displaying the results, these results can further utilized for fault reducing devices a like DVR, SFCL...Etc.
IV.FFT ALGORITHM
FFT algorithms are based on the fundamental principle of decomposing the DFT computation of a sequence of length N into successively smaller DFT. Such algorithms vary in efficiency but all of them require fewer multiplications and additions than direct DFT does. Algorithms in which decomposition is based on decomposing a sequence x [n] into successively smaller subsequence are called decimation in time algorithm. The basic idea is illustrated by considering special case of N as 2 to the power of a special integer, i.e. N2v. Thus now N is an even integer. Then X [k] can be computed by separating x [n] into two (N/2) point sequences that consist of even numbers of points and odd numbers of points, in x [n]. With X [k] given by:
X[k] =∑ [ ]. k = 0, 1 … N-1 (3)
Fourier analysis provides a set of mathematical tools which can be used to break down a signal into its various faults components. Then, it is possible to predict the effect of particular signal from previous knowledge of what effect of its individual fault component. Hence this method works in fault domain identification accurately. Fast Fourier Transform has been presented in this paper for identification of fault in power system network accurately. The function of fft in Matlab is a powerful tool for doing that even with noisy signals. The flow chart shows that fault components could extracted accurately and nicely by looking at strong peaks on the graph produced by the fft. The fft is also works fine to breakdown the L-G, LL-G and LLL-G faults.
When the FFT algorithm is applied to each supply phase it is possible to obtain the magnitude and phase of each of the frequency components of the supply waveform.
=∑ (4)
Where w is a complex nth root of unity
Table I: FFT Algorithm test cases for identification of sag, swell and sag & swell
PHASES
A B C Voltage sag, swell and
sag & swell
Case 1 0 0 0 No sag exists
Case 2 0 0 1 Sag exists in one phase
Case 3 0 1 1 Sag exists in two phases
Case 4 1 1 1 Sag exists in three
phases
Case 5 0 0 0 No swell exists
Case 6 0 0 1 Swell exists in one
phase
Case 7 0 1 1 Swell exists in two
phases
Case 8 1 1 1 Swell exists in three
phases
Case 9 0 0 0 No sag and swell
Case 10 0 0 1 Sag and swell exists in
one phase
Case 11 0 1 1 Sag and swell exists in
two phases
Case 12 11 1 1 Sag and swell exists in
three phases
All measures should be taken to reduce the sag/swell. To take any action the first step needed is to identify the parameter. Here the identification of sag/swell is much important to take necessary action against to reduce the quantity of sag/swell and bring the voltage level to nominal value. Also the identification is required in how many phases sag/swell are present in the system. So a simple RMS algorithm was developed for identification.
The test conditions were considered as 1 for ON and 0 for OFF. As shown in table 1, the sag and swell were generated for different phases of the power system. Fourier analysis provides a set of mathematical tools which can be used to break down a signal into its various magnitude components. The identified voltage magnitude from the algorithm will send to the MATLAB file for evaluation of voltage magnitudes for the given reference signal. In Matlab file multiple conditional operators have been included for identification type of fault. In the Matlab file, the identified voltages have been compared to the specified reference voltages with the use of logical operators, if the identified voltage is less the specified voltage given as fault identified as sag, if it is greater it is considered as swell.
If the Sag/Swell have been identified in the pre process then it have to identify whether symmetrical fault or asymmetrical fault. Analysis for identification of fault in the phases has taken here.
The end of the identification process is displaying the results, these results can further utilized for fault reducing devices a like DVR, SFCL...Etc.
V. RESULT AND DISCUSSION
Table II: Simulation Parameters
PARAMETER VALUE
1 Input voltage 11 kv
2 Load 100 kw
3 Load impedance 0.1 + j 0.001
Matlab results were obtained by considering simulation parameters are showed in table II, at different cases producing sag in different phases of system.
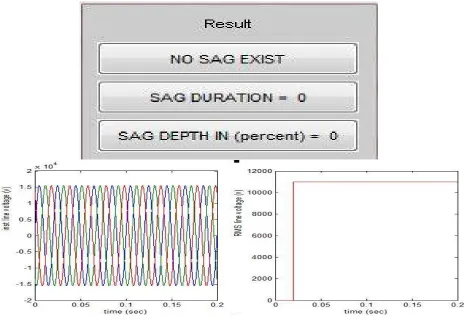
Case 1: No sag exists in the system.
Fig.4: result showing no sag present in the system.
Case 2: Only sag exists in 1 phase of the system.
Fig.5: result showing sag present in 1 phase.
Fig.5 shows that sag is exist in only 1 phase; it is clearly shows in waveform of RMS voltage. The duration of sag in phase A is 0.1 sec and sag depth is 0.18%. This type of sag will occurs due to fault in single phase to ground called as L-G fault.
Case 3: Sag exists in 2 phases of the system.
Fig.6 shows sag present in 2 phases of the system, the variations in waveform clears that sag occurs. The duration of sag is 0.1 sec and depth of sag is 0.449%.
Case 4: Sag exists in 3 phase of the system.
Fig.7: result showing sag present in 3 phases.
Figure.7 shows sag present in 3 phases. The duration of sag is 0.1sec and depth of sag is 0.60%. This type faults are very dangerous faults causes high sag in distribution system.
Case 5: No swell exists in the system.
Fig.8 shows the result window noting that no swell is present in the system, this case is known as No Fault condition. In that above figure clears there is no any deviation in RMS line voltage.
Case 6: Only swell exists in 1 phase of the system.
Fig.9: result showing swell present in single phase.
Fig.9 shows that swell is present in only 1 phase of the system, in waveform it is clearly shows a deviation in RMS voltage. The duration of swell in phase A is 0.084 sec and swells depth is 0.39%. This type of swell will occurs due to the lightning effect in single phase.
Case 7: Swell exists in 2 phases of the system.
Fig.10 shows swell present in 2 phases of the system, the variations in waveform clears that swell occurs. The duration of swell in phase A and B is 0.08 sec and depth of swell in phase A is 0.39%, in phase B is 0.49%.
Case 8: Only swell; exists in 3 phase of the system.
Fig.11: result showing swell present in three phases.
Figure.11 shows swell present in 3 phases. The duration of sag is 0.084sec and depth of sag is 0.39%. This type swell occurs due to the switching’s and surges in distribution system.
Fig. 12 shows the result window noting that no sag and swell in system, this case is known as No Fault in system. In above figures clears that there is no any deviation in RMS line voltage.
Case 10: Sag and swell exists in 1 phase of the system.
Fig.13: result showing sag & swell present in single phase.
Fig.13 shows that sag and swell is present in only 1 phase of the system, in waveform it is clearly shows sag and swell of RMS voltage. The duration of sag in phase A is 0.1 sec and sag depth is 0.19%, similarly swell has 0.093 sec duration and 0.3% depth. This type of sag will occurs due to short circuit fault in single phase to ground called as L-G fault.
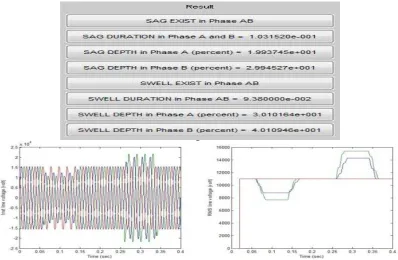
Case 11: Sag and swell exists in 2 phases of the system.
Fig.14 shows sag & swell present in 2-phase of system, the variations in waveform clears that both swell and sag occurs. The duration of sag in phases AB is 0.1sec and depth of sag in both phases are 0.199% * 0.299%.
Case 12: Sag and swell exists in 3 phase of the system.
Fig.15 Result Showing Sag & Swell Present In Three Phases
Figure.15 Shows Sag & Swell Present In Three Phases Of The System. The Duration Of Sag In Phases Abc Is 0.09sec And Depth Is 0.30%.
VI.CONCLUSION
A sag and swell detection algorithm has been proposed and compared and implemented in Matlab by using Simple FFT analysis. The simulation study of algorithm has been presented in this paper for extracting voltage component of source voltage under sag, swell and sags and swell conditions. The function of in Matlab is a powerful tool for doing that even with noisy signals. The identification process is very accurate. The simulation results shows that sag, swell and sag & swell have been identified. The waveform distortion during a voltage sag, swell and sag & swell may provide some additional information on the cause of the event as well as some diagnostic on the system.
REFERENCES
[1] [1]. Suresh Kamble and Dr.Chandrashekhra Thorat," A New method for Voltage Sag Detection" IEEE International Conference on Advances in Engineering, Science and Management (lCAESM -2012) March 2012.
[2] "IEEE Recommended Practice for Monitoring Electric Power Quality," IEEE Std. 1159-1995, June 1995. [3] "IEEE Guide for Service to Equipment Sensitive to Momentary Voltage "IEEE Std 1250-1995.
[4] C.Mestres," Computer Power Supply, analysis of service quality in voltage dips field." Revue journal of electrical power supply 81(9):531-6 [5] F.Tosato and G.Giadrossi, et al."The problems posed by voltage supply dips to industrial power electronic loads", 6th Mediterranean
Conference Electro technical Proceedings (Cat.No.91CH2964- 5),22-24 May 1991,Slovenia,IEEE.
[6] L. Cristaldi, A. Ferrero, and S. Salicone, ―A distributed system for electric power quality measurement,ǁ in Proc.
18th IEEE Instrumentation and Measurement Technology Conf., Budapest, Hungary, 2001, vol. 3, pp. 2130–2135. [7] H. J. Bollen, Understanding Power Quality Problems: Voltage Sags and Interruptions. New York: IEEE Press, 1999
[9] J. C. Smith, J. Lamoree, P.Vinett, T. Duffy, and M. Klein, “The impact of voltage sags on industrial plant loads,” in Proc. Int. Conf. Power Quality:End-Use Applications and Perspectives (PQA’91), 1991, pp. 171–178.
[10] Ding Ning, Cai Wei, Suo Juan, Wang Jianwei, and Xu Yonghai, “ Voltage Sag Disturbance Detection Based On RMS Voltage Method,” IEEE power And Energy Engineering Conference, pp.1-4, March 2009.
[11] A. O. Al-Mathnani, M. A. Hannan, M. Al-Dabbagh, M. A. Mohd Ali, and A. Mohamed, “Development of New Control Strategy for Voltage Sag Mitigation,” 2nd IEEE International Power and Energy Conference, pp. 318-323, Dec.2008