Future Flight Decks:
Impact of +Gz on Touchscreen Usability
Huseyin Avsar, Joel E. Fischer, Tom Rodden
The Mixed Reality Laboratory
School of Computer Science
University of Nottingham
{psxha6, joel.fischer, tom.rodden}@nottingham.ac.uk
ABSTRACT
Future flight deck designs from various avionics manufacturer incorporate touchscreen technology. There is little published research investigating the impact of inflight vibrations and increased G-Force (+Gz) on touchscreen usability. A Fitts’ law experiment was conducted to understand the effect of +Gz on touchscreen usability. 2-Gz and 3-2-Gz conditions were simulated with a weight-adjustable wristband. Empirical results and subjective ratings showed a large impact of +Gz on performance and fatigue indices. While the simulated +Gz increased linearly, throughput decreased exponentially, and movement time increased exponentially. This was also reflected by subjective ratings across all conditions. Findings suggest to transfer the experimental setting into a more realistic environment (human centrifuge) where ecological validity can be achieved.
KEYWORDS
Touch Screen, Usability, Fitts’ Law Experiment, Target Acquisition, Flight Deck Design, Increased G-Force (+Gz)
INTRODUCTION
One of the remarkable changes of this decade is the transition to touchscreen technology in nearly all sort of consumer products. The avionics industry is one of the domains that gained considerable interest in touchscreen technology. Lockheed Martin was one of the early adopters that envisioned a panoramic cockpit display (8 by 20-inch panel) in the F-35 fighter jet (Figure 1). The reduction of switches and mechanical controls on the flight deck, compared to fourth generation jet fighters (e.g. F-16), is noticeable. The aim of touchscreen integration was to achieve a user friendly design that reduces pilot workload during combat [17][12].
Using touchscreens in a non-stationary environment (e.g. while walking [6], being in a vibrating environment [11], driving [10] or flying an aircraft [4]) revealed that these sort of activities and environments impede the speed and accuracy of performance. In a different study [1] aiming to explore and understand potential benefits and challenges of interactive displays on a flight deck environment, pilots mentioned that increased G-Force (+Gz) in addition to inflight vibrations might have a negative impact on usability. Pilots flying a fast-jet aircraft are frequently exposed to periods of increased +Gz during agile flight maneuvers. Academic research conducted in a simulator [7] and in a real aircraft [4] revealed that potential touchscreen operators tend to hold (stabilize their hands) the device while interacting with the user interface. Considering the flight deck of the F-35, with its edge to edge display, pilots will have less opportunity to stabilize their hands. Thus, pilots will have less opportunity (especially for interactive areas on the center of the display) to counterbalance the negative effects of inflight vibrations and alternating G-Forces.
The first and only study that investigated the impact of +Gz on touchscreen usability is performed by Le Pape and Vatrapu [15]. Participants performed button selection and letter selection tasks on a mobile device that was attached on the thigh of participants in an aerobatic aircraft. The experiments were performed in 5 alternating Gz levels (+1Gz, +2Gz, +3Gz, -1Gz and -2Gz). Results revealed that, performance on both the button selection and letter selection tasks worsened under altered ±Gz acceleration
Permission to make digital or hard copies of all or part of this work for personal or classroom use is granted without fee provided that copies are not made or distributed for profit or commercial advantage and that copies bear this notice and the full citation on the first page. Copyrights for components of this work owned by others than ACM must be honored. Abstracting with credit is permitted. To copy otherwise, or republish, to post on servers or toredistribute to lists, requires prior specific permission and/or a fee. Request permissions from [email protected]. HCI-Aero '16, September 14-16, 2016, Paris, France © 2016 ACM. ISBN 978-1-4503-4406-7/16/09…$15.00
[image:1.612.344.541.558.697.2]conditions compared to the +1-Gz condition. The difference in time latency between +1-Gz and +3-Gz was approximately 20%. In this experiment the mobile device was inside the zone of convenient reach [16] and the participant’s hand was always at the same height. Future flight deck concepts incorporate fixed as well as mobile touchscreens. For fixed displays, pilots have to extent and raise or lower their arms to interact with the aircraft system; this could be a further degrading factor (assuming no hand support is provided) on usability which needs further investigation.
This paper presents the results of a lab study that evaluated touchscreen performance on fixed displays under simulated +Gz conditions. The key hypotheses driving this work are:
Increased +Gz will have a negative impact on interaction speed and accuracy.
Participants subjective ratings for their fatigue indices will be affected by increased +Gz.
METHOD
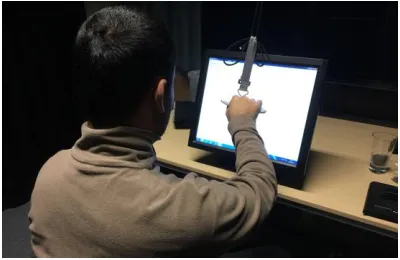
Figure 3 illustrates a person operating a touchscreen. Using this figure, a simplified equation (Equation 1) can be created that describes the moment (Ma) that applies to the arm of the operator. The two variables which may change by each person is the resulting mass (m) of the arm and the distance (a) to the display. The gravitational force (g) on earth is 9.81 m/s2.
The gravitational force will be doubled if pilots perform a 60° turn. Thus, the moment (Ma) that applies to pilot’s arm will be doubled. Since the gravitational force cannot be increased in the lab, the mass of the arm will be increased to simulate +Gz. There is no study existing that simulated +Gz in a lab environment and this approach was the first method that simulated this factor.
𝑀𝑎 = 𝑚 × 𝑔 × 𝑎
Equation 1
Participants
10 male participants were recruited from the local campus. Their age ranged from 23 to 33 years (M=25, SD=2.87). All participants were right handed, owned a touch enabled device (smartphone or/and tabled) and registered in a post graduate course (Master or PhD). The participants’ average touchscreen experience was 4.65 years. Six participant frequently played action or strategy games on their devices which requires fast and precise interaction. On a 10-point scale (10 means very good) participants rated their touchscreen skills (M=8.40, SD=1.17). Five participants have previously taken part in a Fitts’ Law experiment.
Apparatus
Figure 2 shows the equipment that was used during the experiment. The task was displayed and executed on a 19-inch resistive touch screen display (Iiyaama Prolite T1932SR) with a resolution of 1280 x 1024 pixels. A portable luggage scale with a graduation of 0.1 kg was used to measure the weight of participant’s arm. A weight-adjustable wrist band with 10 pockets (empty weight 0.13 kg) was used to increase the moment that applies to the participant’s arm. Required weight were merged with iron bars (0.5 kg) and small iron balls (pellets). A digital weight scale with a graduation of 0.001 kg was used to adjust the total weight that will be added to the wrist band.
Experimental Design
A 3x2x3 within-subjects design with repeated measures was used for the experiment. Primary independent variable in this lab experiment was simulated +Gz (3 levels – 1-Gz, 2-Gz and 3-Gz). Secondary independents variables included target width (2 levels – 55 px (15 mm) and 75 px (20mm)) and target distance (3 levels – 100, 300 and 900 px); these were controlled by the software (taken from [13]), where dependent variables like movement time, touch position, error rate and throughput were recorded.
Task Design
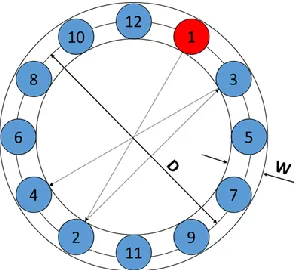
The ISO 9241-9 [9] recommended task design for input devices evaluation is illustrated in Figure 4. In this multi-directional tapping task targets are arranged around a circle. The task is to tap all targets in a consecutive order. F = m x g
a
[image:2.612.338.544.349.488.2]Ma
[image:2.612.123.217.494.635.2]Figure 2. Equipment used during the Experiment.
Taps outside of the circle are recorded as an error. The distance and the width changes after each sequence is completed.
The Throughput (TP), which is the index of performance, can be calculated by taking the quotient of Index of Difficulty (ID) and Movement Time (MT). (Equation 2)
𝑇𝑃 =𝐼𝐷𝑒
𝑀𝑇
Equation 2
The Shannon formulation of the index of difficulty (in bits) is calculated by using distance between two targets (D) and the target size (W). Movement Time (MT) is the mean movement time (seconds) between targets during a sequence. (Equation 3)
𝐼𝐷𝑒= 𝑙𝑜𝑔2(𝐷𝑒
𝑊𝑒
+ 1)
Equation 3
The subscript e, which is available at ID, D and W is indicating the adjustments for accuracy which is proposed by Grossmann [8]. We is calculated as 4.133 x SDx, where
SDx is the standard deviation in the selection coordinates
and De is the mean of the actual movements distances in
the sequence of trials. Fitts’ Law prediction model can be created by using a series of data generated over a wide range of ID. Equation 4 shows the required (predicted) movement time to reach a target of size (W) over a distance (D). The two constants a and b are found using regression analyses.
𝑀𝑇 = 𝑎 + 𝑏 × 𝑙𝑜𝑔2(𝐷𝑒
𝑊𝑒
+ 1) = 𝑎 + 𝑏 × 𝐼𝐷𝑒
Equation 4
Table 1 summarises the experimental details. 13 targets were displayed per sequence. 3 levels of distance are crossed with 2 levels of width resulting to 6 distinct sequences per block. In this experiment the ID ranged from ID=log2(100/75+1)=1.20 bits to ID=log2(900/55+1)=4.1
[image:3.612.103.250.53.188.2]bits. Participants performed 5 blocks in a specific level of simulated +Gz. Thus, 10 participants generated 11700 data points during the experiment.
Table 1. Experiment Summary.
Description Levels
Participant 10
+Gz 1-Gz, 2-Gz and 3-Gz 3
Distance (D) 100, 300 and 900 3
Width (W) 55 and 75 2
Targets per Sequence Every 27.7° 13
Number of Blocks 1,2,3,4 and 5 5
Total Number of Taps 11700
Task Order (Counterbalancing)
In order to eliminate carry on and learning effects, the sequence of simulated +Gz was combined with its (3) levels. Six possible combinations were assigned to participants randomly. A particular sequence was not assigned to a participant until all possible combinations was conducted.
Subjective Questionnaire
In addition to empirical measurements, an independent rating scale based on ISO 9241-9 was used to assess impressions of each simulated +Gz. The independent rating scale is subdivided into two group of indices; general and fatigue indices. Questions for general indices are; Smoothness during operation, effort required for operation, accuracy and operation speed. Questions for fatigue indices are; wrist, arm, shoulder and neck fatigue. On a 7-point scale the questionnaire is formatted in a positive direction, with the highest values being associated with the most positive impressions.
Procedure
The investigator explained the aim and objectives of the experiment. After that participants gave their consent by signing a form, and their demographic details were recorded. Participants who had not previously taken part in a Fitts’ Law experiment performed a familiarisation task (without weight) before the experiment. Task design and relevant equations were explained. The investigator demonstrated the experiment before participants start with the familiarisation session. Required time and blocks were recorded until participants achieved plateau in TP results and there was no significant improvement. This data set was used to create the power law of practice for this setting and to estimate how long participants needed to practise until they reach their personal maximum performance. The training session terminated, if the investigator or the participant thought they reached their maximum capable TP value, which was important to exclude the learning effect during the experiment.
[image:3.612.325.559.72.190.2]least 1 hour for participants who took part in the experiment for the first time and 30 minutes for participants who had prior experience. Breaks between both sessions were set to reduce fatigue effects.
In a different study [3] we investigated the impact of various display positions on touchscreen performance and found that participants achieved higher TP values and made less errors at display positions which were closer to the participant’s body. Compared to far display positions, participants’ fatigue indices were also better at near display positions. This information was shared with participants and they were free to adjust their sitting position with respect to the display. Participants used their right hand, which was the dominant hand in all cases. Before the experiment started the investigator asked participants to rest their arm on a portable scale (Figure 5). The measurement was repeated a couple of times until similar values were observed. This value was doubled or tripled in 2-Gz and 3-Gz conditions using a weight adjustable wristband.
Depending on the task order, the investigator prepared the wristband and attached it to the participant’s right arm. After attaching the wristband, the weight was checked again with the same method, and then the experiment started. Participants were asked to do the tasks as fast and accurate as possible and to rest if participants felt fatigued.
After the 3rd block the investigator asked participant to fill
in the subjective rating scale for the current setting. Once the block was finished participants had the opportunity to adjust their ratings. The other two conditions were repeated in the same manner.
RESULTS
Data from 900 sequences was imported. Because of unwanted touches or touching the same target twice, 13 sequences were faulty and excluded from the data set. The distribution characteristic for Throughput (TP) results were assessed. Throughput results were normalized using log transformation. The mean skewness of the distributions, for subgroups defined by level of simulated +Gz, was 0.08. The mean kurtosis was 0.53. Both of these values are low, indicating no overall tendency towards a negative or positive skewness or towards a flat or peaked distribution.
A Shapiro-Wilk test and a visual inspection of their histograms, normal Q-Q plots and box plots showed that TP scores were approximately normally distributed.
Throughput (TP)
The grand mean values for simulated +Gz are shown in Table 2. As expected participants achieved their best results in the 1-Gz condition without added weight on their wrist. Compared to 1-Gz the decrease in TP values in 2-Gz condition is 6.8% and in 3-Gz condition 20%. With the aim to see the trajectory of TP development one participant was asked to conducted a further condition that simulated a 4-Gz condition. The average TP value across 5 blocks was 50% lower than his TP results for 1-Gz condition. This indicates that the decrease in TP values is exponentially to increase in +Gz. ANOVA showed a significant large effect (ηp2=0.23) of +Gz to TP results. Bonferroni post-hoc test
showed that all levels of simulated +Gz were significantly different from each other. F(2,887)=135, p<.001.
Cohens’ D was used to compare the effect size pairwise. Except 1-Gz and 2-Gz (small effect) combination other two combinations showed a large effect on TP results.
Table 2. Throughput for simulated +Gz.
Description Mean (bps) SD (bps)
1-Gz 8.33 1.41
2-Gz 7.76 1.33
3-Gz 6.66 1.14
Movement Time
[image:4.612.69.269.299.429.2]The grand mean values for simulated +Gz are shown in Table 3. It was observed that participants performing 2-Gz and 3-Gz conditions used more rest time between sequences and blocks, and conducted the experiment in a slower pace. Compared to 1-Gz condition the decrease in movement time in the 2-Gz condition is 10% and in the 3-Gz condition 29%. ANOVA showed a significant medium effect (ηp2=0.08) of +Gz on movement times. Bonferroni
post-hoc test revealed that all levels of simulated +Gz were significantly different from each other. F(2,887)=37.4, p<.001.
[image:4.612.325.558.608.671.2]Cohens’ D was used to compare the effect size pairwise. Except 1-Gz and 2-Gz (small effect) combination, the other two combinations showed a medium effect on movement time results.
Table 3 Movement Time for simulated +Gz.
Description Mean (ms) SD (ms)
1-Gz 347 121
2-Gz 382 146
3-Gz 449 168
There is a known speed-accuracy trade-off in Fitts’ Law experiments [18]. The weight on participant arm decreases the movement time. However, the participants’ aiming performance was better. ANOVA proved that +Gz improved the effective width (We) significantly, which
compensated the difference in TP values. F(2,887)=5.5, p=.004. The total time from beginning of a block to completion provides a more comprehensive view of the impact of +Gz on performance. Participants conducted the 1-Gz condition in 5.30 minutes (SD=1.57) for the 2-Gz and the 3-Gz condition the average time increased by 23% and 38%.
Fitts’ Law Prediction Models are shown on Figure 6. Equation 5 represent the 1-Gz condition, Equation 6 the 2-Gz and Equation 7 the 3-2-Gz condition. All equations have a high R2 value, showing that Fitts’ Law is a valid method
for this experimental setting. Interceptions should be slightly above 0 ms [18] which is present in all cases. The increase in slope with increasing +Gz shows that participant experiencing high +Gz requires more time to point a target which is small and further away from their current hand position.
𝑀𝑇 = 53.8 + 100.0 × 𝐼𝐷𝑒, 𝑅2= 0.89
Equation 5
𝑀𝑇 = 22.7 + 124.5 × 𝐼𝐷𝑒, 𝑅2= 0.91
Equation 6
𝑀𝑇 = 49.4 + 133.1 × 𝐼𝐷𝑒, 𝑅2= 0.93
Equation 7
Error Rate
In this experiment two target sizes were used. 55 px corresponds to 15 mm and 75 px to 20 mm targets. A t-test (t(702)=9.0, p<.001) revealed that participants made approximately three times less errors on 20 mm targets (M=1.65%, SD=3.94%) compared to 15 mm targets
(M=5.05%, SD=6.92%). Levene’s test for equality for variances was rejected.
The error rates in different simulated +Gz showed also a significant difference. F(2,887)=4.0, p=.018. Bonferroni post-hoc test revealed that only 3-Gz (M= 2.69%, SD=5.2) and 1-Gz (M=4.04%, SD=6.38) pairwise combinations are significantly different from one other. (2-Gz (M=3.29%, SD=5.94))
Learning Curve
5 Participants performed the Fitts’ Law experiment for the first time. During the familiarisation session participants conducted the experiment without any weight on their wrist. TP results for each block were recorded and plotted in Figure 7. The corresponding Equation 8 gives the power law of practice for this setting. Participants who performed the experiment for the first time have an overall TP of approximately 5.9. Approximately after 20 blocks (1560 taps) participants reach their personal maximum TP values which is around 8.5. A similar mean value was achieved in the previous study [3]. Participants required on average 38 minutes to minimise the effect of learning and to stabilise their TP values. For future projects it is recommended to offer potential research participants a training that lasts at least 40 minutes. Ideally, the training session should be performed one day before the real experiment to avoid fatigue effects which could be still present from training session.
𝑇𝑃 = 5.51 × 𝑛0.153 , 𝑅2= 0.93
Equation 8
Subjective Ratings
As expected subjective rating scales were not normally distributed, non-parametric tests were applied. Kruskal Wallis H test showed that there was a statistically significant difference in all rating scores between different simulated Gz. Except for accuracy (p=.032) all other p values were <.001. Table 4 shows mean rank scores and χ2
results for subjective ratings. 0
200 400 600 800
0 1 2 3 4 5 6
Mo
v
em
en
t
T
im
e
(m
s)
Effective Index of Difficulty (bits)
[image:5.612.56.293.327.509.2]Linear (1-G) Linear (2-G) Linear (3-G)
Figure 6. Fitts’ Law Prediction Models. 0
2 4 6 8 10
0 5 10 15 20 25
T
h
ro
u
g
h
p
u
t
(b
p
s)
Block (n)
[image:5.612.323.552.384.543.2]For smoothness, during operation and speed ratings the 1-Gz and the 2-1-Gz condition did not differ significantly. The other two possible pairwise comparisons differed significantly. For accuracy, the 1-Gz and the 3-Gz condition differed significantly from each other. The other two possible pairwise comparisons did not differ significantly. All other pairwise comparisons which were not mentioned above showed a significant difference.
Table 4 Mean Ranks and χ2 results for Subjective Ratings.
Description 1-Gz 2-Gz 3-Gz χ2
Smoothness 23.45 17.25 5.80 21.90
Effort & Comfort 25.20 15.80 5.50 25.96
Accuracy 10.00 17.70 18.80 6.89
Speed 24.75 16.25 5.50 24.87
Wrist 25.45 15.45 5.60 26.71
Arm 25.25 15.75 5.50 25.93
Shoulder 25.30 15.70 5.50 26.28
Neck 25.50 15.50 5.50 27.69
DISCUSSION
Empirical and subjective results largely confirmed our hypotheses. Throughput results showed a reduction in mean values with increased +Gz. The trend indicated an exponential fall in TP values. Rest time to recover from fatigue were not reflected in the TP values. Therefore, it is important to consider the movement time analyses. Analysing movement time and the overall time needed to complete a condition provided a more comprehensive view of the potential impact of +Gz on touchscreen usability. Fitts’ Law Prediction Models all yielded high R2 values
showing that this methodology is valid for this research area.
Comparing movement time results with the latency time results from La Pape and Vatrapu [15] shows that placement of the device (fixed or mobile) plays a significant role in overall performance. A similar finding was also achieved in the previous study investigating the effects of inflight vibrations [4]. Average latency results from La Pape and Vatrapu showed also an exponential increase with linear increase in +Gz. This suggests that the experimental setting mimics increased +Gz with a weight adjustable wristband in a way that ecological validity is achieved to some extent. This study also investigated negative Gz (-1-Gz and -2-Gz). -1-Gz condition showed an increase and -2-Gz showed a decrease in latency time compared to +1-Gz. Authors did not discuss the potential reason why participants were faster in pointing the target in -2-Gz condition. A possible explanation could be carry on and learning effects because -2-Gz condition was always the last condition in the sequence.
Participants subjective ratings supported the overall view. Some participants who performed 3-Gz condition before others changed their ratings after the 1-Gz and the 2-Gz
conditions were completed. The reason for this was to highlight the effect of +Gz to fatigue indices. All participants agreed that compared to the 1-Gz condition the inconvenience in the 2-Gz condition in their arm, shoulder and neck was moderate. However, the 3-Gz condition had a strong effect to these indices compared to the other two conditions. Figure 8 shows a participant who conducted the experiment in 3-Gz condition. Their discomfort was visible in that participant tried to counterbalance the effect of the weight adjustable wristband by leaning to the left. During post-experiment interviews participants said that the 3-Gz condition was painful, and estimated a simulated 4-G condition as their limit where they could finish a sequence (13 taps) before they have to rest their arms.
In comparison, Pape and Vatrapu study showed no significant difference in subjective satisfaction and wellness across all Gz conditions. The reason could be because the mobile device was on the thigh of participants (smaller moment on the arm) and there was less arm, shoulder and neck movement required.
The increase in accuracy with increasing simulated +Gz, was the only unanticipated result of the study. It was assumed that participants would not decelerate properly and overshoot targets due to the additional weight on their wrist, which was in fact the case. It was observable that participants who made a movement from the top of the screen towards the bottom overshoot targets and had to adjust. However, participants were able to increase their accuracy, due to the unusual condition that slowed their movement speed down. The increase in accuracy compensated for differences in TP values, which were smaller compared to the mean movement time. Error rates of 20 mm target were approximately three times lower than for 15 mm targets, which suggest to use 20 mm targets on fixed displays on the flight deck.
The realism of the current study’s simulation of increased +Gz is limited. Experienced weight increase in this setting was created by adding additional weight to a certain point (wrist) which is not the case in a real flight. During a steep
[image:6.612.334.547.221.395.2]turn the increase of G-Force is experienced by the whole body, equally. +Gz can cause a reduction in the pilot’s brain blood pressure, and it takes a certain amount of time until the body can compensate for this change. A study investigated the effects of ±Gz acceleration on cognitive performance revealed performance degradation in tracing, system monitoring and a strategic resource management task [14]. Another limitation worth mentioning are the physical conditions of participants. Pilots flying a fast jet aircraft have to pass medical tests and need to be in a good physical condition. Physical fitness might be a compensating factor that could reduce the effect of increased +Gz by a certain amount. Aside from these limitations this experiment provides evidence that increased +Gz is a potential impeding factor on touchscreen usability. It is recommended to transfer this setting to a human centrifuge, where the effect of +Gz can be studied in a more realistic way.
The main question is about whether touch displays are suitable for such challenging environments? This study is part of a research project that investigates potential benefits and challenges of touchscreens on flight decks. The framework [2] showed that there are many factors (e.g. inflight vibration, location of the display, interface design and interaction strategy) that affect performance. Overall, all impeding factors should be considered before making a decision whether touchscreen technology is a suitable interface for the desired aircraft system. However, based on current findings, we can say that there is a break-even point between 2-Gz and 3-Gz; below this point pilots can benefit from touchscreen technology. Towards 3-Gz and beyond it will be a challenging task to interact with fixed displays. Therefore, for tasks that are likely to be beyond this point, it is recommended to use hard controls which are in close proximity (on control stick or throttle) to pilots.
CONCLUSION
This study investigated the effect of +Gz on touchscreen performance. It was confirmed statistically that +Gz has a negative effect on usability. The drop in empirical results as well as subjective ratings is exponential with linear increase in simulated +Gz. There was a small increase in accuracy with increasing +Gz.
FUTURE WORK
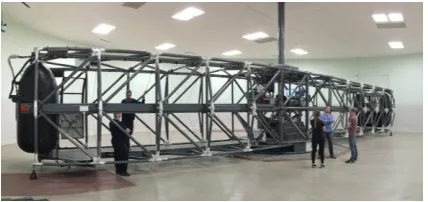
We seek to transfer this experimental setting to a human centrifuge, where experiments can be conducted under
more realistic conditions, such as QinetiQ’s human centrifuge [5] (Figure 9), which is one of 20 centrifuges available worldwide. It is used to simulate extreme +Gz experienced by fast jet aircraft pilots and astronauts with the aim to train the crew and to develop countermeasures to the impacts of +Gz on the human body. It is capable of simulating 9-Gz turns for manned experiments and 30-Gz for equipment testing.
ACKNOWLEDGMENTS
This research project is supported by EPSRC grant EP/K504506/1. In addition, I would like to thank GE Aviation, the industrial partner of my ICase PhD Studentship.
REFERENCES
[1] Avsar, H. et al. 2016. Designing touch-enabled electronic flight bags in sar helicopter operations.
International Conference on Human Computer Interaction in Aerospace: HCI-Aero (Paris, 2016).
[2] Avsar, H. et al. 2016. Mixed method approach in designing flight decks with touchscreens: A framework. 2016 IEEE/AIAA 35th Digital Avionics
Systems Conference (DASC) (Sacramento, 2016).
[3] Avsar, H. et al. 2016. Physical and environmental considerations for touchscreen integration on the flight deck. Unpublished. (2016).
[4] Avsar, H. et al. 2015. Target size guidelines for interactive displays on the flight deck. 2015
IEEE/AIAA 34th Digital Avionics Systems
Conference (DASC) (Prague, Sep. 2015), 3C4–1–
3C4–15.
[5] Centrifuge: 2016. http://www.qinetiq.com/about-us/our-history/our-facilities/Pages/centrifuge.aspx. Accessed: 2016-02-02.
[6] Conradi, J. et al. 2015. Optimal touch button size for the use of mobile devices while walking. Procedia Manufacturing. 3, (2015), 387–394.
[7] Dodd, S. et al. 2014. Touch screens on the flight deck: The impact of touch target size, spacing, touch technology and turbulence on pilot performance.
Proceedings of the Human Factors and Ergonomics Society Annual Meeting. 58, 1 (Sep. 2014), 6–10.
[8] Grossman, E.R.F.W. 1960. The information-capacity of the human motor-system in pursuit tracking.
Quarterly Journal of Experimental Psychology. 12, 1 (Jan. 1960), 01–16.
[9] International Standard Organisation 2007. ISO 9241-9 Ergonomic requirements for office work with visual display terminals.
[10] Kim, I. and Jo, J.H. 2015. Performance comparisons between thumb-based and finger-based input on a small touch-screen under realistic variability.
[image:7.612.66.280.595.696.2]International Journal of Human-Computer
Interaction. 31, 11 (Nov. 2015), 746–760.
[11] Lin, C.J. et al. 2010. The performance of computer input devices in a vibration environment.
Ergonomics. 53, 4 (Apr. 2010), 478–490.
[12] Lockheed Martin F-35 Lightning II: 2015.
https://en.wikipedia.org/wiki/Lockheed_Martin_F-35_Lightning_II. Accessed: 2016-05-20.
[13] MacKenzie, S.I. 2015. Fitts’ throughput and the remarkable case of touch-based target selection.
Proceedings of the 16th International Conference on Human-Computer Interaction - HCII 2015 (LNCS 9170). Springer. 238–249.
[14] Morrison, J.G. et al. 1994. Cumulative effects of +Gz on cognitive performance. Proceedings of the Human Factors and Ergonomics Society Annual Meeting. 38,
1 (Oct. 1994), 46–50.
[15] Le Pape, M.A. and Vatrapu, R.K. 2009. An experimental study of field dependency in altered Gz environments. Proceedings of the 27th international conference on Human Factors in Computing Systems
- CHI 09 (New York, 2009), 1255.
[16] Pheasant, S. and Haslegrave, C. 2005. Bodyspace:
Anthropometry, ergonomics and the design of work.
[17] Philips, E.H. 2006. F-35 cockpit tech. Aviation Week & Space Technology. 164, 6 (2006), 59.
[18] Soukoreff, R.W. and MacKenzie, I.S. 2004. Towards a standard for pointing device evaluation, perspectives on 27 years of Fitts’ law research in HCI.
![Figure 1. F-35 Cockpit [12] © Ahunt.](https://thumb-us.123doks.com/thumbv2/123dok_us/8595261.371543/1.612.344.541.558.697/figure-f-cockpit-ahunt.webp)