PROTEIN-CARBOHYDRATE INTERACTIONS
Davina Noelle Moothoo
A Thesis Submitted for the Degree of PhD
at the
University of St Andrews
1998
Full metadata for this item is available in
St Andrews Research Repository
at:
http://research-repository.st-andrews.ac.uk/
Please use this identifier to cite or link to this item:
http://hdl.handle.net/10023/14528
PROTEIN - CARBOHYDRATE
INTERACTIONS
Davina Noelle Moothoo
A thesis submitted for the degree of
Doctor of Philosophy
ProQuest Number: 10171019
All rights reserved INFORMATION TO ALL USERS
The quality of this reproduction is dependent upon the quality of the copy submitted. In the unlikely event that the author did not send a com plete manuscript and there are missing pages, these will be noted. Also, if material had to be removed,
a note will indicate the deletion.
uest
ProQuest 10171019
Published by ProQuest LLO (2017). Copyright of the Dissertation is held by the Author.
All rights reserved.
This work is protected against unauthorized copying under Title 17, United States C ode Microform Edition © ProQuest LLO.
ProQuest LLO.
789 East Eisenhower Parkway P.Q. Box 1346
Contents.
Contents 2
List of Figures 5
List of Tables _ 9
List of Abbreviations 12
Declaration 13
Abstract 15
Acknowledgements 16
Chapter 1 : Protein - Carbohydrate Interactions 17
1.1. Summary 18
1.2. Introduction 18
1.3. Energetics of protein - carbohydrate interactions 28 1.4. Hydrogen bonding and van der Waals interactions 32
1.5. Carbohydrate conformation 37
1.6. Monosaccharide binding site geometry and specificity 39
1.7. Oligosaccharide binding 49
1.8. Charged carbohydrate groups 56
1.9. Ligand multivalency 58
1.10. Concluding remarks 62
Chapter 2 : The 1.75Â structure of concanavalin A complexed with a l-2 63 mannobiose
2.1. Summary 64
2.2. Introduction 65
2.4. Analysis of the final model 75
2.5. Results and discussion 79
2.6. Conclusions 97
2.7. Future work 98
Chapter 3 : The 2.75Â structure of concanavalin A complexed with methyl al-2 99 mannobioside
3.1. Summary 100
3.2. Introduction 101
3.3. Experimental 103
3.4. Analysis of the final model 111
3.5. Results and discussion 114
3.6. Conclusions 128
3.7. Future work 128
Chapter 4 : The 2.7Â structure of concanavalin A complexed with a 129 pentasaccharide
4.1. Summary 130
4.2. Introduction 130
4.3. Experimental 133
4.4. Analysis of the final model 138
tt
4.5. Results and discussion 143 |
I
4.6. Conclusions 162
4.7. Future work 162
Chapter 5 : Crystal structures of concanavalin A complexed with fructose 164
5.2. Introduction 165
5.3. Experimental 167
5.4. Analysis of the final model 178
5.5. Results and discussion 184
5.6. Conclusions 198
5.7. Future work 199
Appendix 1 200
Bibliography 203
List of Figures.
1.1. The con A tetramer 20
1.2. The extended binding site of con A 21
1.3. Numbering scheme for mannose 22
1.4. Monosaccharides; Structures and abbreviations 23 1.5. Oligosaccharides; Structures and abbreviations 25 1.6. Enthalpy - entropy compensation plot for con A data 31
1.7. Cooperative hydrogen bond 33
1.8. Bidentate hydrogen bond 33
1.9. Conserved water molecule in an antibody fragment - trisaccharide complex 36
1.10. Group I binding 39
1.11. Group n binding 40
1.12. Extensive hydrogen bonding in the ABP - galactose complex 41 1.13. The D loop of the legume lectins 44 1.14. Binding of Man and Gal by the legume lectins 45 1.15. Monosaccharide binding by GNA 46
1.16. The binding site of WGA 47
1.24. Cross-linked bovine heart Gal-1 59 1.25. The two modes of binding of oligomannose binding by GNA 60 1.26. Cross-linked con A monomers 61
2.1. a l-2 mannobiose _ 66
2.2. Ramachandran plot for the 1.75Â a l -2 mannobiose - con A structure 77 2.3. Backbone temperature factor plot for the al-2 mannobiose - con A 78
structure
2.4. Fo-Fc omit map contoured at 2.8a 82 2.5. Hydrogen bond diagram of the a l-2 mannobiose - con A complex 85 2.6. Comparison of native and a l-2 mannobiose bound monosaccharide 89
binding sites
2.7. Comparison of the sugar positions in the al-2 mannobiose and 91 trimannoside bound concanavalin A structures
2.8. Displacement of water from the binding site 93 2.9. Differences in the monosaccharide binding site 95
3.1. Methyl a l-2 mannobioside 103
surfaces
4.2. Ramachandran plot for the final model of the con A - pentasaccharide 140 complex
4.3. Temperature factor plot along the backbone of each subunit 142 4.4. Packing of the two tetramers found in the asymmetric unit 143 4.5. Differences between the ABCD tetramer and the EFGH tetramer 145 4.6. Fo-Fc electron density seen in the binding site 147 4.7. Schematic representation of the hydrogen bonds between con A and the 150
pentasaccharide
4.8. Stereoview of the displacement of waters by the pentasaccharide 152 4.9. Stereoview of the pentasaccharide binding site superimposed onto the 155
native structure
4.10. Crystal packing in the native binding site 156 4.11. The con A - pentasaccharide complex 157 4.12. Prediction of the mode of binding of high mannose oligosaccharides 163
5.1. a-D-fructofuranose 166
5.2. Superposition of a-D-fructofuranose and methyl a-D-mannopyranoside 167 5.3. Section of one 0.8° oscillation of the C222i con A - fructose complex 173 5.4. Ramachandran plot for the final model of the P2i2i2i con A - fructose 179
complex
5.5. Temperature factor plots along the backbone of each subunit in the P2i2i2i 181 con A - fructose complex
5.6. Ramachandran plot of the final model of the €2221 con A - fructose 182
5.7. Temperature factor plots along the protein backbone for each subunit of the 184 C222i con A - fructose complex
5.8. Fo-Fc electron density contoured at 2a seen in the binding site of subunit A 187 5.9. Fo-Fc electron density_contoured at 2a seen in the binding site of subunit B 188 5.10. Fo-Fc electron density contoured at 2a seen in the binding site of subunit C 188
prior to inclusion of fructose
5.11. Fo-Fc electron density contoured at 2a seen in the binding site of subunit C 189 calculated after inclusion of a-D-fructose
5.12. 2Fo-Fc density of subunit C binding site 190 5.13 Comparison of bound fructose and bound mannose 192 5.14 Fo-Fc electron density seen in the binding site of subunit D 192 5.15. Organisation of the two dimers present in the asymmetric unit 194 5.16. Fo-Fc electron density contoured at 2a observed in the binding site of 196
subunit A
5.17. Fo-Fc electron density contoured at 2 a observed in the binding site of 197 subunit B
5.18. Fo-Fc electron density contoured at 2a observed in the binding site of 197 subunit C
List of Tables.
1.1. Protein structures discussed in Chapter 1 27 1.2. Thermodynamics of con A - carbohydrate binding 30 2.1. Thermodynamics for binding of mannobioses to con A 67 2.2. Quality of the 2.0Â a l-2 mannobiose data 70 2.3. Quality of the 1.75Â a - 12 mannobiose data 71 2.4. Progress of refinement of the 2.0Â a l-2 mannobiose - con A structure 73 2.5. Quality of the 2.0Â a l-2 mannobiose-con A structure 74 2.6. Quality of the 1.75Â a l-2 mannobiose - con A structure 76
2.7. Metal to ligand distances 81
2.8. Hydrogen bonds and polar contacts (<3.5Â) between a l-2 mannobiose and 83 con A
2.9. Van der Waals interactions (<4.0Â) between a l-2 mannobiose and con A 84 2.10. R.m.s. deviations for the C a superposition of con A complexes 87 2.11. Temperature factor ratios of the saccharide binding loops 92 3.1. Thermodynamics of con A binding mannobioses and their methylated 102
counterparts
3.2. Cell output from DENZO during the first 40 oscillations of data collection 105 3.3. Quality of data for the con A - methyl a l-2 mannobioside complex 106 3.4. Rotation and translation solutions 107 3.5. Progress of the refinement of the con A - methyl a l-2 mannobioside 110
complex
3.7. Final model statistics of the con A - methyl a l-2 mannobioside complex 112 3.8. Average temperature factors for each subunit 114 3.9. Metal to ligand distances and ligand temperature factors 116 3.10. Hydrogen bonding distances between methyl a l-2 mannobioside and con 119
A
3.11. Van der Waals interactions between methyl a l-2 mannobioside and con A 120 3.12. Dihedral angles around the inter-sugar glycosidic linkage of the 121
mannobiose sugars
4.1. Thermodynamic data for con A binding to oligosaccharides at the core of 132 the V-linked glycan
4.2. Data quality for the 2,1 k complex of the pentasaccharide - con A complex 134 4.3. NCS restraints used in positional and temperature factor refinement 136 4.4. Progress of refinement of the con A - pentasaccharide complex 137 4.5. Final model statistics of the 2.1 k con A pentasaccharide complex 139 4.6. Average temperature factors for each subunit in the con A - 141
pentasaccharide complex
4.7. Metal to ligand distances and temperature factors in the con A - 146 pentasaccharide complex
4.8. Hydrogen bonding and polar contact distances between con A and the 148 pentasaccharide
4.9. Van der Waals contacts between con A and the pentasaccharide 149 4.10. Average temperature factor of the binding loops in the con A - 151
pentasaccharide complex
4.12. Differences amongst the con A complexes in the contacts at the 158 carbohydrate binding site
5.1. Data quality for the P2,2i2i fructose - con A complex 168 5.2. Rotation and translation solutions for the P2i2i2i crystal form 169 5.3. Progress of refinement of the P2i2i2; con A - fructose complex 171 5.4. NCS restraints used in positional and temperature factor refinement 172 5.5. Quality of the C222i con A - fructose structure 174 5.6. Rotation and translation solutions for the C222i crystal form 175 5.7. Progress of refinement of the C222i con A - fructose complex 177 5.8. NCS restraints used in positional and temperature factor refinement 178 5.9. Quality of the final model of the P2i2i2i con A - fructose complex 180 5.10. Temperature factors for each subunit of the P2i2i2i fructose - con A 181
complex
5.11. Statistics on the final model of the C222; fructose - con A complex 183 5.12. Temperature factors for each subunit of the C222i fructose - con A 183
complex
5.13. Metal to ligand distances and temperature factors in the P2i2i2i con A 186 complex
5.14. Hydrogen bonds and polar contacts (<3.5Â) between fructose and con A 190 5.15. Van der Waals interactions (<4.0Â) between fructose and con A 191 5.16. Metal to ligand distances and temperature factors in the C222i fructose - 195
con A complex
List of abbreviations.
PDB Protein Data Bank
Ka Association constant
NMR Nuclear Magnetic Resonance
PEG Polyethylene Glycol
r.m.s. root mean square
C a alpha carbon of amino acid
con A concanavalin A
Declaration.
I, Davina Moothoo, hereby certify that this thesis, which is approximately 35,000 words in length, has been written by me, that it is the record of work carried out by me and that it has not been submitted in any previous application for a higher degree.
Date Signature of candidate
I was admitted as a research student in September 1995 and as a candidate for the degree of Ph.D. in September 1996; the higher study for which this is a record was carried out in the University of St. Andrews between 1995 and 1998 .
Date TJo S . U Signature of candidate
I hereby certify that the candidate has fulfilled the conditions of the Resolution and Regulations appropriate for the degree of Ph.D. in the University of St. Andrews and that the candidate is qualified to submit this thesis in application for that de
In submitting this thesis to the University of St. Andrews I understand that I am giving permission for it to be made available for use in accordance with the regulations of the University Library for the time being in force, subject to any copyright vested in the work not being affected thereby. I also understand that the title and abstract will be published, and that a copy of the work may be made and supplied to any bona fide library or research worker.
Abstract.
Carbohydrates are ubiquitous in nature and have become the focus of much scientific investigation. The proteins which recognise carbohydrates have become widely used in the areas of cell and molecular biology. Protein - carbohydrate interactions have been probed by theoretical, structural and thermodynamic techniques. The lectins are a class of carbohydrate binding proteins which bind carbohydrates through non covalent interactions such as hydrogen bonds and van der Waals interactions. In addition to these interactions, other factors play an important role in determining affinity such as carbohydrate conformation, solvent reorganisation and changes in the protein binding site.
Acknowledgements.
Firstly, thanks go to my supervisor Jim Naismith for his constant enthusiasm and encouragement over the past three years, and for helping me to achieve my goals. Thanks also go to Steve Homans, JTrevor Rutherford, Charlie Weller and Tony Chiovotti for useful discussions. A special thanks goes to everyone in the Naismith group, especially Stephen for making the lab a good place to work.
Thanks are not enough for my parents, they are truly amazing.
Chapter 1
1.1. Summary
Carbohydrates are ubiquitous in biological systems. A sophisticated array of these molecules are found on cell surfaces and they are recognised with varying degrees of specificities by carbohydrate binding proteins such as lectins, anti-carbohydrate antibodies, bacterial periplasmic binding proteins and some enzymes. The interactions between proteins and carbohydrates are attractive therapeutic targets. However, the ubiquity of carbohydrates presents a huge challenge for rational design of therapeutics. The physical basis of protein - carbohydrate interactions is still too poorly understood to permit such design. Improving our understanding needs an atomic level understanding of the recognition of a carbohydrate by a protein. In recent years. X-ray crystallography together with isothermal titration microcalorimetry has begun to provide a powerful insight into the molecular processes governing protein - carbohydrate interactions. This chapter will summarise the current information available from X-ray structures and thermodynamics studies, identifying common features of protein - carbohydrate interactions.
Concanavalin A from the Jack bean {Canavalia enisformis\ is the most well studied lectin. It was the first of the lectins to have its three dimensional structure solved by X- ray crystallography, the first to have a carbohydrate bound structure solved and the first lectin to be solved to atomic resolution. The thermodynamics of its binding to both natural and modified carbohydrates have been extensively analysed and are discussed.
1.2. Introduction.
Figure 1.1. The con A tetramer. Bound methyl a-D-mannopyranoside is shown as ball
and stick representation, the metal ions are shown as red spheres (Naismith et ai, 1994).
[image:23.613.58.495.96.468.2]molecule was identified which plays an important role in anchoring the reducing Man to the protein. A second report of the con A trimannoside complex found that in one of the four subunits the trimannoside adopts a different conformation, although it is unclear whether or not this is an artefact of crystallisation (Loris et al., 1996).
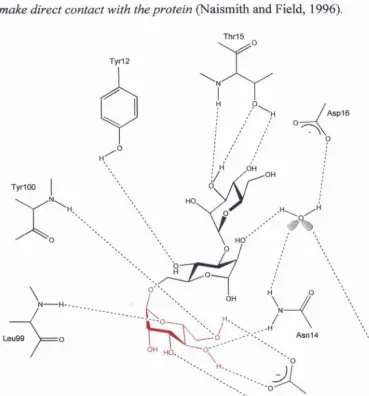
Figure 1.2. The extended binding site o f con A. The 1-6 arm terminal mannose residue is
bound at the monosaccharide binding site (shown in red). All three mannose residues
make direct contact with the protein (Naismith and Field, 1996).
Thr15 Tyr12
TyrlOO
N H --..
Leu99
Asp 16
A sn14
. Asp208
HjN NH2
,NH
Arg228
[image:24.613.87.456.256.651.2]periplasmic binding proteins and antibodies directed against carbohydrates. Isothermal titration microcalorimetry has enabled the direct measurement of the association constant Ka and the stoichiometry of binding interactions. Changes in free energy, specific heat capacities entropy can then be derived (Toone, 1994).
Figure 1.3 shows an example of the numbering scheme for carbohydrates, Figures 1.4 and 1.5 illustrate the carbohydrates discussed in this chapter. Table 1.1 lists the protein - carbohydrate structures discussed in this chapter, their PDB accession codes and their abbreviations used.
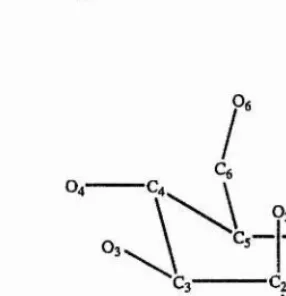
Figure 1.3. Numbering scheme for mannose. The dotted bonds show the N-Acetyl group
in GlcNAc.
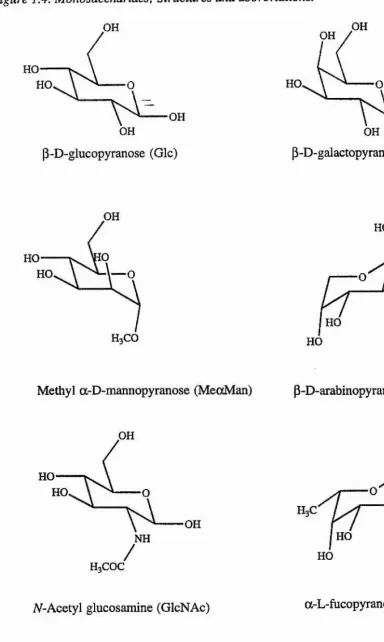
[image:25.614.223.366.334.482.2]Figure 1.4. Monosaccharides: Structures and abbreviations. OH OH OH HO HO HO,
\ ^ OH OH
P-D-galactopyranose (Gal)
\ ^ OH OH
p-D-glucopyranose (GIc)
OH
HO
HO
HO 1— O OH
HO HO
p-D-arabinopyranose (Ara) Methyl a-D-mannopyranose (MeocMan)
OH HO HO OH HO OH HO NH HO
Figure I A. Continued.
HO
OH
HOQi
QH
N-Acetyl neuraminic acid (NeuNAc) abequose (Abe)
OH
HO
OH NH
COOH
H3COC
Figure 1.5. Oligosaccharides; Structures and abbreviations.
a)
Gal pi-3GaINAc
b)
Gal pi-4G lc
c)
Gal pl-4GlcNAc
T-antigenic disaccharide
Lactose (Lac)
N-acetyl lactosamine (LacNAc)
d)
GlcNAc P1,4 GlcNAc P1,2 Man a 1, 6
1,6 arm
GlcNAc p i,4 GlcNAc p i,2 Man a 1,3
1,3 arm
Man pi,4 GlcNAc pi,4 GlcNAc p Asn
F u ca l- 6
e)
Gal a 1-2Abe al-3M an
Biantennary Glycan. In red is the trimannoside core, boxed is the pentasaccharide core.
Salmonella O-antigen trisaccharide
f)
Fuc al-2G al pi-4(Fuc al-4)G lcN A c Lewis b antigen
g)
Man a l,2 Man a l, 6
Man a 1,6
\
Man a l , 2 Man a 1,3/
Man a l,2 Man a l,2 Man a 1,3h)
NeuAc a2,3Gal P3
NeuAc a2,6''
GalNAc-Thr
Branched high mannose oligosaccharide. In red is the branched pentamannose.
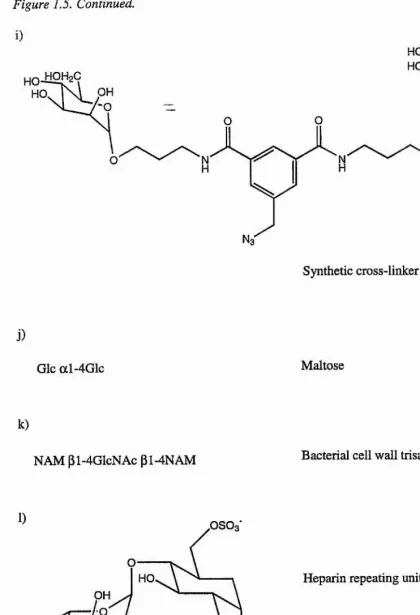
Figure 1.5. Continued.
i)
O
9
HO, HO
OH
:
Synthetic cross-linker
j)
Glc al-4G lc Maltose
k)
NAM pl-4GIcNAc pi-4NAM Bacterial cell wall trisaccharide
1) OSO3*
'000
OSO3 OH
iduronate-2-sulfate
O3SO
Heparin repeating unit
Table 1.1. Protein structures discussed in Chapter 1.
Protein abbreviation Ligand PDB code
Concanavaiin A con A MeotMan SCAN
Concanavalin A con A core trimannoside ICVN/ IONA
Concanavaiin A con A none lAPN
(demetallised)
Erythrina corallodendron Ecor L Gal lAXZ
Erythrina corallodendron Ecor L Lac ILTE/ lAXl
Erythrina corallodendron Ecor L LacNAc 1AX2 Mannose binding protein- A MBP-A branched oligomannose 2MSB Wheat germ agglutinin WGA sialyl lactose IWGC Wheat germ agglutinin WGA sialyl glycopeptide 2CWG
Lathyrus ochrus isolectin I LOLI MeotMan ILOB
Lathyrus ochrus isolectin I LOLI linear trisaccharide ILOG
Lathyrus ochrus isolectin I LOLI biantennary ILOF octasaccharide
Lathyrus ochrus isolectin II L O L n biantennary ILGC glycopeptide
Winged bean agglutinin WBA Gal IWBL
Galanthus nivalis GNA pentamannose IMSA Soybean agglutinin SBA biantennary glycan ISBA peanut lectin PNA T-antigenic disaccharide ITEP
Jacalin Jacalin MeaGal IJAC
Griffonia simplicifolia GS4 Lewisb ILED
Galectin 1 Gal-1 biantennary ISLB, ISLC, octasaccharide ISLT
Galectin 2 Gal-2 Lac IHLC
L-arabinose binding protein ABP Gal 5ABP Glc/ Gal binding protein GGBP Gal IGLG
Glc 2GBP
Staphylococcus aureus ET Lac 1SE3
Table 1.1. (Continued).
Protein abbreviation Ligand PDB code
Bordetella pertussis PT sialyl galactose IPTO Polyoma virus none sialyl lactose ISID acidic fibroblast growth “ aFGF Heparin octasaccharide 2AXM factor
Se 155-4 antibody fragment Sel55-4 Salmonella O-antigen IMFD Lysozyme Lysozyme bacterial cell wall 9LYS
trisaccharide
Lysozyme Lysozyme T ri-N-Acetyl-Chitotriose ILZB Glycogen phosphorylase GP maltoheptaose 6GPB
This chapter discusses protein - carbohydrate interactions with reference to the common themes in energetics that have emerged over the past few years.
1.3. Energetics of protein - carbohydrate interactions.
Prior to isothermal titration microcalorimetry, the principal method for investigating protein - carbohydrate interactions was inhibition of hemagglutination or oligosaccharide precipitation (Sharon and Lis, 1989). These methods were useful in identifying specificity but they did not measure thermodynamic data. These techniques measure Kj which can be dominated by kinetic parameters. Direct measurement of thermodynamic data is now possible by isothermal titration calorimetry. Contributions to the overall free energy by each hydroxyl can be estimated by utilising saccharide analogues such as methoxy, fluorodeoxy and deoxy derivatives (Quiocho, 1993; Schwarz et al., 1996, Brewer et al.,
1997). These are discussed more fully in section 1.4.
monosaccharide. This is seen for many of the carbohydrate complexes of con A (Chervenak et a i, 1992; Mandai et al., 1994b), the Erythrina corallodendron lectin (Ecor L) (Gupta et a l, 1996; Surolia et a l, 1996), mannose binding protein C (MBP-C) (Quesenberry et a l, 1997) and wheat germ agglutinin (WGA) (Bains et a l, 1992). The data shows that almost all lectin - carbohydrate interactions are entropically unfavourable in water (Chervenak and Toone, 1994). Calorimetric studies have shown that in general, a significant proportion of the enthalpy arises from solvent reorganisation (Chervenak and Toone, 1994) (the transfer of solvent molecules between the bulk of the solvent and the solvation shell of the protein and ligand). This was shown experimentally by evaluating the thermodynamics of several binding systems in H2O and D2O (Chervenak
and Toone, 1994).
from raw data is problematic. The results of Mandai and co-workers (Mandai et a i,
1994b) are quoted in Table 1.2 as it encompasses all of the oligosaccharides used throughout this thesis. However, it should be noted that the results of the other investigations are very different. The con A studies can be used to illustrate entropy - enthalpy compensation. A plot of enthalpy versus entropy for the con A complexes is shown in Figure 1.6.
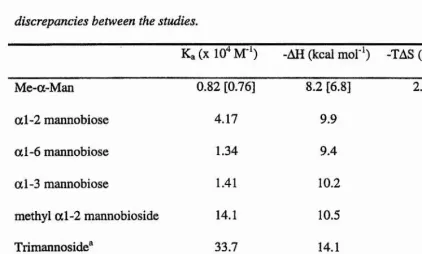
Table 1.2. Thermodynamics o f con A - carbohydrate binding. (Mandai et al., 1994b).
Enclosed in [] are shown values from (Chervenak and Toone, 1995) to illustrate the
discrepancies between the studies.
Ka(X 10^ M**) -AH (kcal mol'*) -TAS (kcal mol**) Me-a-Man 0.82 [0.76] 8.2 [6.8] 2.9 [1.5]
a l-2 mannobiose 4.17 9.9 3.6
a 1-6 mannobiose 1.34 9.4 3.8
a 1-3 mannobiose 1.41 10.2 4.5
methyl a l-2 mannobioside 14.1 10.5 3.5
Trimannoside^ 33.7 14.1 6.6
biantennary 140 10.6 2.2
pentasaccharide*^
“ Trimannoside core of the biantennary glycan shown in red in Figure 1.4.d ‘’Pentasaccharide core (boxed)
[image:33.615.76.499.307.561.2]Figure 1.6. Enthalpy - Entropy compensation plot for con A data.
^ -AH
The interactions between lectins and monosaccharides are relatively weak and non specific. Affinities and specificities increase for cognate oligosaccharides. Thus multiple protein - carbohydrate interactions co-operate to give high specificity and affinity.
characterised by a favourable entropie contribution (Sigurskjold and Bundle, 1992) which has been interpreted in terms of a dominant role of the hydrophobic effect in carbohydrate binding. The favourable entropie contribution is explained by the expulsion of water from the binding site and complete exclusion of the ligand from bulk solvent. Favourable entropies have been seen for the group II proteins, the ScFv antibody - O-antigen trisaccharide complex (Cygler et al., 1991) and the snowdrop lectin (GNA). Antibody recognition falls between Group I and Group B as a single Abe sugar is almost completely enveloped. GNA recognises oligomannosides with much weaker affinity than the legume lectins (in fact the monosaccharide binding falls below the range of sensitivity for calorimetry (Shibuya et al., 1988; Kaku and Goldstein, 1992)). The tightest GNA complex is with the trimannoside (Ka = 3.0 x 10³ M-1), some 100 times weaker than seen for con A. The only other oligosaccharides for which binding to GNA is detectable by calorimetry are the a l-6 and a l-3 mannobioses. The trimannoside, and the a l-3 and a l-6 mannobioses all bind GNA with a positive entropie contribution. However, as this binding is weak, GNA may be a special case.
1.4. Hydrogen bonding and van der Waals interactions.
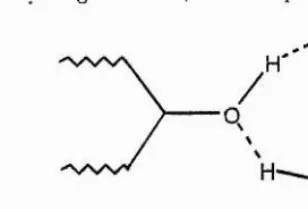
Figure 1.7. Cooperative hydrogen bond (A is acceptor, D is donor).
[image:36.614.215.369.83.187.2]When two adjacent hydroxyl groups interact with different atoms of the same amino acid, a bidentate hydrogen bond is formed (Figure 1.8). This is common in protein - carbohydrate complexes. An example of this is in the mannose binding legume lectins, where the 4- and 6- hydroxyls form a bidentate hydrogen bond with an aspartic acid. Other bidentate ligands are glutamic acid, glutamine, asparagine and arginine.
Figure 1.8. Bidentate hydrogen bond.
p H ...__
\
OHO
OH
A bidentate hydrogen bond is more stable than two monodentate interactions. The chelating interaction is more stable as two hydrogen bonds are formed whilst only one side chain is immobilised. The entropie penalty is therefore much less. This is the chelate effect and is well known in biology (Page and Jencks, 1971).
presumably allows optimisation of hydrogen bonds with the protein with some entropie cost due to fixing the rotamer. The ring oxygen of the sugar is sp^ hybridised, with the two bound carbons and the lone pairs of electrons of the ring oxygen arranged tetrahedrally allowing it to act as an acceptor of hydrogen bonds.
Chemically designed ligands have been used to assess the contribution made by individual hydrogen bonds (Withers et al., 1986; Bhattacharyya and Brewer, 1988; Quiocho, 1993). By using deoxy- and fluorodeoxy- saccharides, estimates for the strength of a hydrogen bond ranged from 0.5 to 3kcaJ mol"’. The experiments are useful for determining which hydroxyl group on the ligand is involved in hydrogen bonding. However, the strength of an individual hydrogen bond remains ambiguous as the elimination of a hydroxyl group also abolishes van der Waals interactions, and there are differences in the free energies of solvation between the neutral and analogue ligands. Thus these compounds have not accurately measured hydrogen bonding energies as pointed out by Quiocho and co-workers. In their studies of deoxy- and fluorodeoxy- analogues of galactose binding to ABP, they highlight the neglect of the contribution of van der Waals interactions in complex formation, and found that the compounds proved to be inadequate probes due to the binding of new water molecules and structural changes arising from the electronegative fluoro- group (Vermersch et al., 1992).
monosaccharide binding site. The two remaining sugars contact the protein only through long chains of water molecules. A total of 20 water molecules are involved in the binding of the trisaccharide to the protein, the majority of which are not found in a similar position in the native structure. Interestingly, in the structure of peanut lectin (PNA) complexed with the T-antigen disaccharide (Figure 1.5.a) (Ravishankar et al., 1997), PNA binds the disaccharide with a 20 fold higher affinity than with lactose (Figure
1.5.b), although the structure showed that overall there are no additional direct interactions with the protein. The A-acetyl group of the T-antigenic disaccharide makes water mediated contact with the protein. This is the only example so far where the increase in affinity seems to be due entirely to water mediated protein-carbohydrate interactions.
Figure 1.9. Conserved water molecule in an antibody fragment - trisaccharide complex. H and L refer to the heavy and light chains respectively (Cygler et al., 1991).
•N His32L
Trp91L N
OH
Rha-Gly98H N H CH2OH
HO, Rha
H— N His97H
Trp95L N H'
N HÎS35H
Gly96H Tyr99H
The hydrophobic face of the saccharide, for example in mannose - the face of the sugar with the 2- and 6- hydroxyls, commonly interacts with the partial negative charge on the
7i-electrons of the aromatic ring in a stacking arrangement. This stacking arrangement has
[image:39.614.152.431.107.471.2]1.5. Carbohydrate conformation
It has been demonstrated by theoretical models and NMR calculations that oligosaccharides are relatively flexible molecules, and in solution exist in a number of low energy conformations (Homans, 1995). When a carbohydrate binds to a protein, most of the rotatable bonds of the carbohydrate are frozen, creating an entropy penalty to binding.
Carbohydrate conformation has been found in some cases, to have a global effect on organisation of molecules in the crystallisation process. For example, in the cross-linked arrays of galectin-1 (Gal-1) dimers, the three different crystal forms are brought about by different low energy conformations of the cross-linking oligosaccharide, for example in the triclinic crystal form the oligosaccharides are bent (Bourne et al., 1994) (discussed in section 1.9). Most carbohydrates do appear to be bound in one of the conformational energetic minima, thus no additional entropy penalty is paid.
more ordered water molecules around the trisaccharide in the scFv structure and the authors suggest that reordering of water molecules near the galactose could have triggered the rotation observed.
In the case of LOL H, which requires a fucose moiety for high affinity binding of the biantennary glycan (Figure 1.5.d) different carbohydrate conformations are observed in structures of the protein bound to the glycan with and without the fucose (Bourne et al.,
1.6. Monosaccharide binding site geometry and specificity.
Members of group I binding proteins, such as the bacterial periplasmic binding proteins, undergo a large conformational change upon binding that buries the entire saccharide from solvent (Figure 1.10)
Figure 1.10. Group I binding. Arabinose binding protein complexed with Galactose
In contrast, the binding sites of group II proteins seem to be preformed undergoing no substantial main chain conformational changes upon binding, and only one or two edges of the carbohydrate ligand generally bind to the protein. A significant proportion of the sugar is exposed to solvent. This iss illustrated in the lectin crystal structures, one example being con A which is shown in Figure 1.11.
Figure 1.11. Group II binding. Concanavaiin A complexed with MeaMan (Naismith et al., 1994).
bonds compared with 6 made between con A and methyl a-D-mannopyranoside (Figure 1.12). Noticeably, there are two bidentate hydrogen bonds and one bidentate water mediated bond.
Figure 1.12. Extensive hydrogen bonding in the ABP - galactose complex (Quiocho, 1993).
Arg 151
Asn 232
Asn 205 Asp 89
Asp 90
Se 155-4 (Zdanov et a i, 1994), every hydroxyl group of the sugar is observed to make hydrogen bonds with the protein with the exception of the 6- hydroxyls on the galactose and mannose (Figure 1.9).
Legume lectins are highly conserved (Sharon and Lis, 1990) and irrespective of their specificity bind ligands through the side chains of an aspartic acid, an asparagine and an aromatic amino acid or a leucine. A single bidentate hydrogen bond is conserved in the monosaccharide binding site of the mannose and galactose specific legume lectins. The aspartic acid and asparagine, as well as interacting with the ligand also coordinate with a Ca^^ ion. The legume lectins also all have a non-proline cis peptide between the conserved asparagine and the preceding amino acid, which is typically an alanine. The
cis peptide is necessary for the correct orientation of the asparagine. In the absence of the metals ions this peptide linkage is in the normal trans conformation (Bouckaert et a l,
This loop is the same length in all mannose/ glucose specific lectins and is two or more residues longer in almost all galactose specific lectins (Figure 1.13). It confers specificity between the mannose/ glucose and galactose specific lectins. In the galactose specific lectins, the extended D loop interacts with the axial 4- OH of galactose, but not an equatorial 4- OH. The shorter loop in the mannose specific lectins would clash with an axial 4- OH.
Figure 1.13. The D Loop o f the legume lectins. Superposition o f ECor L and con A
binding sites (Shaanan et al., 1991).
Figure 1.14. Binding o f Man and Gal by the legume lectins. The con A monosaccharide
binding site is shown on the left, and that o f Ecor L on the right (Shaanan et al., 1991; Naismith et al., 1994).
Asn 14 Asn133
NH
I
H
^NH
O - , .
Asp208
■'H-Arg228
1
1
Asp89 f->
\(
V-
0--\
---OH OH Gly107 H TyrlOO/
M\
H / V Leu99 Ala218/
\
H HN/ Gln219
The C-types lectins belong to a different family, however similar to the legume lectins they can be grouped into those which are specific for galactose and those which are specific for mannose. Two glutamic acid residues and two asparagine residues coordinate the Ca^^ ion in all of the C-type lectins. However, in the galactose specific C-type lectins, one glutamic acid is replaced by a glutamine and one asparagine by an aspartic acid. In both cases, the 4- and 3- hydroxyls coordinate the bound calcium. Mutation of Glu-185 and Asn-187 in MPB-A gave a mutant specific for galactose (Drickamer, 1992).
which recognise the monosaccharide principally via the 3-, 4- and 6- hydroxyls, the bulb lectins specifically recognise the axial 2- hydroxyl (Hester and Wright, 1996), thus differentiating glucose from mannose. The binding is like that seen for the legume lectins in that the saccharide makes contacts with an aspartic acid and an asparagine (Figure 1.15). However, the interactions are less extensive, for example there are no bidentate interactions, and no stacking interactions with aromatic residues which would explain why the binding is so much weaker - monosaccharide binding by GNA falls below the range of sensitivity for calorimetry and it binds the trimannoside core of the A-linked glycan (Figure 1.5.d) with a Ka of 3.0 x 10^ M'% some 100 times weaker than measured for con A (Chervenak and Toone, 1995).
Figure 1.15. Monosaccharide binding by GNA. A bound water molecule is shown as a
red sphere.
Tyr 97
Gin 89
Asp 91 M
In some proteins, residues from different subunits form the binding sites. WGA contains four binding sites per monomer, in only two of which is binding detected by calorimetry (Wright and Kellog, 1996). This is due to variability between the binding sites as the residues which form each binding site originate from different subunits (Figure 1.15). The similarities between the binding sites lie in three tyrosine residues and a serine from one subunit while variability between the binding sites is seen in interaction involving residues from the other subunit (Wright, 1990; Nagahora et al., 1995).
Figure 1.16. The binding site o f WGA. The residues forming the binding site originate
from different monomers.
[image:50.614.126.448.303.589.2]substantially enclosed by the protein, burying 80% of the surface accessible area of the sugar compared with 75% of MeaMan buried by con A (Figure 1.17).
Figure 1.17. Monosaccharide binding site o f jacalin.
A sp -125
Trp-123
T y r-122
Modelling glucose and mannose into the jacalin binding site (equatorial 4- hydroxyl) revealed that although Asp-125 can still hydrogen bond the 4- hydroxyl, Gly-1 cannot, thus demonstrating that the specificity of Jacalin for galactose over glucose and mannose is chiefly determined by the terminal amino group.
ion. In this way the ion fixes side chains for optimal carbohydrate binding. The Mn^^ ion holds the Ca^^ ion in place (Figure 1.18).
In the C-type lectins, the Ca^^ ion ligates directly with the carbohydrate. Two lone pairs of electrons each from adjacent carbohydrate hydroxyls coordinate the Ca^^ ion in a bidentate fashion. These hydroxyls accept a hydrogen bond from side-chain amide groups (Figure 1.18). The only other direct sugar - metal interaction known is xylose isomerase in which the sugar ligates two Mg^^ ions (Allen et al., 1994; Lavie et al., 1994).
Figure 1.18. Involvement o f metals in carbohydrate binding. On the left is the indirect
role played by con A and on the right is the direct role played by MBP-A (Naismith et al.,
1994; Allen et al., 1994).
f X
Am
j A s n 14
(
— 185
1.7. Oligosaccharide binding.
In many cases, enhancements in affinity and specificity are observed for oligosaccharides relative to monosaccharides. This has been visualised extensively in the lectins, for which there are many crystal structures of oligosaccharide bound complexes.
Figure 1.19. LOL II complexed with a fucosylated biantennary glycan (Boume et al.,
1990).
fucose
monosaccharide bmdmg site
[image:54.612.98.465.112.397.2]bidentate ligand upon disaccharide binding. These factors explain the 6-foid increase in binding affinity for the galectins in binding LacNAc over galactose.
Figure 1.20. The GS4 - Lewis b binding site. The galactose residue sits in the monosaccharide binding site and forms hydrogen bonds with the protein with its 3- and
4- hydroxyls. Due to the truncated D loop, 2 hydrogen bonds, 1 from the 3- hydroxyl and
1 from the 6- hydroxyl are lost compared with monosaccharide binding by EcorL
(Delbaere et al., 1993).
Trp—138
A sp -137
/ Asn-135 Gly-107
Tyr-105
GlcNAc
Gly-222
Ser-49
A rg-48
[image:56.612.119.452.189.598.2]4-OH of the galactose. A conserved tryptophan stacks against the face of the saccharide and the 6- OH is also hydrogen bonded with the protein (Lobsanov et ai, 1993). Structures of Gal-1 with branched oligosaccharides containing LacNAc at the non-reducing end of the branches (Boume et a l, 1994) leads to cross-linked arrays which are discussed in section 1.9.
Extended binding sites have been seen in several enzyme - substrate complexes. One very well studied example is lysozyme (Cheetham et a l, 1992). Enzyme - carbohydrate recognition is characterised by similar features to those described for other protein - carbohydrate interactions in this chapter, stacking interactions between an aromatic ring and the carbohydrate, hydrogen bonding and participation of water molecules. In the structure of the lysozyme - tri-A^-Acetylchitotriose ((GlcNAc)3) complex (Cheetham et
al., 1992), all three residues of the carbohydrate make hydrogen bonds with the active site. One GlcNAc residue is buried in a 6Â deep pocket and makes 4 hydrogen bonds and 25 van der Waals interactions. In addition this GlcNAc forms hydrogen bonds with 2 conserved water molecules. The remaining 2 GlcNAcs of the trisaccharide lie on the surface of the protein, each making a hydrogen bond with the protein via their 6- hydroxyls, and a total of 18 van der Waals interactions. In the stracture of lysozyme complexed with the bacterial cell wall trisaccharide (Strynadka and James, 1991) (Figure
1.5.k) again all three sugar residues form hydrogen bonds with the protein. Interestingly, in this structure, one of the N-acetyl muramic acid (NAM) residues adopts a conformation which is distorted from the expected chair conformation. The C-2, C-1, 0-5, C-5 and C-4 atoms are approximately coplanar. The result is that the CH2OH group
Figure 1.21. Distortion of a sugar ring by lysozyme; schematic representation of the
NAM sugar in the lysozyme - bacterial cell wall trisaccharide complex. On top is the expected ^Ci chair conformation. Below is the more planar sofa conformation seen in the
complex (Cheetham et al., 1992).
MO.
on
OH
HO
OR
OM
[image:58.612.203.389.183.417.2]Figure 1.22. The extended oligosaccharide binding site o f glycogen phosphorylase
(Johnson et al., 1990).
Glu-405
Tyr-404
Gln-408 Lys-437
Asn-407
Glu-433
V
al-1.8. Charged carbohydrate groups.
[image:59.614.89.461.102.470.2]1992; Crennell et a l, 1994). And in the structure of polyoma virus complexed with sialyllactose, the NeuNAc carboxylate interacts with an asparagine side chain (Stehle et al., 1994). Based on this structure and modelling, it was suggested that the inability of one particular polyoma strain to bind branched ligands containing both a2-3 and a2-6 linked NeuNAc is due to charge repulsion by a glutamic acid at a putative second site. Charge repulsion has been seen in WGA structures where GlcNAc and NeuNAc both bind in the primary binding site but only GlcNAc binds in the secondary binding site. Acidic residues near the secondary site are thought to cause this and is consistent with the observation that the neutral methyl ester of NeuNAc will bind at the secondary site (Wright, 1984). In the case of the selectins, sialic acid is required for binding.
Charged carbohydrate moieties have been seen in legume lectin - carbohydrate complexes; a structure of LOL I complexed with muramic acid (Figure 1.4) showed that the acid moiety is solvent exposed and interacts with the protein only through water molecules (Bourne et a l, 1994).
interface, instead the monomers are bridged by heparin. The monomers bind sulfate groups of 5 or 6 monosaccharide units on opposite sides of the heparin helix axis. Most of the contacts are ionic contacts between basic residues such as lysine and the sulfate and carboxylate groups of heparin.
Figure 1.23. The heparin linked dimer o f aFGF (DiGabriele et al., 1998).
1.9. Ligand Multivalency.
(Boume et al., 1994). For each of the oligosaccharide complexes (an octasaccharide, an asparaginyl-nonasaccharide, both branched and containing LacNAc at the non-reducing end of the branches) three crystal forms are obtained - hexagonal, trigonal and triclinic. The structures are infinite chains of lectin dimers cross-linked through the LacNAc moieties (Figure 1.24).
Figure 1.24. Cross-linked bovine heart Gal-1. The dimers are cross-linked by a
biantennary octasaccharide, the arrangement shown is found in the hexagonal crystal
[image:62.613.227.358.287.704.2]The monosaccharide binding site of the bulb lectins is made up from 3-fold internal repeats within the monomer; GNA is a tetrameric dodecavalent molecule. Each monomer contains 3 carbohydrate recognition domains; CRDl, CRD2 and CRD 3. In the structure of GNA complexed with a branched pentamannose (Figure l.S.g) (Wright and Hester, 1996) two modes of binding are observed. At CRDl, the highest affinity monosaccharide binding site, the pentamannose cross-links GNA dimers. At CRD3, the outer arm interacts with a single subunit with three of the mannose residues contacting the protein. These binding modes are illustrated in Figure 1.24. None of the legume lectins have yet been complexed with this sugar, but one would expect to see a similar cross linking effect.
Figure 1.25. The two modes o f oligomannose binding by GNA (Wright and Hester, 1996).
CRD3
CRD2
This kind of multivalency is also seen for WGA which has multiple binding sites due to the 4- fold internal repeats. The binding sites in this case are located at the interface between the subunits which form the molecular dimer. There are eight sites per dimer, four of which are unique. In the complex of WGA with a sialylglycopeptide (Wright, 1992) (Figure 1.5.h) the carbohydrate binds to the protein so that the a2-6 linked sugar occupies the binding site in one domain of one dimer and the a2-3 linked sugar binds a different domain of a crystallographically related dimer.
The first structure of a lectin with a synthetic polyvalent ligand has recently been reported (Moothoo and Naismith, 1998b; Dimick et al., 1998). The ligand is a bidentate ligand (Figure 1.5.i) which cross-links con A monomers (Figure 1.25) leading to an infinite cross-linked array of con A molecules.
Figure 1.26. Cross linked con A monomers.
two binding sites per subunit, one for Man, the other for both Man and GlcNAc, and that MBP-A has only one binding site per subunit.
1.10. Concluding remarks. _
Chapter 2
The 1.75Â structure of concanavalin A complexed with
2.1. Summary
The three-dimensional structure of the complex between a l-2 mannobiose and concanavalin A has been determined to 1.75Â resolution. Diffraction data were first recorded from a single crystal to a resolution of 2.0Â. The structure was determined by molecular replacement and refined to 2.0Â. Subsequently, further data were collected from a second crystal which diffracted to a resolution of 1.75Â. The final model, refined to 1.75Â has good geometry, an R factor of 18.5% for 27201 reflections and a free R factor of 21.8%. The asymmetric unit contains one monomer which binds one disaccharide molecule via hydrogen bonds and van der Waals interactions. The non reducing terminal mannose is recognised at the so called monosaccharide binding site. The reducing terminal mannose is bound by residues Tyr-12, Asp-16 and Arg-228 and a single water molecule which interacts with the protein. The interactions for this sugar ring are less extensive than observed for the reducing sugar in the trimannose bound and pentasaccharide bound complexes, but are more than predicted by molecular modelling studies. However, buried surface area analysis shows that the reducing sugar of a l-2 mannobiose buries more apolar surface accessible area than the reducing sugar of a l-6 mannobiose. This observation and the relative rigidity of a l-2 mannobiose may explain its high affinity for con A.
2.2. Introduction.
Figure 2.1. al-2 mannobiose. The inter-sugar glycosidic torsion angles are defined as: (p
= 05-C1-0X-CX, ij/ - Cl-OX-CX-C(X+l), cû - C4-C5-C6-06 and are shown in red.
0 4 - ^ ^ Ce
\ l Cl c
Ce O2 \j/
Oi
Further biophysical techniques have been employed to addiess the binding behaviour of con A, such as the solvent proton nuclear magnetic relaxation dispersion teclmique, near ultraviolet circular dichioism and rapid flow kinetic analysis using fluorescent labelled ligands (Goldstein, 1975; Reddy and Rao, 1992; Mandai et al., 1994; Mandai et al.,
Table 2.L Thermodynamic data for binding of mannobioses to con A
Ka (X 10"* M"^) -AH (kcal mol*^) -TAS (kcal mol‘‘)
Me-a-Man 0.82 8.2 2.9
a l-2 mannobiose 4.17 _ 9.9 3.6 a l-6 mannobiose 1.34 9.4 3.8 a l-3 mannobiose 1.41 10.2 4.5
Table 2.1 shows thermodynamic data for con A binding to al-3 , al-6 and al-2 mannobiose (Mandai et al., 1994). Another study also investigated thermodynamics of con A binding (Chervenak and Toone, 1995). Although the relative magnitudes of the binding constants and enthalpies of binding are in agreement between the two studies, the enthalpies of the work by Chervenak and co-workers are uniformly smaller. Discrepancies between calorimetry experiments are due to the dependence of the results on pH, ligand concentration and temperature. The thermodynamic results of Brewer and co-workers (Mandai et al., 1994) are quoted here as it encompasses all of the oligosaccharide used throughout this thesis. The interactions are characterised by an unfavourable entropie term, as are most lectin - carbohydrate interactions, a l-2 Mannobiose stands apart from the other two mannobiosides as having an enhanced association constant.
structure presented here allows observation of detail not seen in modelling studies such as reorganisation of bound solvent, precise position of the sugar and changes in the protein structure - the native structures was used for the ligand docking in the modelling study. This highlights the need for increased parameterisation of protein - carbohydrate interactions to enable meaningful modelling studies.
2.3. Experimental.
Crystallisation and Data Collection.
Co-crystals of the con A - a l-2 mannobiose complex were obtained after an initial screen consisting of 10, 15, 20 and 25% Polyethylene Glycol (PEG) 6K, pH 4.0, 5.0, 6.0 and 7.0. Optimisation of pH and PEG concentration then followed (Moothoo et ai, 1998b). Large crystals were obtained from lOjjl of a solution containing 18mM al-2 mannobiose (Dextra Laboratories, Reading, UK), 0.6mM con A (Sigma, Poole, UK), ImM CaCl2,
ImM MnCli, 20mM TRIS pH 7.0 and O.IM NaCl, mixed with 10 pi of a reservoir containing 10% PEG 6K, O.IM citric acid pH 5.0 in a sitting drop tray (Charles Supper Co.) and left to equilibrate against 1ml of the reservoir. Some crystals grew within one week but were prone to cracking. Slower growing crystals which took two weeks to reach optimum size showed no signs of cracking and these were used for data collection.
Table 2.2. Quality of data of the 2.0Â al-2 mannobiose - con A data.
Resolution No. Reflections % Complete R-Merge/ % Redundancy
25.00-4.30 1897 97.2 5.3 7.5
4.30-3.42 1847 _ 100.0 6.2 7.8
3.42-2.99 1839 99.9 7.1 8.0
2.99-2.71 1837 99.9 8.0 8.3
2.71-2.52 1815 100.0 9.2 8.1
2.52-2.37 1795 99.9 10.0 8.1
2.37-2.25 1822 100.0 11.0 8.1
2.25-2.15 1796 100.0 12.1 8.0
2.15-2.07 1815 100.0 13.2 7.9
2.07-2.00 1670 93.3 13.5 5.6
25.00-2.00 18133 99.0 7.2 7.8
Table 2.3. Quality of data of the I.75Â al-2 mannobiose - con A data.
Resolution No. Reflections % Complete R-Merge/ % Redundancy
25.00-3.77 2608 91.1 4.8 6.3
3.77-2.99 2761 99.9 6.0 8.0
2.99-2.61 2648 97.1 6.6 4.0
2.61-2.37 2605 96.9 7.2 3.1
2.37-2.20 2650 97.2 7.9 3.0
2.20-2.07 2610 96.9 8.9 3.1
2.07-1.97 2587 96.2 10.0 3.0
1.97-1.89 2596 97.0 13.5 3.0
1.89-1.81 2613 96.4 19.4 3.0
1.81-1.75 2127 80.3 23.9 2.8
25.00-1.75 25805 94.9 6.1 3.9
Structure solution.
group I2i2i2i, the translation solution was x = 0.1001, y = 0.0849, z = 0.2869 with a correlation coefficient of 0.40, an R-factor of 46.4%, 29 standard deviations above noise. This solution rigid body refined to give a correlation coefficient of 0.45 and an R-factor of 45.0%, for values a = 58.89, p = 15.54, y = 34.36, x = 0.09878, y = 0.08490, z = 0.28799. At this point the space group was assigned as 1222.
Refinement
criteria: (1) they corresponded to a peak > 3.5a in the Fq-Fc map, (2) they made hydrogen
bonds with reasonable stereochemistry, (3) they reappeared in at least l a in subsequently calculated 2Fq-Fc maps and (4) a drop in the Rfree was observed. The progress of the
refinement is summarised inJTable 2.4. The quality of the final 2.0Â model is shown in Table 2.5.
Table 2.4. Progress of refinement fo r the 2.0Â al-2 mannobiose - con A model.
Refinement R factor/ Rfree
X-Plor: Rigid body fitting (30 cycles). 23.2/ 27.7 O: Mn^^, Ca^^ a l-2 mannobiose and 66
waters added. 51 Atoms set to zero occupancy from residues 39, 60, 69, 118- 122,132, 136,158, 162,185,
217, and 228.
>20 side chains moved into electron density.
X-Plor: 70 cycles of positional refinement. 45 cycles of temperature factor
refinement. 17.4/21.1
O: 11 waters deleted, 39 waters added. Residues 69, 132, 136, 185,217 and 228 were modelled into density. X-Plor: 80 cycles of positional refinement.
50 cycles of temperature factor
refinement. 17.4/21.7
O: 27 Waters added. Atoms from residues 13, 59, 60, 71, 76, 101, 156, 158, 162, 164, 200, 202, 223 and 102 modelled into density.
X-Plor: 40 cycles of positional refinement.
Table 2.5. Quality of the final model of the 2.0Â al-2 mannobiose - con A complex.
Resolution range (Â) oo - 2.00
Rh=(%) 2^6
R factor (%) 17.3
Bond r.m.s. deviation (Â)“ — 0.009 Angle r.m.s. deviation (°)* 1.887 B-factor bonded atoms r.m.s. deviation (A^)^ 2.543 Ramachandran core/additional {%Ÿ 85.1/ 14.9 Protein mean B-factor (all) 20.8 Protein mean B-factor (A^)^ (main chain) 19.4 Protein mean B-factor (A^)*^ (side chain) 22.3 Sugar mean B-factor (A^) 32.8 Solvent mean B (A^) 36.0
* r.m.s. deviation from Engh and Huber ideal values (Engh and Huber, 1991). ‘’Core and additionally allowed regions as defined by PROCHECK (Laskowski, MacAithur et al., 1993).®CalcuIated with MOLEMAN (G.J. Kleywegt, unpublished program). All stereochemically modelled atoms were removed prior to B-factor analysis, all bonded atoms including those in the sugars are included in the calculation of r.m.s. ‘‘B-factor deviation for bonded atoms.
cycles of restrained positional refinement and 65 cycles of restrained temperature factor refinement gave a final R factor of 18.5% and an Rfree of 21.8%.
2.4. Analysis of the Hnal model.
Table 2.6. Quality of the 1.75A al-2 mannobiose - con A model.
Resolution range (A) 00-1.75
Rfiee(%) 21.8
R factor (%) 18.5
Bond r.m.s. deviation (Â / 0.007 Angle r.m.s. deviation (°)® 1.70 B-factor bonded atoms r.m.s. deviation (Â2)‘^ 1.832 Ramachandran core/additional (%Ÿ 86.6/13.4 Protein mean B-factor (Â^)‘^ all/ core (all atoms) 20.7/ 17.3 Protein mean B-factor (Â^)*^ all/ core (main chain) 19.4/ 15.7 Protein mean B-factor (Â^)® all/ core (side chain) 22.2/ 18.9 Sugar mean B-factor (Â^) 28.0
Solvent mean B (Â^) 37.9
Figure 2.2. Ramachandran plot for the 1.75A con A - al-2 mannobiose model.*
180
I
3Ô 45
80 -135 -135
Phi (degrees)
* See section 2.4 for an explanation of the Ramachandran plot.
The temperature factors along the residues of the protein for the subunit are shown in Figure 2.3. The highest peaks correspond with regions found to be consistently disordered in previous crystal structures of con A (Naismith et at., 1993; Naismith et al.,
Figure 2.3. Backbone temperature factor plot for the con A - a i-2 mannobiose model.
Temperature
factor
>50
40
30
•20
10
50 100 150 200
Residue
To investigate the effect of sugar binding on the tryptophans, in particular Trp-182 which adopts an unusual conformation in the complexed structures, fluorescence experiments were carried out on a Perkin Elmer luminescence spectrophotometer (LS50B). A solution of IM glucose was titrated up to a concentration of 170mM into a solution containing 1.5 mgml"^ con A (0.06mM), ImM CaClz, ImM MnCla and 20mM TRIS pH 7.0. No change in the A2 8 0 absorbance was observed indicating that no change in the hydrophobic
2.5. Results and Discussion.
Tetramer organisation.
The dimer of con A is formed by applying the transformation (-x+l, -y, z) (a two fold rotation axis) to the asymmetric unit. The tetramer is generated by a further two operations ((-x+l, y, -z+1) and (x, -y, -z+1)). The four monomers are labelled A, B, C and D in agreement with previous structures. Monomers AB and CD are the two characteristic dimers.
The dimer interaction AB buries 2600Â^ of protein surface accessible area and comprises 18 hydrogen bonds, 14 bridging interactions via water molecules and 158 van der Waals interactions. This is comparable with other con A complexes except for an increase in the water mediated contacts (probably because more waters are observed in this higher resolution structure) but less extensive than observed in the native (sugar free) structure. The interactions between monomers A and C, (and B and D) stabilise the tetramer. The interaction consists of 6 hydrogen bonds, 10 hydrogen bond interactions through single water molecules, 82 van der Waals interactions and 6 polar contacts. These interactions are also comparable to those in other con A complex crystal structures but are less than those seen in the native crystal structure. Formation of the complex tetramer buries 9169Â2 of protein surface accessible area, almost lOOOÂ^ less accessible surface area than the native.
Metal sites
Table 2.7. Metal - Ligand distances in the al-2 mannobiose - con A complex.
Metal Ligand Distance iKf Temperature
factor Ratio’’
Temperature factor Ratio’’ for native C a^ AsplO ODl 2.48(2.51) 0.83 0.67
Asp 10 0D2 2.48 (2.47) 0.67 0.62 Tyrl2 O 2.38 (2.38) 1.01 0.75 A snl40D l 2.46 (2.35) 0.99 0.75 Asp 19 OD2 2.32 (2.41) 0.83 0.69 W A O 2.47 (2.43) 0.98 0.78 W BO 2.29 (2,36) 0.90 0.73 Average 2.41 (2.41) 0.93 0.71 Glu8 OE2 2.25 (2.16) 0.79 0.65 AsplO OD2 2.18(2.15) 0.83 0.62 Aspl9 ODl 2.28 (2.19) 0.89 0.70 His24 NE2 2.27 (2.23) 0.73 0.64 w c o 2.17 (2.18) 0.87 0.82 W D O 2.28 (2.26) 0.74 0.70 Average 2.24 (2.20) 0.82 0.69
'Values for 0.94Â native structure shown in parentheses. 'Temperature factor/ average temperature factor of P-sheet residues.
Sugar Binding
Figure 2.4. Fo-Fc omit map contoured at 2.8G.
Reducing Mannose
Non Reducing Mannose
Table 2.8. Hydrogen bonds and polar contacts (< 3.5 A) between al-2 mannobiose and
con A.
Sugar atom Protein atom Distance/ A
Non-reducing mannose —
03 Arg-228 N 3.0
04 Asn-14 ND2 3.0
04 Asp-208 0D2 2.5
0 4 Arg-228 N 3.1"
05 Leu-99 N 3.3
0 6 Gly-98 N 3.1" 0 6 Leu-99 N 3.1"
0 6 Tyr-100 N 3.1
06 Tyr-100 O 3.4"
06 Asp-208 ODl 2.8
Reducing mannose
o i Tyr-12 OH 3.5
05 OW 2.8
0 6 Asp-16 OD2 3.4"
[image:86.613.78.423.125.565.2]Table 2,9. Van der Waals interactions (< 4.0 Â) between al-2 mannobiose and con A.
Sugar atom Residues Number of contacts
The non-reducing sugar
Cl Leu-99 1
02 Gly-98, Leu-99 2
C3 Arg-228 1
03 Gly-227, Arg-228 5
C4 Asp-208, Arg-228 4
0 4 Asn-14, Asp-208, Gly-227, Arg-228 6
05 Leu-99 2
C6 Tyr-12, Leu-99, Tyr-100, Ala-207, Asp-208
7
0 6 Gly-98, Leu-99, Tyr-100, Ala-207, Asp-208
8
The reducing sugar
C l Tyr-12 1
Ol Tyr-12 1
€6 Asp-16 1
06 Arg-228 1
important role in mediating con A - oligosaccharide contacts. In addition the reducing sugar makes 4 van der Waals interactions with the protein (Table 2.9).
Figure 2.5. Hydrogen bond diagram o f the al-2mannobiose - con A complex. The sugar
residue coloured red is bound at the monosaccharide binding site.
Tyr12
/ Asp16
HO HO TyrlOO
HO
; o — H Asn14
Leu99 N
H-HO
Asp208
XNHg
.NH
Arg228
which was not buried by the carbohydrate in the methyl a-D-mannopyranoside - con A structure now has 19Â^ of surface accessible area buried and is newly recruited into binding. Tyr-12 and Arg-228 are less accessible due to interactions with the reducing sugar. Breaking this down ^rther in to buried polar and apolar surface accessible area, a total of 55% of the total protein buried surface accessible area is polar and 45% is apolar. 70% of the sugar buried surface accessible area is polar, 30% apolar. The glycosidic linkage conformation angles of the disaccharide in this structure are close to those observed in solution by NMR and lie in an energy minima (Imberty et aL, 1990) (NMR structure: tp = 59°, \j/ = -140°, crystal structure: tp = 65°, \\f = -141°, for definitions of (p and y\f see Figure 2.1).
Effect of sugar binding on the protein structure
The dimannose bound structure superimposes onto the 0.94Â native structure with a root mean square deviation (r.m.s.d.) of 0.50Â for ail Coe backbone atoms and 0.25Â for the C a atoms of the p-sheet residues. Table 2.10 shows average r.m.s.d.’s when superimposing the C a atoms of the various con A structures onto each other. The native structure has a consistently higher r.m.s.d. for superposition to any of the other complex structures. This suggests that sugar binding brings about substantial changes in the protein structure, even in regions remote from the binding site itself.
Table 2.10. R.m.s. deviations fo r the C a superposition of con A complexes.
r.m.s. deviation /A r.m.s. deviation /Â p-sheet C a only Dimannose —> Native 0.50 0.25 Dimannose —> Man OMe® 0.36 0.18 Dimannose —> Trisaccharide’’ 0.35 0.17 Dimannose Pentasaccharide^ 0.28 0.17
Me-a-Man -4 Native’^ 0.50 0.27
Trisaccharide Native’’ 0.57 0.30 Pentasaccharide -» Native'’ 0.51 0.27
“Averaged over three of the four subunits present in the asymmetric unit. ’’Averaged over the 4 subunits present in the asymmetric unit. ’’Averaged over the 6 well ordered subunits present in the asymmetric unit.