Development of a Battery Energy Loss Observer Based on
Improved Equivalent Circuit Modelling
Ahmed M. Fares
1,2, Christian Klumpner
1, Mark Sumner
11
UNIVERSITY OF NOTTINGHAM,
Nottingham NG7 2RD, United Kingdom
2
NATIONAL AUTHORITY FOR REMOTE SENSING AND SPACE SCIENCES,
Cairo (P.O. Box : 1564), Egypt
Tel.: +44 / (0) –115 846 6118.
Fax: +44 / (0) –115 951 5616.
E-Mail: [email protected], [email protected]
URL: http://www.nottingham.ac.uk
Acknowledgements
This work was supported by the Egyptian Government through a PhD scholarship sponsored by Ministry of Higher Education (Cultural Affairs and Missions Sector).
Keywords
«Batteries», «Battery Management Systems (BMS)», «Efficiency», «Estimation technique», «Impedance measurement », «Modelling».
Abstract
This paper proposes a new energy loss observer for batteries that has a good accuracy and low complexity. This observer can provide a support for battery management systems (BMS) in terms of predicting battery energy loss and/or battery internal temperature for given load profiles, and this enhances BMS capabilities for predictive and corrective actions. The typical observer requires an accurate battery model that represents accurately the internal resistance of the battery, and therefore battery modelling guidelines to produce a simplified equivalent circuit model (ECM) have been proposed. Experiments to validate the accuracy of the proposed model have been performed on a LiFePO4 (3.6V/8Ah) battery cell. The model parameter estimation has been achieved by fitting the model impedance to the battery impedance data obtained from electrochemical impedance spectroscopy. The energy loss estimation based on the proposed observer showed good accuracy with maximum error of ±2% under different load profiles operated within the targeted frequency range.
1.
Introduction
Accurate battery loss estimation requires accurate information regarding battery internal resistance that is usually given in datasheets at specific frequencies and temperature; however the resistances changes significantly with frequency and at different temperatures. In addition the high frequency resistance that measured online through measuring transitions in battery voltage that corresponding to transitions in current is also small compared to resistances at low frequencies, and therefore a model that is able to better represent battery dynamics is needed. Equivalent circuit models (ECM) for batteries are widely used with battery management systems (BMS) instead of electrochemical models due to their simplicity and ease of implementation; however the simplicity of the ECM usually results in low accuracy. There are many ECMs that have been proposed for representing battery dynamics starting from simple resistor models to represent battery internal resistance, up to models with constant
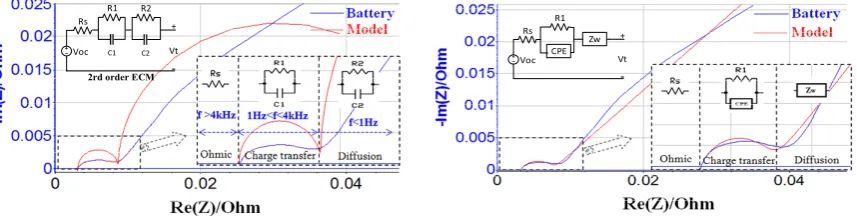
phase elements[1-4]. Among the different ECMs, the 2nd order RC model (Fig. 1(a)) is widely used for
modelling battery dynamics as it is considered to be closer to the physical principles of battery
one to represent the charge transfer process and the other to represent the diffusion process. Although this model is considered to be simple, it does not have sufficient accuracy to fit battery impedances measured through electrochemical impedance spectroscopy (EIS) experiments as can be seen in Fig. 1(a). Large errors can be observed because the Nyquist plot of the battery impedance spectroscopy (IS) has a depressed semicircle within the frequency range of the charge transfer process (1Hz<f<4 kHz) that cannot be modelled accurately by a single R//C branch. Also the plot shows a behavior similar to Warburg impedance [5, 6] within the frequency range of the diffusion process (1mHz<f<1Hz) that also cannot be modelled accurately by a single R//C branch.
A complex model can be obtained by replacing the simple capacitor of the R1//C1 branch representing
the charge transfer process by a constant phase element (CPE) to accurately fit the depressed
semicircle of the impedance plot, as well as replacing the R2//C2 branch by Warburg impedance to
enhance the fitting accuracy as shown in Fig. 1(b)[4, 5].
Many attempts have been made to improve the accuracy of modelling especially for the diffusion process: some methods used a constant phase element and hence a fractional order model [3, 4]; other modelling techniques used an unlimited chain of RCs to represents the Warburg impedance, trying to approximate by a finite number N (suggested as 5 in [6]). Although these modelling techniques achieved a good accuracy, it extended the model complexity and this may be inappropriate if low cost microcontrollers are considered for the BMS.
2rd order ECM
Voc
+
-Vt Rs
C1 R1
C2 R2
Voc
+
-Vt Rs
R1
[image:2.595.88.517.309.417.2]CPE Zw
Fig. 1:Curve fitting of battery IS with (a) 2nd order ECM model; (b) Complex model
2.
Proposed modelling methodology
The accurate estimation of energy loss requires an accurate model that is able to fit battery IS data accurately especially for the real part. The proposed model will be developed by fitting battery IS data using curve fitting techniques targeting good accuracy. Simple R//C branches are used for the ECM for the battery and the methodology described in [7] is adapted to fit the of the real part of the battery
IS with a 3rd order RC model to the full frequency range (FFR) of (1mHz to 4kHz).
Voc(SoC) Rs
C1 R1
C2 R2
C3 R3
+
-Fig. 2: Curve fitting of battery IS within FFR by 3rd order ECM
[image:2.595.75.518.552.699.2](less than 1mHz) all capacitors of the model have infinite reactance and can be considered as an open circuit. As the frequency increases and moves to band A, capacitor C3 starts to conduct where C1 and C2 are still open circuit, so the ECM is an RC branch of R3//C3 in series with a resistance of (Rs+R1+R2). A similar analysis is made for all other bands (B to F).
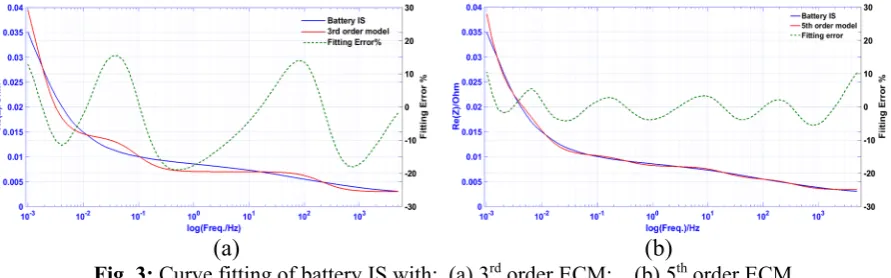
In order to decrease the amplitude of the overshoots of fitted curve to decrease the error, it is required
to increase the number of the R//C branches to allow more cutoff frequencies. A second fit with a 5th
order ECM is also made to compare with the 3rd order ECM to evaluate the curve fit accuracy as
shown in Fig. 3.
(a)
(b)
Fig. 3: Curve fitting of battery IS with: (a) 3rd order ECM; (b) 5th order ECM
It is obvious that the 3rd order model cannot maintain good accuracy within the given full frequency
range (FFR) and the error varied between ± 20% based on frequency as shown in Fig. 3(a); however
the 5th order model maintained good accuracy within the FFR with a maximum error of ±5% as shown
in Fig. 3 (b). It can be concluded that the order of the model should be increased as the frequency range to be considered increases in order to maintain a good level of accuracy. Based on this, an accurate model with reduced order can be obtained if the curve fitting effort is made for a targeted frequency range (TFR) that contains the dominant spectrum of the load profiles instead of fitting within overall FFR.
By using a 3rd order ECM to fit the battery IS within a TFR that is selected based on the dominant
[image:3.595.76.522.183.322.2]spectrum of load profile, a good accuracy level can be achieved as shown in Fig. 4. The error within the TFR is maintained within ±2%; however it reached 200% outside this range without contribution to model accuracy as will be presented in section 4.
Fig. 4: Curve fitting ofbattery IS with a 3rd order ECM within TFR
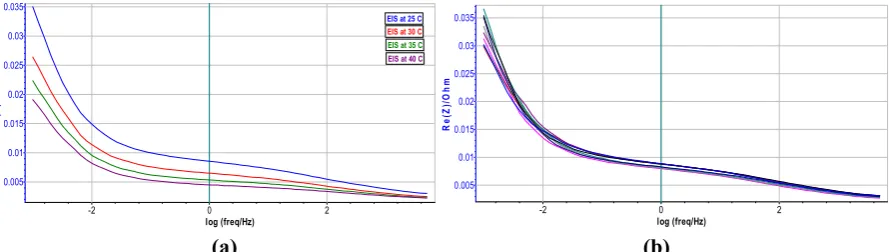
The model parameters are estimated offline based on battery IS data that have been measured under defined conditions of temperature and state of charge (SoC). Therefore changes in these conditions will contribute to model errors. A change of temperature contributes the most to model errors due to
the significant change in battery IS with temperature (Fig. 5 (a)). A change of temperature from 25oC
to 40oC causes a change of 80% in the real part of impedance Re(Z). By contrast, a change in SoC
it is suggested that the model parameters are estimated under different conditions of temperature and SoC and then these estimates are used during operation based on online measurement of temperature and SoC estimation to update the model parameters as presented later in section 4.3.
(a) (b)
Fig. 5: Battery IS at (a) Different temp.at 50% SoC ; (b) SoC (10% to 90%) at temp. 25 oC
3.
Energy
loss estimation methods
3.1 Method 1
The proposed energy losses observer is created by implementing the 3rd order ECM model (Fig. 6)
with the parameters estimated by fitting the battery IS data within a TFR as discussed in the previous
section. The observer utilizes battery current measurements (Itrm) as the input to the state space model
(SSM) described by equations (1) and (2) to estimate the model states (V1,…3) that are then used to
[image:4.595.77.522.123.249.2]drive the estimation of the battery terminal voltage (Vtrm) and energy losses Eloss.
Fig. 6: 3rd order ECM model for TFR with estimated parameters at 25oC and 30oC at 50%SoC
trm I C C C C R C R R + − − − = • • • 3 12 11 1 V3 V2 V1 3 3 1 0 0 0 2 2 1 0 0 0 1C1 1 V3 V2 V1 (1) V3) V2 V1 R I ( V
Vtrm= oc− trm s+ + +
(2)
The term “energy loss” Eloss (Wh) refers to the power losses Ploss (W) during a period of time te(hour)
and can be estimated as:
= e loss
loss t dt P E 0
(3)
while the power losses (Ploss) is estimated online through the observation of the states (V1,…3) of the
ECM model of Fig. 6 using the SSM (equations 1,2) as:
+ = = 3 1 2 2 * i i i trm s loss R V I R
P
(4)
log (freq/Hz) 2 0 -2 R e (Z )/ O h m 0.035 0.03 0.025 0.02 0.015 0.01 0.005
EIS at 25 C EIS at 30 C
EIS at 35 C EIS at 40 C
log (freq/Hz)0 2
-2 Re (Z )/ O h m 0.035 0.03 0.025 0.02 0.015 0.01 0.005 Parameters Rs
(mΩ) (mR1 Ω) C1 (F) (mR2 Ω) C2 (F) (mR3 Ω) (F)C3
at 25oC 9.3 2.95 885 15.2 2378 76.7 5710
In order to validate the proposed losses observer, two other methods are used to estimate the energy loss for the battery and the results of three are compared.
3.2 Method 2
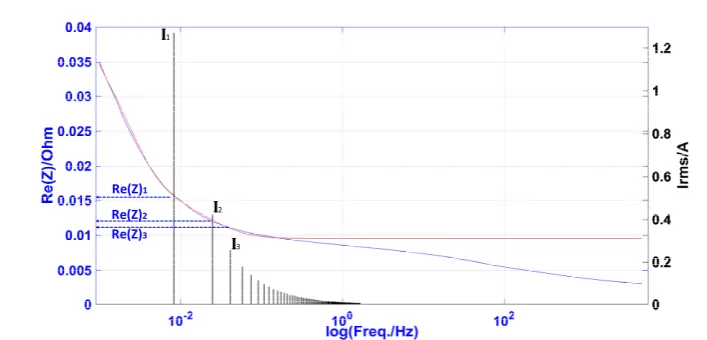
The second method uses the frequency domain spectrum of the load current profile and the values of real part of the impedance (Re (Z)) of the frequencies in this spectrum[8], then estimates the power losses produced by each relevant harmonic as demonstrated in Fig. 7 and equation (5).
k n
k k loss I Z
P *Re( )
[image:5.595.117.471.189.359.2]1 2 = =
(5)
I2 I3 I1 Re(Z)1 Re(Z)2 Re(Z)3Fig. 7: Frequency domain based losses estimation
where Ik is the rms current (A) of the frequency component k while Re(Z)k is the real part of
impedance (Ohm) at that frequency. The number of relevant harmonics n is set to 3 as the first three components of the current spectrum are the most dominant in the spectrum.
3.3 Method 3
In this method, the difference between the energy consumed during charging of the battery by a defined charge amount (Ah) and the energy taken during discharging the same charge amount is considered to be the energy losses which can be justified as follow:
When the charging process is considered for the battery to a defined state of charge SoC1 starting from
initial state SoCo, the energy that is supposed to be stored in the battery after charging (E1) is:
1 1 1 1 0 ) ( ) ( oss chr l o t E dt t V t I E
E = + −
(6)
where Eo is the energy stored in the battery at the initial state of charge SoCo, I1(t) and V1(t) is battery
measured current and voltage during the charge process time tchr and Eloss1 is the assumed energy loss
during charging.
When the discharging process is considered for the battery from the state of charge SoC1 to the state of
charge SoC2; the energy that is supposed to be stored in the battery after discharging (E2) is:
2 2 2 1 2 0 ) ( ) ( loss dchr E t dt t V t I E
E = − −
(7)
Where I1(t) and V1(t) are the battery measured current and voltage during the discharge process time
tdchr and Eloss2 is the assumed energy loss during discharge.
The discharged capacity (I2*tdchr) is adjusted to be the same as the charged capacity (I1*tchr) so (SoC2 =
SoCo) and hence (E2 = Eo), then by substituting from eq. (6) in (7):
−
= chr dchr
loss t dt t V t I t dt t V t I E 0 ) ( ) ( 0 ) ( )
( 1 2 2
1
where (
Eloss=Eloss1+Eloss2)
(8)
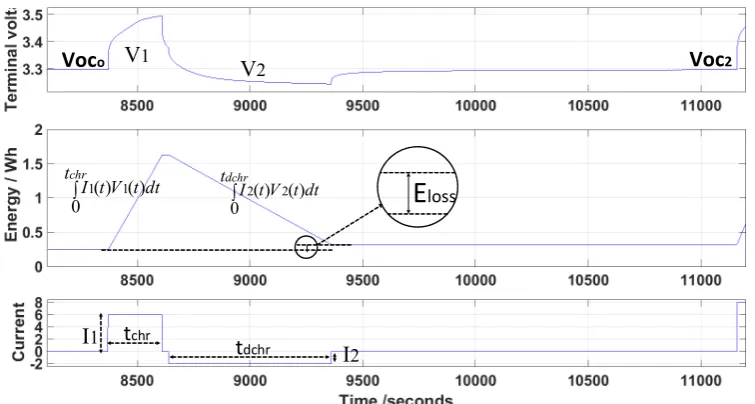
This method was validated experimentally by considering the charge/discharge cycle shown in Fig. 8,
it can be noted that (Voc2 = Voco) and hence (SoC2= SoCo). This means that the battery after the
difference between the charge and discharge energies represents the energy lost as it did not contributed to the change of the battery SoC. This is agrees with eq. (8).
Voco
E
lossVoc2
tchr
tdchr
I1
chr
t
dt t V t I
0 () ()
1
1 tdchrI tV tdt
0 2() 2()
I2
V1
[image:6.595.107.485.111.313.2]V2
Fig. 8: Time domain based losses estimation
4.
Results and Discussion
In order to validate the observer and the modelling technique used with it, the battery was subjected to
different load profiles whilst used to validate the proposed loss models. The proposed 3rd order ECM
for TFR results are compared with the more complex 5th order ECM as well as 3rd order ECM for a
FFR. Different load profiles are chosen to create a changing load frequency spectrum in order to test the model accuracy within the overall targeted frequency range (TFR). Fig. 9 shows the results obtained based on the three models. When compared to the true battery voltage measurement, it is
clear that the 5th order ECM for FFR and the 3rd order ECM for TFR show smaller errors than the 3rd
order ECM for FFR for load profiles A and B; for profile C however, the latter model shows accidentally a better accuracy, due to a higher temperature as it will be discussed in more detail in section (4.2).
(a)
(b)
Fig. 9: (a)Voltage and energy for the actual battery and the three different models during testing with different load profiles; (b) magnification of one-cycles for each profile
In the following subsections, the three models will be evaluated. The model parameters were estimated
based on battery IS data obtained at a temperature of 25oC. The experimentally measured energy loss
[image:6.595.76.527.507.646.2]4.1 5
thorder ECM for full frequency range
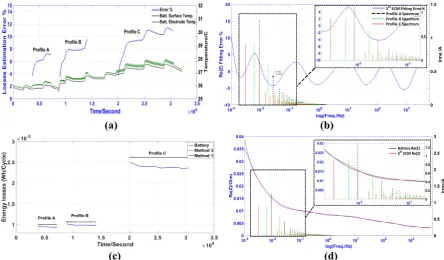
As seen in Fig. 10(a), the energy loss estimation error increases with temperature. The battery temperatures are measured by two sensors: one is located on the battery surface; the second sensor is located on a battery terminal, which being metal can give a better indication of its internal temperature. Different profiles have different fitting errors as shown in Fig. 10(b). For example the energy loss estimation error for profile A is expected to around 4% as the dominant spectrum has a 4% fitting error (Fig. 10(b)) and Fig. 10(a) confirms this expectation; however this energy loss error increases from 4% during the initial cycles to 7% due to an increase in battery temperature due to the losses during the cycling.
5th ECM Fitting Error%
Profile A Spectrum Profile B Spectrum Profile C Spectrum
(a) (b)
Battery Re(Z) 5thECM Re(Z)
[image:7.595.74.519.198.458.2](c) (d)
Fig. 10: 5th ECM error analysis with (a) Evolution of energy loss estimation error and temperature;
(b) Battery Re(Z) fitting error and load current profiles spectrum; (c) Energy losses per cycle for the real battery and the three models; (d) Re(Z) for the real battery and the model and the load current profiles spectrums.
The increase in battery temperature causes the battery Re(Z) to decrease as shown before in Fig. 5 (a). This causes the battery energy losses per cycle to decrease during the cycling which leads to the increase of the error between the real battery and the model as shown in Fig. 10 (c).
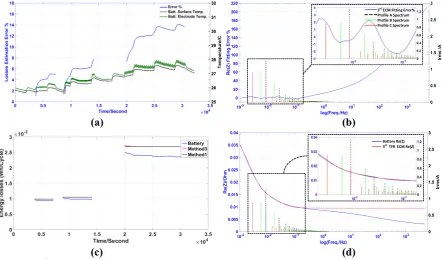
4.2 3
rdorder ECM for full frequency range
As seen in Fig. 11, the 3rd order ECM for FFR has different results based on the load profiles. Fig 11a
shows that profile A has the biggest error as the 2nd harmonic of its spectrum is located near the peak
of the Re(Z) fitting errors. Profile B has two dominant frequency components matching with a positive and a negative Re(Z) fitting errors that partly cancel each other and the result is a smaller error than
for Profile A. By comparing the losses estimation errors of the 5th order ECM for FFR shown in Fig.
10a with the 3rd order ECM for FFR shown in Fig. 11a, it can be seen that for both load profiles A and
B, the precision of the 5th order ECM is better, as expected due to its lower fitting error.
For profile C however, due to higher losses/temperature in the battery which causes a decrease of
Re(Z), the error of the 3rd order ECM for FFR shows an error range (-6% to +2%) with a significantly
smaller average than the 5th order ECM for FFR. The reason is that the Re(Z) error in the curve fitting
at the fundamental frequency of profile C (red bar) is accidentally smaller compared to the actual
Re(Z) of the battery at 30oC as seen in Fig. 11(d) , which seems to be closer to the actual battery
3rd ECM Fitting Error%
Profile A Spectrum Profile B Spectrum Profile C Spectrum
(a) (b)
Battery Re(Z) at 25˚C Battery Re(Z) at 30˚C 3rd FFR ECM Re(Z)
[image:8.595.72.522.73.332.2](c) (d)
Fig. 11: 3rd ECM for FFR error analysis with (a) Evolution of energy loss estimation error and
temperature; (b) Battery Re(Z) fitting Error and load current profiles spectrum; (c) Energy losses per cycle for the real battery and the three models; (d) Re(Z) for the real battery and the model and the load current profiles spectrums.
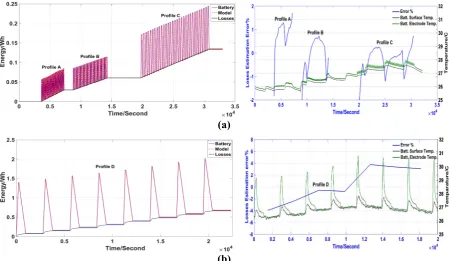
4.3 Proposed 3
rdorder ECM for targeted frequency range
As seen in Fig. 12(a), the 3rd order ECM for TFR has obvious good loss estimation results within the overall targeted frequency range (TFR) for load profiles A and B (errors span from 1% - 7%) which is better than the error range of the 5th order ECM for FFR.
3rd ECM Fitting Error%
Profile A Spectrum Profile B Spectrum Profile C Spectrum
(a) (b)
Battery Re(Z) 3rdTFR ECM Re(Z)
(c) (d)
Fig. 12: 3rd ECM for TFR error analysis with (a) Evolution of energy loss estimation error and
[image:8.595.74.517.462.721.2]For profile C, the loss estimation error is ranging from 8% to 14% which is not consistent with the expectations of having only a 2% Re(Z) fitting error as can be seen in Fig. 12 (b). . This means that the significant increase in the error is mainly caused by the increase of the battery temperature during cycling. Fig.5 confirms that Re(Z) can drop by approx. 18% at 4mHz when the device temperature
increases from 25°C to 30°C which is similar to the change in the temperature of the battery terminal
shown in Fig.12.a.
It is therefore clear that when significant errors in the loss estimation are found when using a model that has small fitting Re(Z) errors, this may be due to the temperature variation of the device. It is possible to imagine a system that estimates the internal temperature of a battery cell, which is very hard to measure, based on an energy loss error observer. But it is also possible to improve the accuracy of the energy loss observer by allowing it to adapt to temperature variations.
In order to test these ideas, a further test (profile D) with higher load currents that would lead to significantly higher battery internal temperatures has been applied and the results are shown in Fig. 13.
[image:9.595.76.525.254.381.2]
(a) (b)
Fig. 13: Battery versus3rd ECM for TFR for profile D: (a) Energy loss estimation error; (b) Energy
and loss for battery and model
Without a temperature correction, it can be seen that the energy loss estimation has large errors (34% -
44%) due to the significant increase in battery terminal (and also internal) temperature (up to 31°C)
although the surface temperature does not show a large increase (27.5°C).
(a)
(b)
Fig. 14: Battery versus3rd ECM for TFR energy losses and corresponding errors for: (a) Profiles A, B
[image:9.595.73.524.467.728.2]In order to improve the energy loss observer accuracy, a lookup table for model parameters determined at different temperatures has been used to update the model parameters based on the temperature measured at the battery terminal. Fig. 14 shows that this method gives a consistent good accuracy for all load profiles A, B and C as well as profile D with maximum error of ±2% for profiles A, B and C and ±4% for profile D.
5.
Conclusion
In this paper, an observer which calculates battery cycling energy loss has been proposed based on equivalent circuit modelling, with model parameters estimated based on curve fitting of battery electrochemical impedance spectroscopy data. The proposed modelling technique produced a reduced
3rd order model whilst maintaining the same accuracy of a more complex 5th order model by focusing
the fitting efforts toward a targeted frequency range that covers relevant spectrum of the any possible load profiles. The change in temperature and state of charge are compensated here by estimating the model parameters at different temperatures and state of charges to build a lookup table. During operation the model parameters can be estimated by means of interpolation using the lookup table. The energy loss observer based on the proposed modelling shows a good degree of accuracy (±2% error) for the different load profiles within the targeted frequency range. Without applying a temperature correction for the model, it is possible to use the error in the loss estimation for online estimation of the battery internal temperature.
Future work
As it ages, the battery state of health has significant effect on the model parameters and it is difficult to predict how these will change to use them in the online energy loss observer. So the future work will scope in the enhancements for proposed observer by using the proposed target frequency range modelling technique with nonlinear filtering algorithms like Kalman filter (KF) for online parameters identifications to maintain the observer accuracy.
References
[1] He H, Xiong R, Fan J.: Evaluation of Lithium-Ion Battery Equivalent Circuit Models for State of Charge Estimation by an Experimental Approach, Energies Vol.4 no 4, pp. 582-598.
[2] Rahimi-Eichi H, Baronti F, Chow MY.: Modeling and online parameter identification of Li-Polymer battery cells for SOC estimation, IEEE proc. of (ISIE) 2012, pp. 1336-1341.
[3] Shifei Y, Hongjie W, Xi Z, Chengliang Y.: Online Estimation of Electrochemical Impedance Spectra for Lithium-Ion Batteries via Discrete Fractional Order Model, IEEE proc. of (VPPC) 2013, pp. 1-6.
[4] Wang B, Li SE, Peng H, Liu Z.: Fractional-order modeling and parameter identification for lithium-ion batteries, Journal of Power Sources. Vol.293, pp151-161.
[5] Raistrick ID, Franceschetti DR, Macdonald JR. Theory. Impedance Spectroscopy: John Wiley & Sons, Inc.; 2005. p. 27-128.
[6] Fleischer C, Waag W, Heyn H-M, Sauer DU.: On-line adaptive battery impedance parameter and state estimation considering physical principles in reduced order equivalent circuit battery models: Part 1. Requirements, critical review of methods and modeling, Journal of Power Sources. Vol.260, pp.276-91.
[7] Stević Z, Vujasinović M, Radunović M.: Estimation of Parameters Obtained by Electrochemical Impedance Spectroscopy on Systems Containing High Capacities, Sensors. Vol.9, pp.7365-7373.