Spatial patterns in the oxygen isotope composition of daily rainfall in the British 1
Isles 2
3
Jonathan Tyler1,2* 4
Matthew Jones3,6 5
Carol Arrowsmith4 6
Tim Allott5 7
Melanie J. Leng4,6 8
9
1 Department of Earth Sciences, The University of Adelaide, Adelaide, South 10
Australia, 5005, Australia. 11
2 Sprigg Geobiology Centre, The University of Adelaide, Adelaide, South Australia, 12
5005, Australia. 13
3 School of Geography, The University of Nottingham, University Park, Nottingham, 14
NG7 2RD, United Kingdom. 15
4 NERC Isotope Geosciences Facilities, British Geological Survey, Keyworth, 16
Nottingham, NG12 5GG, United Kingdom. 17
5 Met Office, FitzRoy Road, Exeter, Devon, EX1 3PB, United Kingdom. 18
6 Centre for Environmental Geochemistry, The University of Nottingham, University 19
Park, Nottingham, NG7 2RD, United Kingdom. 20
21
* Corresponding author: [email protected] 22
23
24
Abstract 26
27
Understanding the modern day relationship between climate and the oxygen isotopic 28
composition of precipitation (18
OP) is crucial for obtaining rigorous palaeoclimate
29
reconstructions from a variety of archives. To date, the majority of empirical studies 30
into the meteorological controls over 18
OP rely upon daily, event scale, or monthly
31
time series from individual locations, resulting in uncertainties concerning the 32
representativeness of statistical models and the mechanisms behind those 33
relationships. Here, we take an alternative approach by analysing daily patterns in 34
18
OP from multiple stations across the British Isles (n = 10 - 70 stations). We use
35
these data to examine the spatial and seasonal heterogeneity of regression statistics 36
between 18
OP and common predictors (temperature, precipitation amount and the
37
North Atlantic Oscillation index; NAO). Temperature and NAO are poor predictors of 38
daily 18
OP in the British Isles, exhibiting weak and/or inconsistent effects both
39
spatially and between seasons. By contrast 18
OP and rainfall amount consistently
40
correlate at most locations, and for all months analysed, with spatial and temporal 41
variability in the regression coefficients. The maps also allow comparison with daily 42
synoptic weather types, and suggest characteristic 18
OP patterns, particularly
43
associated with Cylonic Lamb Weather Types. Mapping daily 18
OP across the British
44
Isles therefore provides a more coherent picture of the patterns in 18
OP, which will
45
ultimately lead to a better understanding of the climatic controls. These observations 46
are another step forward towards developing a more detailed, mechanistic framework 47
for interpreting stable isotopes in rainfall as a palaeoclimate and hydrological tracer. 48
49
Introduction 51
52
The relationship between climate and the oxygen isotope composition of precipitation 53
(18
OP) is central to a wide range of palaeoclimate interpretation techniques, from
54
direct archives of ancient precipitation preserved in ice (e.g. Barbante et al. 2006; 55
Dansgaard et al. 1993; Johnsen et al. 2001; Petit et al. 1999), through indirect archives 56
which include speleothem calcite, lake sediment biominerals and tree ring cellulose 57
(e.g. Baker et al. 2011; Evans and Schrag 2004; Jones et al. 2006; Robertson et al. 58
2001; Tyler et al. 2008; von Grafenstein et al. 1996; Wang et al. 2008). Improved 59
understanding of the climate-isotope relationship is therefore an important step 60
towards improving the accuracy and rigour of palaeoclimate reconstructions both 61
from individual records and through regional/global data-assimilation projects (e.g. 62
PAGES 2k Consortium 2013; Shakun and Carlson 2010). Much of our understanding 63
of this key climate-isotope interaction is built around two approaches: the 64
development and exploration of isotope-enabled climate models (Gedzelman and 65
Arnold 1994; Hoffmann et al. 2006; Jouzel et al. 2000; Langebroek et al. 2011; 66
Merlivat and Jouzel 1979; Schmidt et al. 2007) and the statistical examination of 67
isotope monitoring data (Dansgaard 1964; Fischer and Baldini 2011; Rozanski et al. 68
1993; Treble et al. 2005). Despite significant developments in incorporating isotope 69
systematics into climate models, the continued acquisition and exploration of 70
precipitation isotope monitoring data remains crucial, both to assist in the validation 71
and parameterisation of climate models but also to refine the interpretation of isotope 72
based palaeoclimate records. 73
Empirical studies into the links between 18
OP and climatic/meteorological parameters
75
are numerous and diverse. A widespread correlation between 18
OP and air
76
temperature is manifest globally and for select continental regions, particularly from a 77
spatial perspective and occasionally through time (Araguas-Araguas et al. 2000; 78
Dansgaard 1964; Kohn and Welker 2005; Rozanski et al. 1993). Air temperature is an 79
important factor in driving condensation within a vapour parcel and dictating the 80
liquid-vapour isotopic fractionation (Dansgaard 1964). However, uncertainties exist 81
regarding the association between air temperature at the land surface and vapour 82
condensation temperature, which varies as a function of altitude even during the 83
course of an individual rainfall event (Celle-Jeanton et al. 2004; Celle-Jeanton et al. 84
2001). Furthermore, the global correlation between air temperature and 18
OP is
85
subject to covariance with other key elements of the global isotope hydrological 86
cycle, including latitude, conditions at and distance from evaporation source, and 87
precipitation amount (Bowen and Wilkinson 2002). 88
89
Changes in precipitation amount are also expected to impart an influence upon 18
OP,
90
due to the combined effects of Rayleigh distillation prior to precipitation at the 91
monitoring station, evaporation from falling raindrops and isotopic exchange between 92
raindrops and ambient vapour beneath cloud level (Callow et al. 2014; Dansgaard 93
1964). The so called ‘amount effect’ is most prominently associated with convective 94
tropical rainfall (Rozanski et al. 1993), however correlations between rainfall amount 95
and 18
OP have also been frequently observed in data from maritime temperate
96
regions (Baldini et al. 2010; Baldini et al. 2008; Callow et al. 2014; Celle-Jeanton et 97
al. 2001; Crawford et al. 2013; Darling and Talbot 2003; Treble et al. 2005). In 98
addition to effects at the site of precipitation, variability in 18
OP is subject to the
conditions at the source of moisture evaporation (e.g. sea surface temperatures and 100
relative humidity), the trajectory of the air mass, synoptic weather patterns and 101
interaction with the land surface (Celle-Jeanton et al. 2004; Celle-Jeanton et al. 2001; 102
Fischer and Baldini 2011; Heathcote and Lloyd 1986; Lachniet and Patterson 2009; 103
Liebminger et al. 2006; Sodemann et al. 2008; Treble et al. 2005). 104
105
A major advance in our understanding of the controls over 18
OP has been the
106
proliferation of studies utilising daily or event-scale monitoring in an attempt to 107
address the mechanisms behind isotopic signatures at timescales relevant to the actual 108
process (Baldini et al. 2010; Fischer and Baldini 2011; Heathcote and Lloyd 1986). 109
Longer term 18
OP data – be they monthly, annual, centennial or millennial – are best
110
viewed as composites of event scale processes, weighted by the amount of rainfall 111
during each event. For this reason, regression models built around monthly or annual 112
data can be subject to issues related to changes in seasonal weighting (Vachon et al. 113
2007) or simply an inability to capture the conditions during which precipitation 114
occurred (Baldini et al. 2010). Recently, approaches have emerged which enable the 115
integration of monthly resolved isotope data with daily meteorological data, therefore 116
modelling the processes at timescales relevant to synoptic conditions (Fischer and 117
Baldini 2011; Fischer and Treble 2008). However, with increased resolution comes 118
increased noise, thus the representativeness of empirical models based upon single 119
isotope time-series comes into question. There is therefore significant value in studies 120
which combine daily monitoring with multiple sites in order to evaluate the 121
relationships between regional meteorology and the isotopic composition of 122
precipitation (e.g. Good et al. 2014) and such studies are scarce. 123
The British Isles is an interesting study location for isotopes in rainfall, with a 125
maritime climate that is affected by the confluence of weather systems with distinctly 126
different origins depending on the direction of flow (Heathcote and Lloyd 1986). 127
Previous studies have addressed the climate-isotope relationships in the British Isles 128
using single site daily, event based and monthly monitoring (Baldini et al. 2010; 129
Darling and Talbot 2003; Fischer and Baldini 2011; Heathcote and Lloyd 1986; Jones 130
et al. 2007). On the basis of nearly two year’s daily monitoring at Driby, Lincolnshire, 131
Heathcote and Lloyd (1986) observed no correlation between air temperature and 132
18
OP and concluded that weather type and associated origin of moisture is the
133
primary factor responsible for changes in daily 18
OP. At Wallingford, Oxfordshire,
134
Darling and Talbot (2003) observed weak and seasonally variable correlations 135
between daily 18
OP, temperature and precipitation amount – correlations which
136
improve when monthly values are used. In a detailed analysis of event scale 18
OP in
137
Dublin, Ireland, Baldini et al. (2008; 2010) demonstrate the primary role of 138
precipitation amount and moisture source trajectory. On the basis of those data, 139
Fischer and Baldini (2011), developed a series of daily empirical functions of 140
increasing complexity to characterise 18
OP as a function of precipitation amount and
141
moisture source. The Fischer and Baldini (2011) daily functions, and approach in 142
general, offer tremendous potential for improving the interpretation of palaeoclimate 143
archives. However, the broader applicability of those functions, as with the traditional 144
Dansgaard (1964) type relationships, is dependent upon understanding how the 145
coefficients and model skill vary in space and through time. In particular, the causal 146
mechanism between rainfall amount and 18
OP, and how that relationship evolves
147
through the lifespan of a rainfall event, remains poorly understood. Here, in an 148
functions, and to address the issue of signal vs. noise in daily 18
OP data, daily
150
monitoring of 18
OP was carried out at multiple locations across the relatively small
151
spatial gradient of the British Isles. We report daily 18
O measurements over 57 days, 152
sampling rainfall events across each of the four seasons from up to 70 sites. These 153
data indicate daily spatial 18O gradients within the British Isles of up to 17‰,
154
highlighting the role of the evolution of weather systems in driving local scale 155
variability in 18
OP. We use these data to evaluate the empirical relationships between
156
18
OP and daily weather, and to qualitatively assess the potential for developing a
157
synoptic typology for 18
OP in the British Isles.
158
159
Sites and Methodology 160
161
Daily precipitation water samples were collected from up to 70 sites within England, 162
Wales, Scotland and Northern Ireland (Figure 1; Table 1). The samples were collected 163
as part of a pilot study for the British Isotopes in Rainfall Project (BIRP) - a 164
community engagement initiative, in collaboration with volunteer weather observers 165
and the UK Met Office. Initially, 17 volunteers were engaged, contacted via the 166
Climate Observers Link (COL) or via existing monitoring programmes (Table 1). 167
This group was subsequently augmented by further weather observers with ongoing 168
association with the U.K. Met Office. Precipitation water samples were collected 169
using a standard Met Office rain gauge at 9 am GMT each day. Having measured the 170
amount of rainfall for the previous 24 hours, the rain water samples were transferred 171
to 4 ml or 8 ml Nalgene ® HDPE bottles, depending on rainfall amount taking care to 172
ensure bottles were full to avoid any exchange of sample oxygen with air in the bottle. 173
the end of each month. Details of sampling practice were communicated to 175
participants via an online video (http://tinyurl.com/BIRP2010), with further 176
instructions provided via post to each sampler. 177
178
Precipitation samples were collected during the course of four campaigns, conducted 179
in March 2010, October 2010, July 2011 and January 2012, thereby capturing a 180
subsample of each of the seasons. Collection days were inevitably limited by the 181
occurrence of precipitation events and availability of volunteers, and thus the sample 182
set for each site and month range from 2-19 samples (Table 1). In addition to 183
collecting precipitation water, at the majority of stations a range of meteorological 184
data was recorded. Every station provided rainfall amount data, and the majority also 185
provided air temperature recordings. Where local temperature readings were not 186
taken, temperature data from a nearby Met Office station was used (Table 1). Because 187
precipitation samples were collected at 9 am each day, the date of precipitation in 188
each instance was assigned as the previous day, both for precipitation amount data 189
and isotope composition, following standard practice for the U.K. Met Office. The 190
daily North Atlantic Oscillation (NAO) index was obtained from the U.S. National 191
Oceanic and Atmospheric Administration (NOAA) Climate Prediction Center 192
(http://www.cpc.ncep.noaa.gov). 193
194
Oxygen and hydrogen isotopes of water were analysed at NERC Isotope Geosciences 195
Facility at the British Geological Survey. For D/H analysis, the hydrogen was 196
liberated by Cr reduction, while 18O/16O were equilibrated with CO2 using an
197
IsoPrime (δ2
H) in conjunction with laboratory standards calibrated against NBS 199
standards. Long term analytical errors are 0.05‰ for δ18O and <1‰ for δ2
H. 200
201
Spatial patterns in daily 18
OP were mapped using the filled.contour3() program in R,
202
which uses the function akima() to perform bivariate data interpolation (Akima 1978). 203
Backward trajectories of air parcels arriving at the British Isles were computed using 204
the web-based HYbrid Single-Particle Lagrangian Integrated Trajectory (HYSPLIT) 205
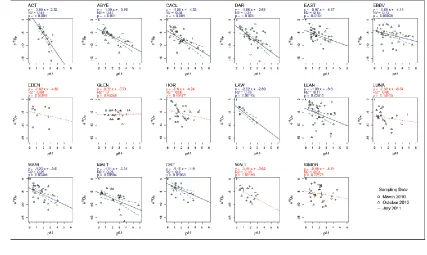
model (Draxler and Hess 1997; Draxler and Hess 1998; Draxler and Rolph 2015; 206
Rolph 2015) for a matrix of 63 locations between 5.7ºW, 50ºN and 2.7ºE, 58ºN. Back 207
trajectories were computed for air parcels arriving at 1500 m.a.s.l. at six-hourly 208
intervals prior to the time of water sampling at 9:00 hrs. Principle locations of 209
moisture uptake were estimated as the first point in a particular trajectory whereby the 210
specific humidity increased by >0.5 g/kg and atmospheric pressure was >900 hPa, 211
following Krklec and Dominguez-Villar (2014). 212
213
Results 214
215
Regression between daily 18
OP, maximum air temperature and precipitation amount
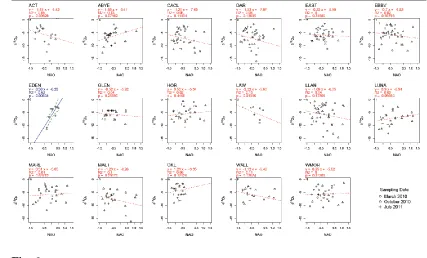
216
217
For the statistical analysis of daily precipitation isotope data, we treat the data from 218
January 2012 separately from those from March 2010, October 2010 and July 2011. 219
This is because the January 2012 sample contains observations from ~4 times as 220
many locations, yet over three days, which contrasts with the fewer (15-17) locations 221
over up to 19 days for the other sampling months. In all instances, relationships with 222
Gaussian distribution of regression residuals, following the reasoning outlined in 224
Fischer and Treble (2008) and Fischer and Baldini (2011); nonlinear relationships are 225
known in climate-isotope studies, such as in the discussion of Rayleigh fractionation 226
later in this paper, and root transformations are often applied to precipitation data in 227
climatology because precipitation data are typically skewed. Daily maximum 228
temperatures (Tmax) are used, since they relate to the temperature around noon on the 229
day of precipitation, whereas mean daily temperatures for the period of sampling (9 230
am - 9 am) are not consistently available. 231
232
The relationship between 18
OP, Tmax and P0.5 is explored first using all daily data
233
(excluding January 2012), and then with data subset according to month and site in 234
order to ascertain the consistency of relationships in time and space. Due to the 235
paucity of data, monthly subsets from each site were not analysed individually. When 236
all daily data are combined, there are weak yet statistically significant (p < 0.001) 237
relationships between 18
OP, P0.5 and Tmax (r2 = 0.17 and 0.02 respectively) but not
238
NAO (Figure 2). Significant regressions can also be observed between 18
OP and P0.5
239
when data are subset according to month, with slope coefficients varying between 240
March 2010 (slope = –1.45, r2 = 0.24), October 2010 (slope = –0.97, r2 = 0.14) and 241
July 2011 (slope = –0.85, r2 = 0.19) (Figure 3a-c). Significant regressions (p < 0.05) 242
did not exist between 18
OP and Tmax for monthly subsets for March or October 2010 243
(Figure 3d-e), however a weak (r2= 0.04, p = 0.01) relationship was observed for July 244
2011 (Figure 3f). The mean Tmaxfor the three sampled months varied markedly, from 245
3d-f). There were no significant regressions (p < 0.05) between 18OP and NAO
247
where data were subset according to month (Figure 3g-i). 248
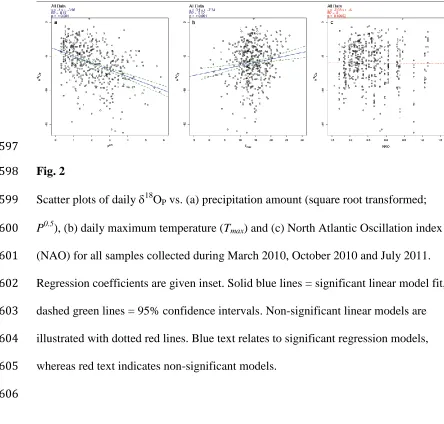
249
When data are subset according to sampling location (incorporating data from each 250
month excluding January 2012), significant regressions between 18
OP and P0.5 can be
251
observed with p < 0.05 at 11 of the 17 sites (Figure 4). Those sites that did not exhibit 252
significant precipitation effects were Edenbridge (EDEN), Glenmore Lodge (GLEN), 253
Horsham (HOR), Lunan Valley (LUNA), Wallingford (WALL) and West Moors 254
(WMOR) (Figure 4). Five sites exhibited significant P0.5 effects with r2 > 0.3, and 255
those were Acton (ACT), Aboyne (ABYE), Carlton-in-Cleveland (CACL), Darvel 256
(DAR) and Lawkland (LAW). Given the paucity of data, it was not possible to 257
rigorously test for differences in the within-site P0.5 vs. 18OP relationships between
258
months, although there is no obvious indication that data from March 2010, October 259
2010 or July 2011 exhibit markedly different response patterns to the regression 260
models based on all months combined (Figure 4). 261
262
Five of the 17 site-specific regressions between Tmax and 18OP are significant to p <
263
0.05, data from Acton (ACT), Ebbr Vale (EBBV), Glenmore Lodge (GLEN), 264
Marlborough (MARL) and Wallingford (WALL) (Figure 5). The slope coefficients 265
for those relationships range between +0.14 at Glenmore Lodge (GLEN) to +0.37 at 266
Acton (ACT). For most sites, particularly those with significant Tmaxeffects, there is 267
visible clustering of data according to month (Figure 5). There is only one site, 268
Edenbridge (EDEN) which exhibits a significant (p < 0.05, r2 = 0.58) positive 269
relationship with NAO, however only a single month (March) was monitored at that 270
also exhibited significant regressions between March 18
OP and NAO (Supplementary
272
Information, Figure S1). 273
274
The spatial distribution of regression coefficients for P0.5 and Tmax vs. 18OP are
275
mapped in Figure 7. Sites which exhibit significant regression coefficients between 276
18
OP and P0.5 are distributed across the British Isles, however the sites with the
277
largest r2 and lowest (most negative) slopes vs. P0.5 are those in northern England and 278
Scotland, with the exception of Acton (ACT) in central England (Figures 7a and 7b). 279
Two sites in Scotland, Glenmore Lodge (GLEN) and Lunan Valley (LUNA), exhibit 280
no significant relationship with P0.5 (Figures 7a and 7b). Only five sites produced a 281
significant regression between 18
OP and Tmax, of which four are situated in central
282
and southern England (Figures 7c and 7d). One northern site – Glenmore Lodge 283
(GLEN), Scotland, also exhibited a significant relationship with temperature, whilst 284
three sites on the southern coast of England exhibited no significant temperature 285
effect (Figures 7c and 7d). 286
287
Spatial distribution of daily 18
OP
288
289
Over the sampling period, the geographical distribution of 18
OP across Great Britain
290
varied markedly from day to day. On some occasions, e.g. 13th March 2010 (Figure 291
S2), 17th October 2010 (Figure S3) and 21st July 2011 (Figure S4), 18OP values were
292
largely homogenous (within a 2‰ range) across the entire spatial gradient. However, 293
on other occasions, e.g. 4th October 2010, 27th October 2010 (Figure S3) and 9th July 294
2011 (Figure S4), marked spatial gradients in 18
OP occurred, up to a maximum range
295
frequency and location of precipitation samples for a particular day, however the day 297
to day differences in spatial range measured from ~15 sites is equivalent to that 298
observed over the three days sampled in January 2012 (Figure 8), where the spatial 299
gradient varies from 17‰ on 23rd
January 2012 to 10‰ on 25th January 2012, despite 300
over 60 stations being sampled on both occasions. Most frequently, daily 18
OP
301
patterns show a decrease along a south-west to north-east gradient, although there are 302
numerous exceptions to this rule, with occasional inversions in the south-west to 303
north-east gradient, changes in the direction of that gradient and bimodal distributions 304
(e.g. 20th March 2010, 22nd October 2010 and 6th July 2011; Figures S2-S4). The most 305
depleted 18
OP values measured were collected at sites in Scotland and northern
306
England. Although a larger density of samples is preferable in order to trace spatial 307
patterns in daily 18
OP, reduction in sample number to as few as four sites still allows
308
for some coherent patterns to be observed. On days where precipitation fell at all 309
locations, the pattern which emerges from 14 sampling sites (e.g. 17th July 2011, 310
Figure S4) is not dissimilar to those which can be observed based upon >80 sites (e.g. 311
24th January 2012; Figure 8c). 312
313
Spatial patterns in 18
OP are clearly best captured in January 2012, where the sample
314
density was highest (Figure 8). On 23rd January 2012, the lowest 18OP values of –
315
18.5‰ were obtained from rain falling in eastern-central Scotland, with a pattern of 316
increasing 18
OP to the north, west and particularly to the south of that location
317
(Figure 8c). On this date, western England and Wales, Northern Ireland and southeast 318
England experienced the highest 18
OP values of upto 0.58‰, with a southward
319
pattern of increasing 18
OP along the eastern coast of England (Figure 8c). On 24th
320
January 2012, a marked longitudinal gradient was observed, with declining 18
OP
along an east-northeast trajectory (Figure 8f). Lowest 18
OP values on 24th January
322
were observed along the eastern coast of England and Scotland (Figure 8f). The 25th 323
January 2012 saw a shift towards low 18
OP (–15 to –10‰) in the north west of
324
Scotland, Northern Ireland, north west England and northern Wales, with higher 325
18
OP in the south of England (Figure 8i). HYSPLIT modelling indicates that two
326
moisture bearing air masses crossed the British Isles on January 23rd, 2012 (Figures 8a 327
and 8b). The first parcel collected water vapour over the Norwegian Sea, east of 328
Iceland and collided with the northern British Isles along a north-westerly trajectory 329
(Figure 8a). The second air mass collected moisture from the central Atlantic Ocean 330
and collided with the British Isles along a south-westerly trajectory. On the 24th 331
January 2012, HYSPLIT modelling indicates that the majority of moisture was 332
derived from the central Atlantic, impacting the British Isles along a westerly/south-333
westerly trajectory (Figure 8d). On the 25th January 2012, HYSPLIT modelling 334
indicates moisture arriving from a south-westerly trajectory, having markedly 335
changed direction beforehand above the Bay of Biscay to the south (Figure 8g). 336
337
The relationship between the spatial distribution of 18
OP and synoptic weather types,
338
as classified through the Lamb Weather Type scheme (LWT; Jones et al. 1993; Lamb 339
1950) is explored in Figures 9 and 10. The majority of rainfall events during the 340
studied period were associated with two principle weather types: Cyclonic (LWT = 341
20) and South Westerly (LWT = 15) (Figure S5). Under the influence of Cyclonic 342
weather types, 18
OP exhibits a pattern of higher values in southern and south-west
343
England contrasting with a frequently occurring region of markedly lower 18
OP over
344
northern England and southern Scotland (Figure 9). Occasionally, those lower 18
OP
345
17th July 2011 (Figure 9). Higher 18OP values can also be observed to the far north
347
during these weather events, e.g. on 3rd October 2010, 8th July 2011 and 18th July 348
2011 (Figure 9). Under the influence of South Westerly weather, a consistent spatial 349
pattern in 18
OP is not evident and many of these days exhibit a narrow range of 18OP
350
(<5‰). On the 24th January 2012, 18
OP values largely exhibit a SW-NE gradient
351
across Great Britain, except for low 18
OP at Llansadwryn (LLAN), North Wales
352
(Figure 10). By contrast, on 10th October 2010, the lowest 18OP values were recorded
353
in the south west of England and Wales. On other days (e.g. 18th March 2010; 23rd 354
March 2010), the lowest or highest 18
OP values were recorded in northern-central
355
England. 356
357
Discussion 358
359
Daily monitoring of isotopes in rainfall, on the basis of 57 days and 17 sites, support 360
previous observations that square root transformed daily precipitation amount (P0.5) is 361
the most consistent predictor of daily 18
OP in maritime, mid-latitude regions (Baldini
362
et al. 2010; Fischer and Baldini 2011; Fischer and Treble 2008). All data combined 363
(including January 2012) define a daily function 18
OP-day = (–0.9)P0.5day – 4.7, r2 = 364
0.1 (Figure 2a) which is very similar to the model derived by Baldini et al. (2010) 365
based on two years monitoring of event based 18
OP at Dublin, Ireland (Baldini et al.
366
2010; Fischer and Baldini 2011) and with the relationship between daily 18
OP and
367
P0.5 at Wallingford, England, between November 1979-October 1980 (data reported 368
by Darling and Talbot 2003). The P0.5 regression coefficients derived when data are 369
subset according to month (Figure 3) and by site (Figure 4) vary compared to those 370
three months studied, suggestive of a seasonally modulated relationship between 372
18
OP and P0.5 as described by Fischer and Baldini (2011). Indeed, the P0.5 coefficients
373
obtained here (Figure 3) are consistent with those predicted by Equation 8 in Fischer 374
and Baldini (2011) for March and October 2010 (–1.45 and –0.97 respectively) but 375
not for July 2011, where our data indicate a slope of –0.85 compared to a predicted – 376
0.41. Secondly, the P0.5 coefficients vary spatially: steeper negative slope coefficients 377
and higher r2 values are generally observed in northern England and Scotland 378
compared to larger slope coefficients and less frequent significant relationships at 379
sitesin southern England (Figure 7). One exception to this rule - Acton (ACT) - is 380
located in the English west midlands in the rain shadow of the Welsh mountains 381
(Figure 7a). We will discuss potential reasons for the variable 18
OP–P0.5 relationship
382
at the end of this section. 383
384
The relationship between air temperature and daily 18
OP is less convincing. A weak
385
yet significant correlation is observed between daily 18
OP and daily maximum air
386
temperature (Tmax) based on all samples (Figure 2b). At first glance, this apparent 387
temperature effect appears to support previous observations, based on global 388
compilations of monthly data (e.g. Araguas-Araguas et al. 2000; Dansgaard 1964; 389
Rozanski et al. 1993; Rozanski et al. 1992). Furthermore, a temperature effect has 390
some theoretical grounding, since changes in temperature affect the vapour-liquid 391
fractionation factor during condensation (Dansgaard 1964; Merlivat 1978; Merlivat 392
and Nief 1967). However the relationship between Tmax and 18OP does not
393
consistently hold when samples are subset according to month or site, with only the 394
July 2011 monthly subset and 5 out of 17 site-specific analyses producing a 395
occurrence of significant relationships with Tmax varies spatially, with predominantly 397
southern and central sites exhibiting Tmax effects (Figure 7c and d). One of those sites 398
is Wallingford (WALL), for which Darling and Talbot (2003) observed significant 399
positive correlations between daily average air temperature and daily 18
OP for winter
400
(DJF) and autumn (OSN) precipitation (sampled between November 1979 - October 401
1980). The coefficients of those 1979-1980 models are similar to those derived for 402
July 2011 (Figure 3f). However, Darling and Talbot (2003) did not observe a 403
significant relationship with temperature during summer precipitation at Wallingford, 404
further highlighting the inconsistency of temperature-based regression with daily 405
18
OP. Three sites along the southern English coast exhibit no significant relationship
406
between 18
OP and Tmax, whilst another site, Glenmore Lodge in Scotland, does
407
(Figures 7c and 7d). It is therefore not possible to make generalisations concerning the 408
spatial patterns in Tmax effects upon 18OP. One potential explanation for the
409
correlation between Tmax and 18OP when all data are combined (Figure 2), but the
410
absence of such a correlation when data are subset according to month (Figure 3), is 411
that both Tmax and 18OP exhibit strong seasonal components which do not affect
412
regressions on sub-monthly timescales. However, although both vary seasonally, a 413
casual relationship between Tmax and 18OP is not certain and their correlation may
414
instead relate to seasonal changes in a variety of conditions, including moisture 415
source, trajectory, weather type and land surface feedbacks (Baldini et al. 2010; 416
Fischer and Treble 2008; Treble et al. 2005). 417
418
Changes in the North Atlantic Oscillation (NAO) (Hurrell 1995) would be expected to 419
influence 18
OP as it reflects the position of the westerly jet as a function of air
420
trajectory of weather systems and water vapour travelling to the British Isles. 422
However, we observe no significant regression between 18
OP and NAO, either when
423
all data are combined or when data are subset according to month (Figures 2c and 3g-424
i). It should be noted that our data do not comprehensively represent winter (DJF) 425
conditions in the British Isles, the season when NAO is considered to have it’s largest 426
effect upon 18
OP (Baldini et al. 2008; Fischer and Baldini 2011). Except for January
427
2012, for which three days sampling is insufficient to examine the role of temporal 428
changes in the NAO, the closest month to winter sampled in this study is March 2010, 429
whereby three sites exhibit significant correlations between NAO and 18
OP:
430
Horsham, West Moors and Edenbridge (for which March 2010 are the only samples 431
collected) (Figure 6 and Figure S1). Otherwise, none of the other sites, or months 432
examined, exhibit significant effects of the NAO upon British 18
OP. A generally
433
weak effect of the NAO would contrast with the conclusions of previous studies that 434
the NAO has a significant, positive relationship with winter 18
OP (Baldini et al.
435
2008; Fischer and Baldini 2011). However, the limited coverage of winter rainfall 436
through this study precludes further comment on the effect of NAO upon 18
OP and
437
further sampling of daily winter rainfall across a spatial gradient is required to fully 438
address this uncertainty. 439
440
The spatial and temporal variability in P0.5and Tmax coefficients indicates that models 441
derived from individual sites cannot be unilaterally applied, even within relatively 442
small geographical areas such as the British Isles. However, those variable 443
coefficients do provide potential insights into the mechanisms behind the relationship 444
between 18
OP, P0.5and Tmax. Rayleigh distillation is a commonly cited simple model
445
As a finite parcel of moisture condenses, Rayleigh fractionation predicts that the 447
initial stages of condensation will be associated with relatively little change in 18
OP.
448
For example, condensation of the initial 50% of vapour is predicted to equate to an ~ 449
–8‰ decrease in 18
OP. By contrast, condensation of the final 20% of vapour within a
450
parcel is predicted to impart an isotopic depletion of >30‰ (Dansgaard 1964). The 451
degree of rainout from a vapour parcel is therefore likely to be a simple, first order 452
mechanism which results in an inverse correlation between 18
OP and rainfall amount.
453
In reality, a pure Rayleigh distillation is unlikely to occur within a cloud, due to the 454
resupply of moisture from evapotranspiration and mixing between vapour parcels. 455
Furthermore, a wide range of factors introduce complexity, from changes in the 456
isotopic composition of the initial vapour parcel (reflecting the conditions at it’s 457
origin and subsequent mixing and phase changes during transit) to the subsequent 458
modification of raindrop 18
O due to evaporation and equilibrium exchange with 459
ambient vapour (Celle-Jeanton et al. 2004; Gedzelman and Arnold 1994). 460
Nevertheless, some degree of Rayleigh fractionation of atmospheric vapour remains a 461
viable explanation for some of the observed relationships between 18
OP and
462
precipitation amount, whereby weather events associated with a high amount of 463
precipitation become progressively isotopically depleted. The rain out effect is non-464
linear and likely to result in heterogeneous spatial and temporal patterns. In particular, 465
low altitude, coastal sites more frequently encounter vapour parcels in their initial 466
stages of moisture depletion, and consequently precipitation at those locations is less 467
likely to exhibit a marked sensitivity to rainfall amount. By contrast, high altitude and 468
inland sites encounter vapour parcels that have undergone a larger degree of prior 469
rainout, meaning that subsequent condensation and precipitation should exhibit 470
progressive rainout may provide one explanation for the spatial and temporal 472
variability in the relationship between 18
OP and rainfall amount, whereby 18OP is
473
more sensitive to rainout effects in northern Britain, downstream of the direction of 474
the prevailing weather (Figure 7). By contrast, southern, low elevation sites are less 475
likely to be susceptible to rainout effects and therefore may exhibit correlations with 476
other variables, including temperature and changes in oceanic moisture source. It is 477
important to recognise that due to the temporal migration of weather trajectories, 478
spatial patterns in 18
OP and associated correlations with climate variables are
479
unlikely to remain constant in time. A more detailed elucidation of the mechanisms 480
behind isotope fractionation in daily British rainfall could be achieved using isotope 481
enabled climate models, validated or trained against spatially resolved data such as 482
those presented here (Langebroek et al. 2011; Risi et al. 2010). Such an analysis is 483
beyond the scope of this paper but would represent a valuable direction for future 484
research. 485
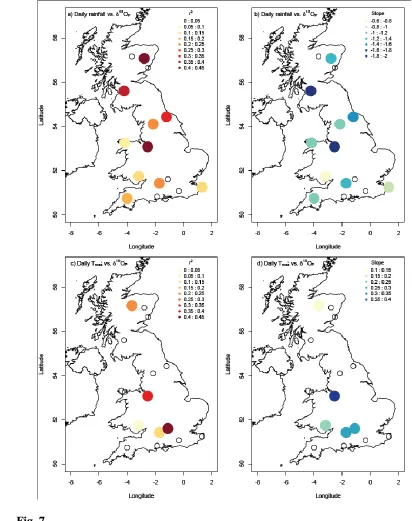
486
Spatial patterns in daily 18
O relate to weather types 487
488
Analysis of 18
OP from a highly resolved spatial context provides a means of further
489
deciphering the controls over 18
OP. This is particularly apparent for the three days in
490
January 2012 for which 70 sites provided 18
OP data (Figure 8). On 23rd January
491
2012, the passage of an occluded front, with low pressure centres to the east and north 492
west of the British Isles resulted in a complex weather pattern (Figure 8b). The 493
majority of atmospheric flow approached the British Isles from the southwest, 494
accounting for the gradient of decreasing 18
OP along that trajectory in southern
495
England and Wales (Figure 8a. However, the markedly low 18
OP values measured
from central Scotland relate to northerly winds travelling along a trough which 497
developed to the north west of Scotland and brought air masses from near Iceland to 498
the British Isles (Figure 8b). On the 24th January, 2012, the previous day’s complex 499
weather had passed, and eastern England and Scotland experienced South Westerly 500
weather characterised by a warm front passing perpendicular to the east coast, leading 501
to a characteristic east-west 18
OP gradient suggestive of progressive rainout (Figures
502
8d-f). On 25th January 2012, a further cold front arrived in north western Scotland and 503
England and Northern Ireland resulting in moderate isotopic depletion of rainfall in 504
the west, and limited precipitation in the south east (Figures 8g-i). 505
506
The coherency of daily 18
OP patterns for the British Isles under different
weather-507
types highlights significant potential for developing an isotope-based synoptic 508
typology, which could then be applied to palaeoclimate research. To do so rigorously 509
would require a much more detailed study, however the data obtained to date 510
highlight some encouraging patterns. The rainfall events sampled through this study 511
predominantly occurred during two common weather types: Cyclonic and South 512
Westerly weather types (according to the Lamb Weather Type scheme). Although it is 513
not possible to make conclusive statements on the way these weather types are 514
manifest in daily 18
OP over the British Isles, there is evidence to suggest that the
515
rotational flow associated with Cyclonic weather types is manifest in a progressive 516
south-north 18
OP gradient, which curves around a region of maximum isotopic
517
depletion (lowest 18
OP), representative of the epicentre of the cyclonic vortex (Figure
518
9). The patterns associated with Cyclonic weather types in the British Isles are 519
similar, if smaller, to those related to cyclonic precipitation in the eastern United 520
1996). By contrast we are not yet able to make generalisations concerning the spatial 522
18
OP patterns associated with South Westerly weather types, for which the data to
523
date exhibit less coherent patterns in space (Figure 10). These varying isotopic spatial 524
gradients associated with South Westerly weather types may reflect complex or 525
heterogeneous rainfall patterns across the country and associated fractionation 526
processes. Within this context, complexities arise owing to variability in the direction 527
of flow and the interaction between numerous air parcels. For example, our data to 528
date are insufficient to identify and evaluate the effect of frontal rainfall upon 18
OP,
529
however it is expected that the passage of, and interaction between, warm and cold 530
fronts would cause significant intra- and inter-daily variability in 18
OP due to
531
localised changes in air pressure, the altitude of precipitation formation and air 532
temperature (Celle-Jeanton et al. 2004; Celle-Jeanton et al. 2001). Furthermore, a 533
number of weather types are only sporadically captured in our dataset (Figure S5) and 534
future research should therefore attempt to undertake a more detailed and prolonged 535
monitoring project in order to develop a synoptic typology of 18
OP for the British
536
Isles. 537
538
Conclusion 539
540
Daily monitoring of the oxygen isotope composition of rainfall from multiple sites 541
across the British Isles reveals a relationship between rainfall amount (square root 542
transformed; P0.5) and 18OP, which emerges when all data are combined and when
543
the data are subset according to month or site. By contrast, daily maximum air 544
temperature (Tmax) exerts a weaker and less consistent relationship and daily NAO 545
our data. The P0.5 and Tmaxregression coefficients and r2 vary seasonally, in support of 547
previous observations from Dublin, Ireland (Fischer and Baldini 2011). They also 548
vary spatially, with a greater influence of temperature in southern sites, and greater 549
influence of precipitation amount at northern sites. We propose a simple explanation 550
that these spatio-temporal patterns in regression coefficients reflect the non-linear 551
influence of Rayleigh fractionation and rainout upon 18
OP as a vapour parcel
552
becomes progressively depleted. Future research involving the integration of climate 553
models with highly resolved data such as ours should be directed at testing this 554
interpretation. By mapping the distribution of daily 18
OP across the British Isles, we
555
are able to observe patterns that may be characteristic of some weather types, namely 556
Cyclonic weather types under the Lamb classification scheme. These observations are 557
a step towards an improved mechanistic understanding of the climate controls over 558
18
OP and a synoptic typology which will aid attempts to reconstruct past changes in
559
dominant weather patterns. 560
561
Acknowledgements 562
563
This research is heavily indebted to the voluntary weather monitors affiliated with the 564
U.K. Met Office and the Climate Observers Link, whose enthusiasm and diligence in 565
collecting daily rainfall samples was central to the conduct of this study – thank you. 566
In particular we thank Sarah Dunn, Ruth Brookshaw, Mike Cinderey, Mike Chalton, 567
John Walker, Jane Corey, David King, Kirsty Murfitt, Richard Griffith, Margaret 568
Airy, Donald Perkins, Malham Tarn FSC Field Centre Staff, Eric Gilbert, Roland Bol, 569
George Darling and Martin Rowley. We thank Joseph Bailey for assistance in 570
modelling. The research was supported by the U.K. Natural Environment Research 572
Council (NERC) through a Fellowship (NE/F014708/1) to JJT. MJ thanks the School 573
of Geography, Planning and Environmental Management at the University of 574
Queensland for a Visiting Fellowship during which some of this manuscript was 575
written. Three anonymous reviewers and the editor Jean Claude Duplessey are 576
thanked for their insightful comments on an earlier draft of this manuscript. 577
578
579
Table 1 581
Details of sites sampled during March 2010, October 2010 and July 2011. Site numbers relate to those mapped in Figure 1. Values within the 582
‘Sample months’ columns indicate the number of samples collected in each month, at each site. Details of nearby Met Office stations used to 583
complement data where no local temperature measurements were taken are given in the ‘Notes’ column. 584
585
Sample months
Site Site No. Latitude
(°N)
Longitude (°E)
Height (m.a.s.l.)
March 2010
October 2010
July
2011 Notes
Aboyne 1 57.07 -2.79 126 15 11
Acton 2 53.07 -2.55 44 10 10 Temperature data from MIDAS (site 1132; Reaseheath
Hall; 2km NE)
Carlton-in-Cleveland 3 54.43 -1.22 88 11 15 14
Darvel 4 55.60 -4.23 217 10 14 15
Eastry 5 51.25 1.31 32 10 15 11
Ebbw Vale 6 51.74 -3.18 303 10 15 14
Edenbridge 7 51.20 0.07 47 10
Glenmore Lodge 8 57.17 -3.68 344 13 17 Temperature data from MIDAS (site 118; Cairngorm
Chairlift; 4km S)
Horsham 9 51.07 -0.34 37 10 13 8
Lawkland 10 54.09 -2.34 176 10 Temperature data from MIDAS (site 513; Bingley;
44km SW)
Llansadwrn 11 53.26 -4.17 107 11 19 15
Lunan Vale 12 56.66 -2.51 19 15 15 Temperature data from MIDAS (site 15045; Crombie
Country Park; 19km SW)
Malham Tarn 13 54.10 -2.16 384 15 13
Marlborough 14 51.43 -1.73 142 10 15 2
Okehampton 15 50.74 -4.00 170 15 14 Temperature data from MIDAS (site 1345; East
Okement Farm; 4km S)
Wallingford 16 51.60 -1.11 50 10 9
West Moors 17 50.82 -1.88 17 10 13 12
Total samples 102 202 180
Figure Captions 589
590
Fig. 1 591
Topographic map of the British Isles (dark shaded areas = higher elevation), including 592
the location of the sampling sites used in this study. Open circles are those sites only 593
sampled in January 2012, whereas open boxes indicate the sites sampled during all 594
months. The numbers in the squares indicates the site number, as detailed in Table 1. 595
597
Fig. 2 598
Scatter plots of daily 18
OP vs. (a) precipitation amount (square root transformed;
599
P0.5), (b) daily maximum temperature (Tmax) and (c) North Atlantic Oscillation index 600
(NAO) for all samples collected during March 2010, October 2010 and July 2011. 601
Regression coefficients are given inset. Solid blue lines = significant linear model fit, 602
dashed green lines = 95% confidence intervals. Non-significant linear models are 603
illustrated with dotted red lines. Blue text relates to significant regression models, 604
whereas red text indicates non-significant models. 605
607
Fig. 3 608
Scatter plots of daily 18
OP vs. (a, d, g) precipitation amount (square root transformed,
609
P0.5), (b, e, h) daily maximum temperature (Tmax) and (c, f, i) North Atlantic 610
Oscillation index (NAO) for all samples subset according to month of sampling 611
collected during March 2010, October 2010 and July 2011. Regression coefficients 612
are given inset. Solid blue lines = linear model fit and dashed green lines = 95% 613
confidence intervals for significant regressions. Non-significant linear models are 614
illustrated with dotted red lines. Blue text relates to significant regression models, 615
617
Fig. 4 618
Scatter plots of daily 18
OP vs precipitation amount (square root transformed, P0.5)
619
subset by site for all samples collected during March 2010 (open circles), October 620
2010 (open triangles) and July 2011 (crosses). Regression coefficients are given inset. 621
Solid blue lines = linear model fit and dashed green lines = 95% confidence intervals 622
for significant regressions. Non-significant linear models are illustrated with dotted 623
red lines. Blue text relates to significant regression models, whereas red text indicates 624
non-significant models. 625
627
Fig. 5 628
Scatter plots of daily 18
OP vs. daily maximum temperature (Tmax) subset by site for
629
all samples collected during March 2010 (open circles), October 2010 (open triangles) 630
and July 2011 (crosses). Regression coefficients are given inset. Solid blue lines = 631
linear model fit and dashed green lines = 95% confidence intervals for significant 632
regressions. Non-significant linear models are illustrated with dotted red lines. Blue 633
text relates to significant regression models, whereas red text indicates non-significant 634
models. 635
637
Fig. 6 638
Scatter plots of daily 18
OP vs. North Atlantic Oscillation index (NAO) subset by site
639
for all samples collected during March 2010 (open circles), October 2010 (open 640
triangles) and July 2011 (crosses). Regression coefficients are given inset. Solid blue 641
lines = linear model fit and dashed green lines = 95% confidence intervals for 642
significant regressions. Non-significant linear models are illustrated with dotted red 643
lines. Blue text relates to significant regression models, whereas red text indicates 644
non-significant models. 645
647
Fig. 7 648
Map of regression coefficients against daily rainfall amount (square root transformed, 649
P0.5) and daily maximum temperature (Tmax) for all sites in Table 1, except Edenbridge 650
and Lawkland, for which only one month’s data were collected. (a) r2 statistic for P0.5
651
vs. 18
OP; (b) slope for P0.5 vs. 18OP; (c) r2 statistic for Tmax vs. 18OP; (d) slope for
652
Tmax vs. 18OP. Open circles indicate the location of sites for which no significant
653
655
Fig. 8 656
Weather and isotope maps for 23rd, 24th and 25th January 2012. (a, d, g) HYSPLIT 96 657
hour back trajectories for air parcels arriving at a matrix of 63 points across the 658
British Isles. All simulations start at 1500 m.a.s.l. Grey lines indicate all back 659
trajectories, red lines are those whereby significant moisture uptake is estimated. The 660
length of the red lines indicates the distance from the initial site of moisture uptake. 661
(b, e, h) Daily weather maps, as reported by the U.K. Met Office. (c, f, i) The spatial 662
distribution of 18
OP based on upto 70 monitoring stations, collecting precipitation
663
water at 9 am the following day. 664
666
Fig. 9 667
Spatial pattern of 18
OP occurring on days with a Cyclonic weather pattern (Lamb
668
Weather Type = 20) 669
670
[image:35.595.87.503.70.290.2]671
Fig. 10 672
673
Spatial pattern of 18
OP occurring on days with a South Westerly weather pattern
674
(Lamb Weather Type = 15) 675
References 677
678
Akima H (1978) A method of bivariate interpolation and smooth surface fitting for 679
irregularly distributed data points ACM Transactions on Mathematical 680
Software 4:148-159 doi:10.1145/355780.355786 681
Araguas-Araguas L, Froehlich K, Rozanski K (2000) Deuterium and oxygen-18 682
isotope composition of precipitation and atmospheric moisture Hydrological 683
Processes 14:1341-1355 684
Baker A et al. (2011) High resolution delta O-18 and delta C-13 records from an 685
annually laminated Scottish stalagmite and relationship with last millennium 686
climate Global and Planetary Change 79:303-311 687
doi:10.1016/j.gloplacha.2010.12.007 688
Baldini LM, McDermott F, Baldini JUL, Fischer MJ, Moellhoff M (2010) An 689
investigation of the controls on Irish precipitation d18O values on monthly 690
and event timescales Climate Dynamics 35:977-993 691
Baldini LM, McDermott F, Foley AM, Baldini JUL (2008) Spatial variability in the 692
European winter precipitation delta(18)O-NAO relationship: Implications for 693
reconstructing NAO-mode climate variability in the Holocene Geophysical 694
Research Letters 35 doi:10.1029/2007gl032027 695
Barbante C et al. (2006) One-to-one coupling of glacial climate variability in 696
Greenland and Antarctica Nature 444:195-198 doi:10.1038/nature05301 697
Bowen GJ, Wilkinson B (2002) Spatial distribution of delta O-18 in meteoric 698
precipitation Geology 30:315-318 699
Callow N, McGowan H, Warren L, Speirs J (2014) Drivers of precipitation stable 700
oxygen isotope variability in an alpine setting, Snowy Mountains, Australia 701
Journal of Geophysical Research-Atmospheres 119:3016-3031 702
doi:10.1002/2013jd020710 703
Celle-Jeanton H, Gonfiantini R, Travi Y, Sol B (2004) Oxygen-18 variations of 704
rainwater during precipitation: application of the Rayleigh model to selected 705
rainfalls in Southern France Journal of Hydrology 289:165-177 706
Celle-Jeanton H, Travi Y, Blavoux B (2001) Isotopic typology of the precipitation in 707
the Western Mediterranean region at three different time scales Geophysical 708
Research Letters 28:1215-1218 709
Crawford J, Hughes CE, Parkes SD (2013) Is the isotopic composition of event based 710
Sydney Basin, Australia? Journal of Hydrology 507:213-226 712
doi:10.1016/j.jhydrol.2013.10.031 713
Dansgaard W (1964) Stable Isotopes in Precipitation Tellus 16:436-468 714
Dansgaard W et al. (1993) Evidence for General Instability of Past Climate from A 715
250-Kyr Ice-Core Record Nature 364:218-220 716
Darling WG, Talbot JC (2003) The O & H stable isotopic composition of fresh waters 717
in the British Isles. 1. Rainfall Hydrology and Earth System Sciences 7:163-718
181 719
Draxler RR, Hess GD (1997) Description of the HYSPLIT_4 modeling system. . 720
NOAA Technical Memo. ERL ARL-244. NOAA Air Resources Laboratory, 721
Silver Spring MD 722
Draxler RR, Hess GD (1998) An overview of the HYSPLIT_4 modelling system for 723
trajectories, dispersion and deposition Australian Meteorological Magazine 724
47:295-308 725
Draxler RR, Rolph GD (2015) HYSPLIT (HYbrid Single-Particle Lagrangian 726
Integrated Trajectory) NOAA Air Resources Laboratory, Silver Spring, MD 727
Evans MN, Schrag DP (2004) A stable isotope-based approach to tropical 728
dendroclimatology Geochimica Et Cosmochimica Acta 68:3295-3305 729
doi:10.1016/j.gca.2004.01.006 730
Fischer MJ, Baldini L (2011) A climate-isotope regression model with seasonally-731
varying and time-integrated relationships Climate Dynamics doi:DOI: 732
10.1007/s00382-011-1009-1 733
Fischer MJ, Treble PC (2008) Calibrating climate-delta O-18 regression models for 734
the interpretation of high-resolution speleothem delta O-18 time series Journal 735
of Geophysical Research-Atmospheres 113 doi:10.1029/2007jd009694 736
Gedzelman SD, Arnold R (1994) Modeling the Isotopic Composition of Precipitation 737
Journal of Geophysical Research-Atmospheres 99:10455-10471 738
Good SP, Mallia DV, Lin JC, Bowen GJ (2014) Stable Isotope Analysis of 739
Precipitation Samples Obtained via Crowdsourcing Reveals the 740
Spatiotemporal Evolution of Superstorm Sandy Plos One 9 741
doi:10.1371/journal.pone.0091117 742
Heathcote JA, Lloyd JW (1986) Factors Affecting the Isotopic Composition of Daily 743
Hoffmann G, Cuntz M, Werner M, Jouzel J, Aggarwal PK, Gat JR, Froehlich K 745
(2006) A systematic comparison between the IAEA/GNIP isotope network 746
and Atmospheric General Circulation Models: How much climate information 747
is in the water isotopes? In: Isotopes in the Water Cycle - Past, Present and 748
Future of a Developing Science. Springer, Berlin, pp 303-320 749
Hurrell JW (1995) Decadal Trends in the North-Atlantic Oscillation - Regional 750
Temperatures and Precipitation Science 269:676-679 751
Johnsen SJ et al. (2001) Oxygen isotope and palaeotemperature records from six 752
Greenland ice-core stations: Camp Century, Dye-3, GRIP, GISP2, Renland 753
and NorthGRIP Journal of Quaternary Science 16:299-307 754
Jones MD, Leng MJ, Arrowsmith C, Deuchar C, Hodgson J, Dawson T (2007) Local 755
d18O and d2H variability in UK rainfall. Hydrology and Earth System Science 756
Discussions 4 757
Jones MD, Roberts CN, Leng MJ, Turkes M (2006) A high-resolution late Holocene 758
lake isotope record from Turkey and links to North Atlantic and monsoon 759
climate Geology 34:361-364 760
Jones PD, Hulme M, Briffa KR (1993) A Comparison of Lamb Circulation Types 761
with An Objective Classification Scheme International Journal of Climatology 762
13:655-663 763
Jouzel J, Hoffmann G, Koster RD, Masson V (2000) Water isotopes in precipitation: 764
data/model comparison for present-day and past climates Quat Sci Rev 765
19:363-379 766
Kohn MJ, Welker JM (2005) On the temperature correlation of delta O-18 in modem 767
precipitation Earth and Planetary Science Letters 231:87-96 768
doi:10.1016/j.epsl.2004.12.004 769
Krklec K, Dominguez-Villar D (2014) Quantification of the impact of moisture 770
source regions on the oxygen isotope composition of precipitation over Eagle 771
Cave, central Spain Geochimica Et Cosmochimica Acta 134:39-54 772
doi:10.1016/j.gca.2014.03.011 773
Lachniet MS, Patterson WP (2009) Oxygen isotope values of precipitation and 774
surface waters in northern Central America (Belize and Guatemala) are 775
dominated by temperature and amount effects Earth and Planetary Science 776
Letters 284:435-446 doi:10.1016/j.epsl.2009.05.010 777
Lamb HH (1950) Types and spells of weather around the year in the British Isles - 778
annual trends, seasonal structure of the year, singularities Quarterly Journal of 779
Langebroek PM, Werner M, Lohmann G (2011) Climate information imprinted in 781
oxygen-isotopic composition of precipitation in Europe Earth and Planetary 782
Science Letters 311:144-154 783
Lawrence JR, Gedzelman SD (1996) Low stable isotope ratios of tropical cyclone 784
rains Geophysical Research Letters 23:527-530 785
Liebminger A, Haberhauer G, Papesch W, Heiss G (2006) Correlation of the isotopic 786
composition in precipitation with local conditions in alpine regions Journal of 787
Geophysical Research-Atmospheres 111 788
Merlivat L (1978) Molecular diffusivities of (H2O)-O-16, HD16O and (H2O)-O-18 in 789
gases Journal of Chemical Physics 69:2864-2871 doi:10.1063/1.436884 790
Merlivat L, Jouzel J (1979) Global Climatic Interpretation of the Deuterium-Oxygen-791
18 Relationship for Precipitation Journal of Geophysical Research-Oceans and 792
Atmospheres 84:5029-5033 793
Merlivat L, Nief G (1967) Fractionment isotopique lors des changements detat solide-794
vapeur et liquide-vapeur de leau a des temperatures inferieures a 0 degrees C 795
Tellus 19:122-127 796
PAGES 2k Consortium (2013) Continental-scale temperature variability during the 797
past two millennia Nature Geoscience 6:339-346 798
Petit JR et al. (1999) Climate and atmospheric history of the past 420,000 years from 799
the Vostok ice core, Antarctica Nature 399:429-436 800
Risi C, Bony S, Vimeux F, Jouzel J (2010) Water-stable isotopes in the LMDZ4 801
general circulation model: Model evaluation for present-day and past climates 802
and applications to climatic interpretations of tropical isotopic records Journal 803
of Geophysical Research 115:D24123 804
Robertson I, Waterhouse JS, Barker AC, Carter AHC, Switsur VR (2001) Oxygen 805
isotope ratios of oak in east England: implications for reconstructing the 806
isotopic composition of precipitation Earth and Planetary Science Letters 807
191:21-31 808
Rolph GD (2015) Real-time Environmental Applications and Display sYstem 809
(READY). NOAA Air Resources Laboratory, Silver Springs, MD 810
Rozanski K, Araguas-Araguas L, Gonfiantini R, Swart PK, Lohman KC, McKenzie J, 811
Savin SM (1993) Isotopic patterns in modern global precipitation. In: Climate 812
change in continental isotopic records, vol 78. Geophysical Monograph. 813
Rozanski K, Araguasaraguas L, Gonfiantini R (1992) Relation Between Long-Term 815
Trends of O-18 Isotope Composition of Precipitation and Climate Science 816
258:981-985 817
Schmidt GA, LeGrande AN, Hoffmann G (2007) Water isotope expressions of 818
intrinsic and forced variability in a coupled ocean-atmosphere model Journal 819
of Geophysical Research-Part D-Atmospheres 112:1-18 820
doi:10.1029/2006jd007781 821
Shakun JD, Carlson AE (2010) A global perspective on Last Glacial Maximum to 822
Holocene climate change Quat Sci Rev 29:1801-1816 823
Sodemann H, Masson-Delmotte V, Schwierz C, Vinther BM, Wernli H (2008) 824
Interannual variability of Greenland winter precipitation sources: 2. Effects of 825
North Atlantic Oscillation variability on stable isotopes in precipitation 826
Journal of Geophysical Research-Atmospheres 113 827
doi:10.1029/2007jd009416 828
Treble PC, Budd WF, Hope PK, Rustomji PK (2005) Synoptic-scale climate patterns 829
associated with rainfall delta O-18 in southern Australia Journal of Hydrology 830
302:270-282 831
Tyler JJ, Leng MJ, Sloane HJ, Sachse D, Gleixner G (2008) Oxygen isotope ratios of 832
sedimentary biogenic silica reflect the European transcontinental climate 833
gradient Journal of Quaternary Science 23:341-350 834
Vachon RW, White JWC, Gutmann E, Welker JM (2007) Amount-weighted annual 835
isotopic (delta O-18) values are affected by the seasonality of precipitation: A 836
sensitivity study Geophysical Research Letters 34 doi:10.1029/2007gl030547 837
von Grafenstein U, Erlenkeuser H, Muller J, Trimborn P, Alefs J (1996) A 200 year 838
mid-European air temperature record preserved in lake sediments: An 839
extension of the delta O-18(P)-air temperature relation into the past 840
Geochimica et Cosmochimica Acta 60:4025-4036 841
Wang YJ et al. (2008) Millennial- and orbital-scale changes in the East Asian 842
monsoon over the past 224,000 years Nature 451:1090-1093 843
doi:10.1038/nature06692 844
845