Soil Penetration Resistance and Tree Root Development
D. SINNETT*, G. MORGAN, M. WILLIAMS and T.R. HUTCHINGS
Forest Research, Alice Holt Lodge, Wrecclesham, Farnham, Surrey, GU10 4LH, UK. *Corresponding author.
Abstract
Current UK guidance suggests that a ‘rootable’ soil profile of at least 1.0 m depth should be sufficient to allow adequate rooting of the majority of species in a range of soil types and climatic conditions (Moffat, 1995). However, there is some uncertainty as to what constitutes a loosened soil profile in terms of penetration resistance. In this study the root development of Italian alder, Japanese larch, Corsican pine and birch was assessed after five years of tree growth. These data were compared to penetration resistance measured using both a cone penetrometer and a ‘lifting driving tool’ (dropping weight penetrometer). Tree root number and percentage were significantly reduced by increasing soil penetration resistance measured with both the cone penetrometer (P<0.050) and the ‘lifting driving tool’ (P=0.011 and P=0.008 respectively). The vast majority of roots were recorded in soils with a penetration resistance of less than 3 MPa (90.7 %) with a significant amount in the less than 2 MPa class (70.2 %). Root development of Italian alder, Japanese larch and birch all showed a similar pattern, but Corsican pine appeared to be capable of rooting into more compact soils. The ‘lifting driving tool’ can be used as an alternative measure of soil penetration resistance. This equipment is more cost effective, easier to use and capable of measurements at a greater depth than the cone penetrometer. The majority of Japanese larch and birch roots (84.3 %) were recorded in soils where it took less than 15 impacts to penetrate one 10 cm soil depth increment. The modelled data also suggests that a penetration resistance of 2 and 2.5 MPa relates to 10 and 15 impacts respectively.
Introduction
Soil compaction is often responsible for the poor performance or failure of tree planting in both land regeneration projects and within existing woodlands. Compaction occurs as a result of soil stripping, storage and placement and from the trafficking of heavy machinery during restoration and timber harvesting. It alters the moisture regime of the soil and can impede the growth of roots so that the tree is not able to draw water or nutrients at depth; poor root development can also make mature trees more susceptible to wind-throw. Current UK best practice recommendations are that generally a ‘rootable’ soil depth of at least 1.0 m should be provided for successful woodland planting; this guidance covers the range of species, soil types and climatic conditions that would normally be expected within the UK (Moffat & McNeill, 1994; Moffat, 1995).
Penetration resistance, recorded using a penetrometer, is used to assess the degree of soil compaction, often to determine whether cultivation is required and, post-cultivation, whether sufficient soil loosening has been achieved. The penetrometer measures the force, expressed in MPa, required to drive a metal cone progressively deeper into the soil. It is essential that the values obtained using a penetrometer can be related to the potential root development both to save the costs involved in unnecessary cultivation and to ensure that cultivation has been successful. This is particularly important in the case of tree establishment where there is only one real opportunity for cultivation as the trees are likely to be present on the site for a considerable number of years and any adverse effects of compaction may not be observed until several years have passed.
This paper uses the data obtained during a deep cultivation trial to predict the penetration resistance value at which the root development is significantly impeded. In addition to the standard cone penetrometer the root development data are also related to the penetration resistance measured with the ‘lifting driving tool’ as this equipment offers the ability to assess compaction to a greater depth than the penetrometer.
Study site and methods
1984). Prior to gravel extraction the regional slope was almost level at an altitude of 100 m above sea level (Moffat & Boswell, 1997). Average annual rainfall is 657 mm (Meteorological Office, 2005).
During sand and gravel extraction the soil material is removed and stored on site. The gravel is then removed to the top of the Bagshot Beds. During restoration, a series of ridges were constructed 30 m wide and 1.5 m high according to Forestry Commission recommendations (Wilson, 1985). The ridge and furrow landform was used at Bramshill to minimise the risk of waterlogging as the site has a relatively high watertable. The ridges were then cross ripped to 0.5 m at a tine spacing of approximately 1.1 m using a winged tine ripper during August 2000. No further operations had been carried out prior to this study. Signs of original ripping were still present with some subsequent soil erosion and resettlement.
To allow for soil heterogeneity across the study area, experimental treatment plots were grouped into blocks with similar soil properties. The study area was divided into three blocks (0.4 ha each) with each further divided into two plots of dimensions 55 m x 14 m with enough space between them to allow the movement of an excavator.
The cultivation treatments took place in June 2001 following a dry period when soil conditions were suitable for cultivation. No further mechanical trafficking over the treatment plots occurred in the five years following cultivation. The soil is an anthropic regosol (FAO, 1998) which has been created from sand and gravel extraction. The soil properties, sampled, as part of this trial, four years after cultivation, are shown in Table 1. The data suggest that the soil is relatively homogeneous across the site.
Cultivation treatments
The study consisted of two treatments; a complete cultivation to 1.1 m using an excavator and an unloosened control. Treatment type was randomised within each block giving three replicates of each. The complete cultivation method has not been expanded on here as this work does not compare the treatments; further details can be found in Sinnett et al. (2006).
Tree establishment
herbicide application and subsequent weed control was then carried every year according to Willoughby and Dewar (1995).
Each plot was divided into four sub-plots with one species in each sub-plot; their locations were randomised between blocks but not within them. There were 7 x 7 trees in each sub-plot, including a guard row of trees around each sub-plot, giving 100 sample trees, 25 of each species, in each plot.
Assessments
Penetration resistance. Penetration resistance was recorded 4 yr after cultivation, using a modified Bush
recording cone penetrometer (Anderson et al., 1980). The assessments were carried out when the soil was at field capacity (November 2005) in an attempt to standardise the effects of soil moisture on penetration resistance values; 5 soil samples were taken every 10 cm to a depth of 50 cm from near each tree and analysed for gravimetric moisture content and there was found to be no significant difference between the treatments (repeated measures analysis using the method of residual maximum likelihood in Genstat version 8.1: cultivation treatment x depth interaction P>0.05, d.f.=16, Wald statistic with a chi-squared distribution=23.91). A board with holes at 0.1 m intervals was then laid alongside two adjacent trees in each of the four species sub-plots. Using a penetrometer twenty measurements were taken every 0.1 m along a 2 m transect from 0.2 m to the left of the first tree to 0.2 m to the right of the adjacent tree, giving a profile size of 1.90 x 0.45 m (0.855 m2). The penetrometer recorded the soil resistance at 0.03 m depth intervals down to a total depth of 0.45 m. It is possible that some soil loosening may have occurred following cultivation during the tree planting, but this would have been localised to the immediate positions around each tree, and relatively uniform across the treatments.
tree 1 to 0.2 m to the right of tree 2. This assessment was carried out on the same trees as the penetrometer, although the board was laid alongside the other side of trees. The ‘lifting driving tool’ was used at 0.2 m intervals along a 2 m transect.
Tree root development. The root development of two trees in each sub-plot was assessed during 2006 after
5 years of growth. In order to relate this to soil compaction the same trees were used as for the penetration resistance. The rooting assessment was based on that used by Yeatman (1955) and Böhm (1979). A trench was dug alongside the two trees, within 0.10 m of the tree stem, using an excavator. The trench ran from at least 0.5 m to the left of the first tree to at least 0.5 m to the right of the second and was approximately 1 m wide and 1.1 m deep. The face of the trench was ‘cleaned’ with a trowel and, if necessary, a palette knife to expose the roots and remove the smearing caused by the excavator bucket. A cocktail stick was placed into the soil profile wherever a root was protruding from the face of the trench, this was carried out immediately following exposure to minimise the risk of desiccation reducing the visibility of fine roots. The root positions were then recorded for a 1 m section of the trench, with the tree stem at the 0.5 m position on the horizontal axis and the depth from the soil surface as the vertical axis. The co-ordinates of the root and its diameter were measured, and the cocktail stick removed until all the roots within the section had been recorded. The diameter of each root was measured at the point at which it protruded from the soil using callipers down to a root size of 0.1 mm.
Statistical analysis
percentage of roots in each resistance class. The back transformed predicted proportions and associated standard errors were then computed.
Models were developed to assess the relationship between the number and percentage of roots in each penetration resistance class. Linear models of the average number and percentage of roots in each penetration resistance class, using both the penetrometer and the ‘lifting driving tool’ were fitted using Genstat version 8.1 (Genstat, 2005). The ‘lifting driving tool’ data were highly skewed with large numbers of impacts for a small number of roots, the models for this tool were therefore developed by limiting the data to 25 impacts and these data were also subjected to a log transformation prior to analysis. Tree species had a significant effect on the number of roots related to the penetrometer data (linear regression analysis, P<0.001, d.f.=50), therefore models were fitted for each species. However, tree species did not have a
significant effect on the ‘lifting driving tool’ data (linear regression analysis, P>0.050, d.f.=35), so models were fitted for the entire data set.
In order to ascertain the relationship between the values obtained using the penetrometer and those from the ‘lifting driving tool’ a model was developed from the two datasets. The measurements were averaged across the 2 m transect taken alongside each tree at each depth increment. Because the measurement depths were different between the methods the average penetration resistance across the 0.10 m increments were calculated from the penetrometer data (e.g. 0.03, 0.06 and 0.09 m penetration resistance averaged to give the 0 to 0.10 m increment) to a depth of 0.40 m. These data were again limited to 25 impacts using the ‘lifting driving tool’. Linear and exponential models of the penetration resistance values from the two
methods were fitted using Genstat version 8.1 (Genstat, 2005). As the linear can be viewed as a limit of the exponential, the models were compared using the difference in residual sum of squares of alternative models relative to the smallest residual mean square to determine the more appropriate model. This comparison is compared to an F-distribution with 1, n degrees of freedom where n is the residual degrees of freedom from the exponential model.
Results
Root development
Italian alder and birch followed similar patterns with 30.9 and 39.2 % of their roots in the less than 1.0 MPa class respectively, 73.7 and 73.8 % in the less than 2.0 MPa class respectively and 96.3 and 92.0 % in the less than 3.0 MPa class respectively. Corsican pine roots appeared more able to penetrate more compact soils, with only 13.7 % of the roots in the less than 1.0 MPa class, 62.9 % in the less than 2.0 MPa class and 83.9 % in the less than 3.0 MPa class. Of the remaining 16.1 %, 9.9 % were in soil with a penetration resistance of between 3.0 and 4.0 MPa. However, the Corsican pine data showed a much higher degree of variability than those for the other species making it difficult to draw any real conclusions about the ability of the roots of this species to penetrate into the different penetration resistance classes. Figure 2 shows the average rooting data for all species; an average of 70.2 % of roots was found in the less than 2 MPa class and 90.7 % in the less than 3 MPa class.
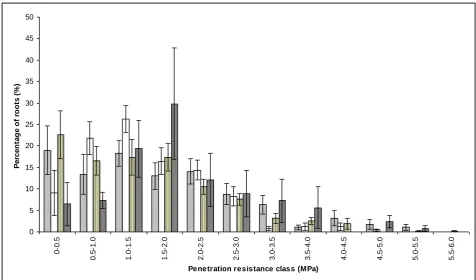
Figure 3 shows the number of roots in each penetration resistance class measured using the ‘lifting driving tool’. The only species subplots assessed using this method were those of Japanese larch and birch. When Japanese larch trees were assessed, 84.4 % and 92.6 % were found in the areas where it took less than fifteen or thirty impacts respectively to drive the point one 10 cm depth increment. The birch roots again followed a similar pattern with 84.3 and 94.7 % in the soil where less than fifteen and thirty impacts respectively were needed. Figure 4 shows the percentage of roots in each penetration resistance class averaged across both species. There were 84.3 % and 93.9 % of roots in the soil where it took less than fifteen and thirty impacts respectively.
Modelling
Tables 3 and 4 show the models for both the number of roots and the percentage of roots against each penetration resistance class measured with the penetrometer and ‘lifting driving tool’ respectively. All species showed a significant negative relationship between the number of their roots and the penetration resistance. When models were fitted to the number of roots against penetration resistance using the penetrometer there was a significant difference in the models between birch and the other three species; alder (P=0.032), Corsican pine (P<0.001) and Japanese larch (P=0.032). There were no significant differences in the models between the alder, Corsican pine and Japanese larch or between any species using the percentage of roots data. The relatively high P values presented for Corsican pine again demonstrate the variability in the root development for this species.
MPa=2.59-5.85(0.785I) Equation 1 (n=34, P<0.001, R2=0.43)
Discussion
The data presented here show that tree root numbers are significantly reduced as penetration resistance increases. It also suggests that tree root development is significantly impeded at penetration resistance values of between 2 and 3 MPa. All species had between 63 and 74 % of their roots in soils with penetration resistance values of less than 2 MPa and between 84 and 96 % in soils of less than 3 MPa. The roots of Corsican pine appeared to be more able to penetrate soils with higher penetration resistance values with a smaller proportion of roots in less than 1 MPa class and a larger proportion of roots in the less than 4 MPa class. Observations made in the field during the root development assessment suggested the roots of this species are woodier than those of the other species.
Other workers have found that root development is significantly impeded at penetration resistance values in excess of 1.3 and 1.5 MPa (Zou et al., 2001; Boone & Veen, 1994 respectively) and, effectively ceases when soil penetration resistance reaches 2 MPa (Taylor & Ratcliff, 1969) or 3 MPa (Greacen & Sands, 1990; Boone & Veen, 1994). These values have primarily been derived from agricultural crop root development, often based on laboratory studies that have used homogenised soil. However, in situ soils will often contain cracks or fissures that roots may exploit despite high penetration resistance readings. Penetrometers may overestimate the penetration resistance to which a root is subjected by between two and eight times (Whiteley et al., 1981; Bengough & Mullins, 1991). This is mainly due to the increased frictional resistance on the metal probe of the penetrometer, but also because the probe is forced vertically into the soil profile, whereas roots will develop around compacted areas (Bengough & Mullins, 1990). Our study using trees at the Bramshill site supports previous work on agricultural crops; the model for the mean data shows that as a reduction of 50 % of maximum percentage of roots recorded in a class (~10 %) equates to a penetration resistance of approximately 2.5 MPa.
from developing at depth may not allow the exploitation of sufficient water to sustain tree growth in the long term. In addition, poor vertical root development will also increase the risk of wind-throw which may not be of importance in arable systems.
after the initial 15 cm penetration into the soil. Penetrometers also have standard methodologies associated with them and there is a substantial amount of information in the literature relating their outputs to soil properties which is not the case for the ‘lifting driving tool’ (Herrick & Jones, 2002).
Conclusion
Acknowledgements
We are grateful to Kirsten Foot for initial experimental design and set up, and the Forest Research Technical Support Unit staff at Alice Holt for assisting with experimental set up and maintenance. We also thank Oliver Rendle, Jamie Awdry, Jim Page, Vicki Lawrence, Bob Bellis and Jaqui Neal for conducting field measurements, Andy Moffat for technical guidance and Ian Willoughby for reviewing the paper. Funding provided by the Forestry Commission is also gratefully acknowledged.
References
Anderson, G., Pidgeon, J.D., Spencer, H.B. & Parks, R. 1980. A new hand-held recording penetrometer for soil studies. Journal of Soil Science, 31, 279-296.
Baker, R.M. 1990. Investigations into selected properties of open-cast spoil related to tree growth. Arboricultural Journal ,14, 129-137.
Bengough, A.G. & Mullins, C.E. 1990. Mechanical impedance to root growth: a review of experimental techniques and root growth responses. Journal of Soil Science, 41, 341-358.
Bengough, A.G. & Mullins, C.E. 1991. Penetrometer resistance, root penetration resistance and root elongation rate in two sandy loam soils. Plant and Soil, 131, 59-66.
Böhm, W. 1979. Methods of studying root systems (Ecological Studies 33). Springer-Verlag, Heidelberg.
Boone, F.R. & Veen, B.W. 1994. Mechanisms of crop responses to soil compaction. In: Soil compaction in crop production (eds B.D. Soane & C. van Ouwerkerk), Developments in Agricultural Engineering
11, Elsevier, Amsterdam, pp 237-264.
Daley, B. & Balson, P. 1999. British Tertiary Stratigraphy. Geological Conservation Review Series. Joint Nature Conservation Committee, Peterborough.
FAO 1998. World reference base for soil resources. Food and Agricultural Organisation of the United Nations, Rome.
GenStat. 2005. The Guide to GenStat Release 8.1 Part 2: Statistics (ed R.W. Payne). Lawes Agricultural Trust (Rothamsted Experimental Station). Oxford: VSN International.
Hamza, M.A. & Anderson, W.K. 2005. Soil compaction in cropping systems: A review of the nature, causes and possible solutions. Soil and Tillage Research, 82, 121-145.
Herrick, J.E. & Jones, T.L. 2002. A dynamic cone penetrometer for measuring soil penetration resistance. Soil Science Society of America Journal 66, 1320-1324.
Jarvis, M.G., Allen, R.H., Fordham, S.J., Hazelden, J., Moffat, A.J. & Sturdy, R.G. 1984. Soils and their use in south-east England. Bulletin of the Soil Survey of England Wales 15, Harpenden, UK.
Meteorological Office. 2005. Average annual rainfall (mm) over the period 1971-2000 from Meteorological Office Integrated Data Archive System (MIDAS). Meteorological Office, Exeter, UK.
Moffat, A.J. & Boswell, R.C. 1997. The effectiveness of cultivation using the winged tine on restored sand and gravel workings. Soil and Tillage Research, 40, 111-124.
Moffat, A.J. 1995. Minimum soil depths for the establishment of woodland on disturbed ground. Arboricultural Journal, 19, 19-27.
Moffat, A.J. & McNeill, J.D. 1994. Reclaiming disturbed land for forestry. Forestry Commission Bulletin 110. HMSO, London, ISBN 0 11 710319 5.
Sinnett, D., Poole, J &.Hutchings, T.R. 2006. The efficacy of three techniques to alleviate soil compaction at a restored sand and gravel quarry. Soil Use and Management, 22, 362-371.
Sinnett, D., Poole, J. & Hutchings, T.R. Submitted. A comparison of cultivation techniques for successful tree establishment on compacted soil. Forestry.
Sumbler, M.G. 1996. British Regional Geology: London and the Thames Valley. British Geological Survey, HMSO, London.
Taylor, H.M. & Ratcliff, L.F. 1969. Root growth pressures of cotton, peas and peanuts. Agronomy Journal, 61, 398-402.
Whiteley, G.M., Utomo, W.H. & Dexter, A.R. 1981. A comparison of penetrometer pressures and the pressures exerted by roots. Plant and Soil, 61, 351-364.
Wilson, K. 1985. A guide to the reclamation of mineral workings for forestry. Forestry Commission Research and Development Paper 141, Forestry Commission, Silvan House, 231 Corstorphine Road, Edinburgh EH12 7AT, ISBN 0 85 538194 9.
Yeatman, C. W. 1955. Tree root development on upland heaths. Forestry Commission Bulletin 21, HMSO, London.
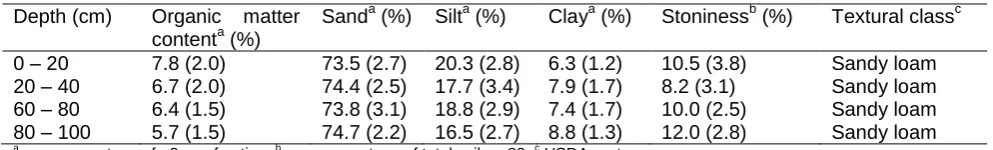
Table 1 Mean physical soil properties at Warren Heath Plantation (n=56). Values in parenthesis indicate standard deviation.
Depth (cm) Organic matter contenta (%)
Sanda (%) Silta (%) Claya (%) Stoninessb (%) Textural classc 0 – 20 7.8 (2.0) 73.5 (2.7) 20.3 (2.8) 6.3 (1.2) 10.5 (3.8) Sandy loam 20 – 40 6.7 (2.0) 74.4 (2.5) 17.7 (3.4) 7.9 (1.7) 8.2 (3.1) Sandy loam 60 – 80 6.4 (1.5) 73.8 (3.1) 18.8 (2.9) 7.4 (1.7) 10.0 (2.5) Sandy loam 80 – 100 5.7 (1.5) 74.7 (2.2) 16.5 (2.7) 8.8 (1.3) 12.0 (2.8) Sandy loam
a
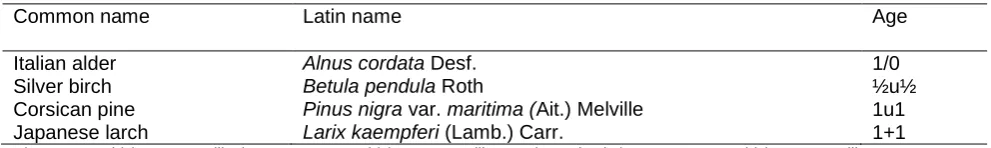
[image:15.595.50.547.107.182.2]Table 2 Species and age at planting
Common name Latin name Age
Italian alder Alnus cordata Desf. 1/0
Silver birch Betula pendula Roth ½u½
Corsican pine Pinus nigra var. maritima (Ait.) Melville 1u1
Japanese larch Larix kaempferi (Lamb.) Carr. 1+1
Table 3 Relationships (Root=mMPa+c) between both the number and percentage of tree roots (Root) and the penetration resistance using the cone penetrometer (MPa).
Species Measure n P m c
Italian alder Number of roots 6 0.002 -1.701a 8.48
Japanese larch Number of roots 7 <0.001 -1.493a 7.854
Birch Number of roots 8 <0.001 -2.784b 13.693
Corsican pine Number of roots 5 0.038 -0.724a 4.24
Italian alder Percentage 6 <0.001 -4.403c 21.56
Japanese larch Percentage 7 <0.001 -3.756c 19.61
Birch Percentage 8 <0.001 -4.115c 20.69
Corsican pine Percentage 5 0.044 -2.193c 14.91
Table 4 Relationships (Root=10m(I+c)) between both the number and percentage of tree roots (Root) and the penetration resistance using the ‘lifting driving tool’ (I).
Species Measure n P m c
Figure 1 Mean percentage of roots in each penetration resistance class using the penetrometer (n=26; error bars indicate standard error of the mean)
0 5 10 15 20 25 30 35 40 45 50 0 -0 .5 0 .5 -1 .0 1 .0 -1 .5 1 .5 -2 .0 2 .0 -2 .5 2 .5 -3 .0 3 .0 -3 .5 3 .5 -4 .0 4 .0 -4 .5 4 .5 -5 .0 5 .0 -5 .5 5 .5 -6 .0
Penetration resistance class (MPa)
P e rc e n ta g e o f ro o ts ( % )
Figure 2 Mean percentage of roots in each penetration resistance class using the penetrometer (n=26; error bars indicate standard error of the mean)
0 5 10 15 20 25 0 -0 .5 0 .5 -1 .0 1 .0 -1 .5 1 .5 -2 .0 2 .0 -2 .5 2 .5 -3 .0 3 .0 -3 .5 3 .5 -4 .0 4 .0 -4 .5 4 .5 -5 .0 5 .0 -5 .5 5 .5 -6 .0
Penetration resistance class (MPa)
[image:20.595.61.539.109.405.2]Figure 3 Mean percentage of roots in each penetration resistance class using the ‘lifting driving tool’
(n=12; error bars indicate standard error of the mean)
0 5 10 15 20 25 30 35 40 45 50 0 -5 5 -1 0 1 0 -1 5 1 5 -2 0 2 0 -2 5 2 5 -3 0 3 0 -3 5 3 5 -4 0 4 0 -4 5 4 5 -5 0 5 0 -6 0 6 0 -7 0 7 0 -8 0 8 0 -9 0 9 0 -1 0 0
Penetration resistance class (Num ber of im pacts)
P e rc e n ta g e o f ro o ts ( % )
Figure 4 Mean percentage of roots in each penetration resistance class using the ‘lifting driving tool’
(n=12; error bars indicate standard error of the mean)
0 5 10 15 20 25 30 35 40 45 0 -5 5 -1 0 1 0 -1 5 1 5 -2 0 2 0 -2 5 2 5 -3 0 3 0 -3 5 3 5 -4 0 4 0 -4 5 4 5 -5 0 5 0 -6 0 6 0 -7 0 7 0 -8 0 8 0 -9 0 9 0 -1 0 0
Penetration resistance class (Num ber of im pacts)
Figure 5 Data and model for penetration resistance measured using the penetrometer versus ‘lifting driving tool’ (n=34)
0.0 0.5 1.0 1.5 2.0 2.5 3.0 3.5
0 5 10 15 20 25 30
Lifting driving tool class (number of impacts)
P
e
n
e
tr
a
tio
n
r
e
s
is
ta
n
c
e
(
M
P
a