Towards Intelligent Crowd Behavior Understanding
through the STFD Descriptor Exploration
XU, Yuanping, LU, Li, XU, Zhijie, HE, Jia, WANG, Jing
<http://orcid.org/0000-0002-5418-0217>, HUANG, Jian and LU, Jun
Available from Sheffield Hallam University Research Archive (SHURA) at:
http://shura.shu.ac.uk/18881/
This document is the author deposited version. You are advised to consult the
publisher's version if you wish to cite from it.
Published version
XU, Yuanping, LU, Li, XU, Zhijie, HE, Jia, WANG, Jing, HUANG, Jian and LU, Jun
(2018). Towards Intelligent Crowd Behavior Understanding through the STFD
Descriptor Exploration. Sensing and Imaging.
Copyright and re-use policy
See http://shura.shu.ac.uk/information.html
Sensing and Imaging
Towards Intelligent Crowd Behavior Understanding through the STFD Descriptor
Exploration
--Manuscript
Draft--Manuscript Number: SSTA-D-17-00073
Full Title: Towards Intelligent Crowd Behavior Understanding through the STFD Descriptor Exploration
Article Type: S.I. : Recent developments in Sensing and Imaging 2017
Keywords: crowd abnormal behaviors, STFD descriptor, convolutional neural network (CNN), group trajectory
Corresponding Author: Yuanping Xu
Chengdu University of Information Technology CHINA
Corresponding Author's Institution: Chengdu University of Information Technology First Author: Yuanping Xu
Order of Authors: Yuanping Xu Li Lu Zhijie Xu Jia He Jing Wang Jian Huang Jun Lu
Funding Information: National Natural Science Foundation of China
(61203172)
Prof. Yuanping Xu
Department of Science and Technology of Sichuan Province
(2017JY0011)
Prof. Jia He
Department of Science and Technology of Sichuan Province
(2014GZ0007)
Prof. Yuanping Xu
Abstract: Realizing the automated and online detection of crowd anomalies from surveillance CCTVs is a research-intensive and application-demanding task. This research proposes a novel technique for detecting crowd abnormalities through analyzing the spatial and temporal features of input video signals. This integrated solution defines an image descriptor (named spatio-temporal feature descriptor - STFD) that reflects the global motion information of crowds over time. A CNN has then been adopted to classify dominant or large-scale crowd abnormal behaviors. The work reported has focused on: 1) detecting moving objects in online (or near real-time) manner through spatio-temporal segmentations of crowds that is defined by the similarity of group trajectory structures in temporal space and the foreground blocks based on Gaussian Mixture Model (GMM) in spatial space; 2) dividing multiple clustered groups based on the spectral clustering method by considering image pixels from spatio-temporal segmentation regions as dynamic particles; 3) generating the STFD descriptor instances by calculating the attributes (i.e., collectiveness, stability, conflict and crowd density) of particles in the corresponding groups; 4) inputting generated STFD descriptor instances into the devised convolutional neural network (CNN) to detect suspicious crowd behaviors. The test and evaluation of the devised models and techniques have selected the PETS database as the primary experimental data sets. Results against benchmarking models and systems have shown promising
advancements of this novel approach in terms of accuracy and efficiency for detecting crowd anomalies.
Professor, University of Bedfordshire [email protected]
Hui Yu, Dr
Professor, University of Portsmouth [email protected]
Wenyan Wu, Dr
Professor, Birmingham City University [email protected]
Sensing Imaging (2017) DOI
Towards Intelligent Crowd Behavior Understanding
through the STFD Descriptor Exploration
Yuanping Xu1 Li LU1 Zhijie Xu2,3 Jia He2 Jing Wang2,3 Jian Huang1 Jun Lu1
Received: xxx
© Springer Science Business Media, LLC 2017
Abstract Realizing the automated and online detection of crowd anomalies from surveillance CCTVs is a research-intensive and application-demanding task. This research proposes a novel technique for detecting crowd abnormalities through analyzing the spatial and temporal features of input video signals. This integrated solution defines an image descriptor (named spatio-temporal feature descriptor – STFD) that reflects the global motion information of crowds over time. A CNN has then been adopted to classify dominant or large-scale crowd abnormal behaviors. The work reported has focused on: 1) detectingmoving objects in online (or near real-time) manner through spatio-temporal segmentations of crowds that is defined by the similarity of group trajectory structures in temporal space and the foreground blocks based on Gaussian Mixture Model (GMM) in spatial space; 2) dividing multiple clustered groups based on the spectral clustering method by considering image pixels from spatio-temporal segmentation regions as dynamic particles; 3) generating the STFD descriptor instances by calculating the attributes (i.e., collectiveness, stability, conflict and crowd density) of particles in the corresponding groups; 4) inputting generated STFD descriptor instances into the devised convolutional neural network (CNN) to detect suspicious crowd behaviors. The test and evaluation of the devised models and techniques have selected the PETS database as the primary experimental data sets. Results against benchmarking models and systems have shown promising advancements of this novel approach in terms of accuracy and efficiency for detecting crowd anomalies.
Keywords crowd abnormal behaviors, STFD descriptor, convolutional neural network (CNN), group trajectory
1
School of Software Engineering, Chengdu University of Information Technology, Chengdu 610225, PRC
2
School of Computer Science, Chengdu University of Information Technology, Chengdu 610225, PRC
3
School of Computing & Engineering, University of Huddersfield, Queensgate, Huddersfield, UK ORIGINAL PAPER
1 Introduction
Large and high-density crowds in confined spaces may lead to serious situations, especially when exposed to unwanted disturbances such as panicking and affray. In order to economize on manpower and resources for monitoring, managing, and protecting people’s lives and properties in these situations, an intelligent, efficient and cost-effective technology is of the paramount importance for both of its academic and social values. Among current popular approaches to tackle the challenges, computer vision-based models offer the most promising direction (and some maturing solutions) due to its non- (or more likely less-) invasive, (sometimes) fast, and (relatively) cheap solutions.
At present, vision-based approaches for crowd behavior analysis can be classified into two general categories, i.e., object-based methods and holistic methods[1]. The former can infer both the behaviors and their associated individuals, which have been frequently applied to analyze and monitor behaviors of the low to medium density crowds. Crowd behaviors can be analyzed through operational processes such as detection, segmentation, tracking and recognition. For example, Zhou et al. proposed a mixture model of dynamic pedestrian-agents (MDA) to learn the collective behavior patterns of pedestrians in crowded scenes[2]. However, this method has some limitations, e.g., the MDA assumes affine transform, such that it has difficulty in representations of some complex shapes of crowd regions. More importantly, monitoring individual behaviors is quite different from studying crowd behaviors. It is inherently difficult to acquire accurate individual information in a crowded scene due to occlusions and shadowing. In many real world applications, over-simplifying the crowd as a linear aggregation of multiple individuals leads to failure in identifying the true nature of crowd anomalies.
Compared with the object-based cases, the holistic approach treats the crowd as a single entity, which is more suitable for analyzing structured scenes and crowds of medium or high density[3]. It is based on the assumption that individual objects in a crowded scene are often too small to be identified or of any major values for crowd monitoring purpose. For example, Mousavi proposed the HOT (Histogram of Oriented Tracklets) descriptor that merges orientation and magnitude of mid-level features[4]. These mid-level features are acquired by Kanade-Lucas-Tomasi Tracking (KLT) algorithm that can re-initialize the detection of salient points for augmenting the target features of crowd behaviors.Mehran extracted optical flows calculated based on the social-force theory, and then K-means clustering has been applied on the flow area to obtain several clusters[5]. With a corpus of clusters, Latent Dirichlet Allocation (LDA) was then deployed to discover the topics in the normal crowd behaviors, and the modified Expectation Maximization (EM) algorithm with the Bag of Words (BoW) model were later used to maximize the likelihood of a corpus[6]. Both the LDA training and EM approximation algorithms need a great deal of computation, which is challenging for the process to be deployed for real-time and automated monitoring[6]. In holistic approaches, crowd dynamic models are often adopted to estimate the behavior patterns as a whole, such that local behaviors in unstructured scenes cannot be handled well.
image processing route through studying the pixel-value-based crowd trajectories and motion features. Motion features in a video can be divided into global features and local features. The global features are extracted using background removal and target tracking methods. Local features are interest points of individual video frames that are combined to describe crowd information. Although the relevant processes often require high volume preprocessing, local features contribute to the forming of the so-called image descriptors that are the core technique for object recognition, e.g. Dalal applied the HOG (Histograms of Oriented Gradient) descriptor that is computed by the gradients of an image[7]. These methods have been successfully applied in individual action recognition. The optimization of image descriptors based on automatic partitions of intra-group and inter-groups of crowd behavioral patterns and the corresponding feature extraction is a challenging task for detecting abnormal crowd behaviors in complicated scenes (e.g. high-density crowds, occlusion and shadowing, and low resolutions). Recently, Yuan et al. proposed a structural context descriptor (SCD) for describing a crowd and its individuals[8]. Shao et al. proposed a scene-independent group descriptor to quantify human behavior intensities [9].
Compared with existing algorithms, the main improvements of the proposed integrated solution in this study are summarized in the following:
1) Spatio-temporal segmentation is applied to divide crowd areas according to the similarity of group trajectories and structures rather than the single index of optical flow velocity. The adjacent spatial distance of the foreground images based on LBP is calculated in spatial space to form graphs.
2) A novel image descriptor - spatio-temporal feature descriptor (STFD) is defined by calculating the attributes (i.e., collectiveness, stability, conflict and crowd density) of particles in the corresponding groups that has been devised in this study for extracting feature information of sub-crowd movement. 3) The STFD and a CNN (Convolutional Neural Network) have been integrated
to explore a deep learning model for detecting crowd abnormality types. Compared with conventional machine learning techniques, this CNN integrated model can improve 18.9 percent of the accuracy of crowd abnormalities (see Table 5). The STFD instances drawn from a crowd video can form an action map (2D image) that holds all extracted information of global movements of a crowd, and the generated maps will be inputted into the devised CNN model for recognizing abnormal crowd behaviors.
2 Related Studies
2.1 Optical Flow
Particle based methods have been widely applied to analyze crowd movements [10,5]. An improved particle method based on Brox’s work has been applied in our research[11]. In 2004, Brox et al. proposed an algorithm based on a theory of “warping” to estimate optical flows with high accuracy[11]. This algorithm contains three assumptions, i.e., grey value constancy, gradient constancy and smoothness. The assumption of grey value constancy with nonlinearity is usually applied in cases of large displacements. This approach combines concepts of optical flow estimation from several previous methods, e.g. works of Horn-Schunck[12] and Lucas Kanade[13]. It is robust when being exposed to parameter variations. Moreover, it is resilient to noise and light variations. Thus, it has been applied in our study to extract optical flows. As shown below, the optical flow can be formulated as a global energy function:
2 Data 2 2 2Smooth 3 3
2 2 2 Data Smooth ( , ) ( , ) ( , ) ( , ) ( , ) ( , ) ( , ) hsv hsv
I x w I x
E u v dx
r I x w I x
E u v u v dx
E u v I x I y
I x w I x dx
E u v E u v aE u v
bE u v
(1)where u and v represent image pixels corresponding to optical flows in the horizontal and vertical orientation respectively, and a represents the weight of regularization term. E(u, v) is the total energy that is the weighted sum between the data term and the smooth term (Esmooth). The minimize energy is found by u and v
functions. In this study, we added the HSV (Hue, Saturation, Value) item (Ehsv) to
solve optical flow aperture problem that is a kind of pixel matching error caused by the luminance similarity.
2.2 Group Segmentation
of spatio-temporal regions with noisy time series data[14].Davies et al. proposed the Discrete Fourier Transform (DFT) algorithm that can divide moving objects into groups [15]. It can define a group cluster by calculating the movement trend (i.e., velocity and orientation) of an image, but it leads to increased computational load. Later, Velastin et al. integrated movement vectors and filters to identify the movement trend of crowds in surveillance CCTVs[16]. After groups have been acquired during the process of group segmentation, Li built up a uniform probability framework to produce the so-called probability graphs based on extracted features and interactions of intra- and inter-groups. To strike a balance between the accuracy and efficiency of group segmentation, an improved CF algorithm has been devised in this study, which considers both the similarity of group trajectory structure in temporal space and the foreground block based on GMM in spatial space rather than the inadequate velocity based calculation of traditional CF.
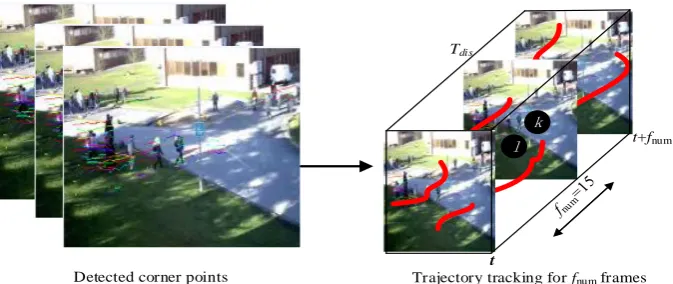
Fig. 1. The trajectories from the frame z to z+15
2.3 Group Trajectory Tracking
This study analyzes group behaviors based on motion features (i.e., velocity, direction, acceleration) extracted from the trajectories of every pixels in the same group since typical crowd motions are normally regular and repetitive in their sub-groups[1]. The trajectories are more semantic-oriented than low spatio-temporal features and motion histograms. However, traditional KLT algorithms have failed to track movements of pedestrians over a long period of time, especially in high density situations. The difficulty on obtaining complete trajectories can be alleviated by putting together a set of fragments of motion features (named tracklets) tracked within a short period of time continuously to form a longer trajectory. In order to optimize the tracing time and computational performance of traditional KLT operation, Shao et al. explored a collective transition (CT) prior to group movement detections[9]. It uses the Markov chain to quantify the coherent motions of all particles (individual members of a group) of a group in a video clip. In these previous works of group trajectory tracking, tracklets are usually extracted from dense feature points, and specific mechanisms should be implemented to enforce the spatio-temporal coherence between tracklets [17].
Detected corner points
Tdis
t
t+fnum
Trajectory tracking for fnum frames k
2.4 Group Motion Feature Extraction
Some holistic attributes (e.g. crowd density and movement flow) can be extracted from the modelled trajectories in temporal space and represented by particle movements in spatial space, such that these attributes can be used to quantify the crowd behaviors.For instance, Zhang et al. defined the social attribute-aware force model (SAFM) to extract crowd motion features, such as disorder, congestion, interaction force and scale, etc[18]. Dahrendorf et al. indicated that social conflict was one of the central themes in social research[19], and Wheelan et al. stated that conflict can be caused by the competitions for resources[20]. However, there features (e.g. disorder and social conflict) representing interaction information among individuals are very difficult to be extracted from high density crowds, so the group segmentation is served as an indicator to measure the crowd density (low or high) in this study. Moreover, a robust image descriptor (named STFD) by calculating the attributes (i.e., collectiveness, stability, conflict and group density) of particles in the corresponding groups has been devised in this study for representing and analyzing crowd states. These attributes (group motion features) define interactions among intra- and inter-group elements.
3 The Devised Integrated Model
3.1 The Improved Spatio-Temporal Segmentation (1) In temporal space
As Fig. 1 shown, suppose that the particle tracking finds n trajectories in the period of fnum (fnum=15) frames by using KLT, and the trajectory length less than 15frames
will be deleted. One of the trajectories on the frame z is defined as tro={(x1, y 1,
v1)…(xn, yn,, vn)}. The velocity and orientation of each pixel (x, y) (a particle) can be
quantized in the frame z, and their formulas are defined as the following:
2 2
(x, y) ( , ) ( , )
( , ) ( , ) arctan( )
( , )
x y
x
y
v v x y v x y
v x y x y
v x y
(2)
where u(x, y) and (x, y) are corresponding to the motion speed and motion orientation of a pixel (x, y) respectively.
The similarity of trajectory structures (S) between pixel dots l and k in the period of fnum frames in temporal space can be calculated by the following formula:
istance( , ) 1 1 ( istance( , ))
d s a l
d s a l
lk
D l k Dire W Speed W Ang W Loc W
W W W W
S Norm D l k
(3)
where the direction (Dire), speed (Speed), angle (Ang), and location (Loc) of k and l should be calculated with the corresponding weights (Wd, Ws, Wa, Wl).
(2) In spatial space
devised integrated model combines GMM and three-frame temporal differencing to isolate the foreground blocks, such that the foreground regions can be formed for the subsequent process of group segmentation. The three-frame temporal differencing is defined as:
1 1
, , | ( )
t t t t t
t t t t
I x I x I x I x
p x y x y I x median
(4)
where It-1(x), It(x), It+1(x) represent any three consecutive frames, is a local add
operate, x is an image pixel. To obtain an ideal foreground image, the threshold function median (t) is used to remove the noise pixels, and it also determines the
pixels pt of moving targets.
(3) Multi-groups clustering
The particles in the corresponding foreground blocks are required to be further divided into multiple groups according to the combination of both similarity of trajectory structures and their adjacent distances in the period of fnum frames. This
segmentation process is summarized as following: Inputs: n pixel dots and m groups.
1) The adjacent distances (dlk) between two particles (l and k) is defined as:
2 2
( ) (y )
lk l k l k
d x x y (5)
2) the RBF function is applied here to define the weights (dlk) of two particles
(l and k) respectively as the following: 2 2 2 exp , 0, lk l k lk d i j W j W i (6)
where is the bandwidth of 2D Gaussian kernel.
3) The Wlk of any two particles can form a matrix (W) that is a symmetric
positive definite matrix, so a matrix of laplacian is defined as the following:
LDW (7)
where D denotes a Stiffness matrix of W, and it is formed through the sum of every row of W respectively.
4) The matrix (U, URnm) is constructed by the feature vectors {u1, u2,…,um}
of L.
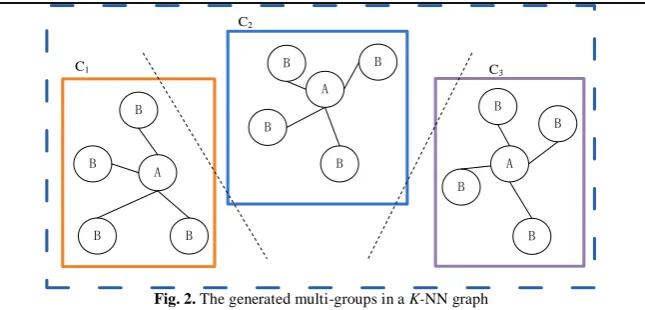
5) The row vectors (yiRm) are grouped by K-means algorithm, such that
particles are organized by the spectral clustering graph, see
6) Fig. 2. The divided groups will form a K-NN graph with interactions among both intra- and inter-groups.
B A
B
B
B B
B
B
B B
B B
C1
C2
C3
A B
[image:11.439.59.382.44.199.2]A
Fig. 2. The generated multi-groups in a K-NN graph
3.2 The STFD Descriptor
At this stage, the generated groups C = (C1…Cm) will be quantified using attributes
[image:11.439.55.367.321.407.2]such as collectiveness, stability, conflict and density, and then a set of instances of STFD descriptors can be calculated by a nonlinear function. These instances are comprehensive spatio-temporal features with pre-defined semantics, serving as inputs for training and testing on the devised CNN structure. The selected attributes can provide quantified expressions of various interactions of particles among intra-groups and inter-intra-groups semantically, see Table 1.
Table 1 The attributes of intra- and inter-group interactions
Attributes Descriptions Equations
collectiveness Coll(Ci) equation (8)
stability stab(Ci) equation (9)
conflict conf(Ci) equation (12)
group density density(Ci) equation (13) (1) Collectiveness
The collectiveness attribute indicates the degree of individuals (i.e., particles in a group) acting as a union in coherent motions. In continuous fnum frames, the
movement trend (flow) of each group (Ci) can be obtained through calculating the
average coordinates and displacements of every particle in this group. Thus, the collectiveness of a group can be defined as the following:
1 1 ,
( i)
p C
p flow coll C
N N p flow
(8)where p denotes a particle in a group Ci andpis the motion vector of p.
(2) Stability
1) The first indication of stability is the number of the invariant neighbors of each particle in a group of the corresponding K-NN graph, and the change means that a particle has moved from one group to another. Thus, the first part of stability definition (stab1) for the intra-group can be given as the following :
1
i 1
p C
stab K change
N
(9)number of K-NN particles connecting with the target particle.
2) The second indication of stability is that each group keeps the consistent topological distance in the corresponding K-NN graph with its neighbors, so the second part of stability definition (stab2) for intra-groups can be given as
the following :
1 i 2 p p C stab d N
(10)where dp represents the average value of the Euclidean distances between a
particle and its K number of adjacent particles in the same group. The overall stability definition can be given as the following:
( i) 1 2
p ci
stab C stab stab
(11)(3) conflict
The conflict attribute characterizes interactions among between groups when they are approaching to each other. The conflict (conf) is defined as:
1
( i) p
p Ci
conf C v
N
(12)where vp represents the velocity of a particle.
(4) density
The density attribute (density) is the spatial distribution of particles in a frame, which is the measure of the local density only in the spatial space.
2 2
2
1
( ) exp 2
i j p p
i
p Ci
density C
(13)where pi, pj represents the neighbor particle in a frame, and is the bandwidth of
2D Gaussian kernel.
This solution integrates the collectiveness, stability, conflict and group density into a new spatial and temporal feature descriptor (STFD), such that it can hold not only the similarity of group trajectory structures but also spatial adjacent distances. Thus, this comprehensive descriptor merges the spatial differences between particles and its neighbors as well as the global movement information of any video frame, hence it can preserve both local and global features, so as to improve the detection rate of crowd anomaly behaviors.
Multiple spatial and temporal features are combined into the STFD represention depicting crowd characteristics in a video sequence. Thereby an instance of the STFD descriptor (stfd) becomes a spatio-temporal feature vector:
1 2 3 4 1 ( ( ) ( ) ( ) ( )) fnum
w coll w stab
stfd C C
C f
w conf w de sit Cn y
3.3 CNN Recognition
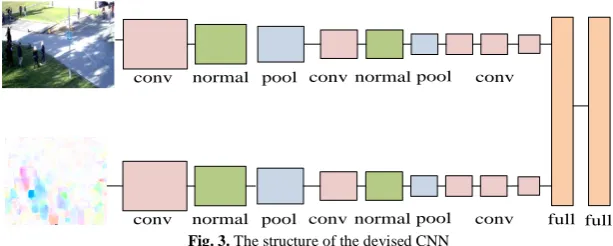
Fig. 3. The structure of the devised CNN
The instances of STFD descriptor are 4 (4 is the number of STFD attributes) dimensional spatio-temporal feature vector by using the equation (14), and some instances of STFD become training samples labeled with normal or abnormal.The labeled training data sets are inputs of the devised CNN model to determine whether the current frame is abnormal or not in the online detection phase. CNN model based anomaly behavior detection methods include two phases, i.e., training and testing:
1.During the training phase:
The instances of the STFD descriptor from the 1 to zth frame are calculated for serving as a training data set (Dtain).
Every data element in the training data set (Dtain) will be marked with a label
(normal behavior is ‘1’ and abnormal behavior is "-1").
The labeled training data can serve as input training vectors for CNN model. The structure of the devised CNN is illustrated in Fig. 3, which has upper (appearance) and lower (motion) levels. The upper network level has a data layer, five convolution layers, two pooling layers, two normal layers and two full layers. The upper level can use the ImageNet model to recognize different scenes[21]. The STFD instances are inputs for the lower level. Both upper and lower levels have the similar network structure, but they have different parameter setups (e.g. different layers, the size of kernels and steps of convolutions):
1) Data layer: STFD instances are adjusted by RGB image (Irgb) to get a set of
(m4)/3 dimensional vectors. In this process, every value of STFD is equal to a value of image channel (R, G or B) respectively. Irgb are used to remove the
mean value (mean) and the M is the outputs for the subsequent convolution layer, see the equation (15):
RGB
M I mean (15)
2) Convolution layer: Neurons of the upper level neural network use the convolution kernels to extract various image characteristics (color, texture, contour et.al) on both global and local regions of the target video clip. This layer multipliesthe jthneuron of the current layer by the weight (Wij) of the
previous layer and adds the corresponding bias, and then a sigmoid function is applied to get the jth feature map (cj) through the nonlinear mapping, see
equation (16):
j
j ij i j
i M
c W x b
(16)
3) Pooling layer: The convoluted features from convolution layer are inputted into the pooling layer to reduce their dimensions since max-pooling values may cause overfitting and mean-pooling values may cause underfitting. In order to improve the recognition rate of abnormal behaviors, the adaptive threshold method has been applied to avoid the overfitting and underfitting. The main idea of this method is to find a suitable threshold on the target window area to remove values less than this threshold in the pooling layer, and calculate a mean value ui,j from the values that is bigger than the threshold.
The probability values pi,j of active values ai,j can be obtained based on ai,j
from pooling area ym,n, and then a threshold em,n can be obtained through
weighted statistics of ai,j and the corresponding pi,j. The equations for
calculations of ui,j , pi,j and em,n are given as the following:
,
,
, m,n ,
, , m,n ,
0?1: 0
0?1: 0
m n m ni j i j
i j y
ij
i j i j y
a
e
a
u
a
e
(17), , , , , , , , , m n m n
m n i j i j
i j y
i j ij
k l k l y
e
p
a
a
p
a
(18)4) Full layer: All sampling features from pooling layer are inputted into the full layer where different crowd abnormal behaviors (e.g. panics and gathers) will be classified by using the in-built softmax classifier. The loss function of entity CNN can be defined as the following:
1
1
log (1 ) log(1 )
N
n n n n
n
E lab o t o
N
(19)where N denotes the number of classification, labn denotes labels of
classification, and on is the predicted values of the probability.
2.The testing phase: after the CNN model with the optimum parameters has been trained during the training phase, it can classify a test video frame into the normal or abnormal frames.
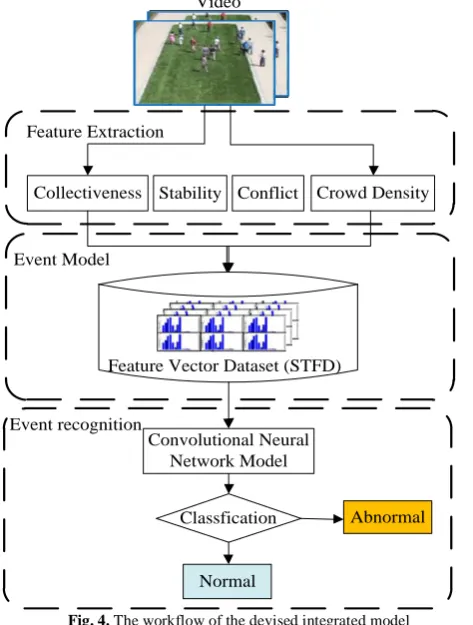
4 Detection of Crowd Events
The overall workflow of the proposed integrated model for real-time and effective detection of crowd anomaly events, especially for the computation and application of STFD is summarized in this section, see Fig. 4.
1) Feature extraction: the target spatio-temporal space is divided into several crowd motion regions based on the similarity of trajectories and foreground blocks, and these motion regions should further be divided into groups by using the spectral clustering method.
merge spatio-temporal features with semantics. The attributes of each group are quantified and integrated into instances of STFD, such that these instances integrate both global and local movement features of every fnum video frame.
3) Event recognition: Taking STFD as the feature vector of every fnum frame, and
feature vectors are labeled as normal or abnormal samples serving as the input of the devised CNN algorithm to obtain the CNN model that can determine whether the current frame is normal or not in the online detection phase.
4) State change: If the classification results are changed from ‘normal’ to ‘abnormal’ or from ‘abnormal’ to ‘normal’ among consecutive several frames, and the crowd state can be considered as the state change.
Video
Abnormal
Normal Classfication Feature Vector Dataset (STFD)
Crowd Density Collectiveness
Event Model Feature Extraction
Convolutional Neural Network Model Event recognition
[image:15.439.105.342.170.483.2]Stability Conflict
Fig. 4. The workflow of the devised integrated model
5 Applications and Experimental Results
The PETS database was selected to test and evaluate the devised solution. It has four video clips for each crowd activity on outdoor scenes of resolution 640480, e.g., group fighting, aggregation, walking and running[22].
The experiments were implemented by using Visual Studio 2013 and MATLAB software running on pure CPU (i7, 4 threads). In these experiments, human walking or loitering are defined as normal events while crowd running or fighting on sidewalks are considered as abnormalities.
True Positive (TP) is an abnormal sample that is correctly classified as an abnormal one by the CNN;
True Negative (TN) is a normal sample that is correctly classified as a normal one by the CNN model;
False Positive (FP) is a normal sample that is improperly classified as an abnormal one;
False Negative (FN) is an abnormal sample that is improperly classified as normal one.
Precision is the proportion of TP in the abnormal samples which are classified.
Recall is the proportion of TP in real abnormal samples. =
Re =
2 Re
1
Re
FP precision
TP FP
TP call
TP FN
TP TN Accyract
TP TN FP FN
precision call
F
precision call
(20)
1) Case 1: Group segmentation
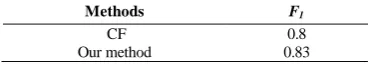
Compared with CF algorithm [14], this research conducts group segmentations by using the similarity of trajectory structures and adjacent spatial distances on foreground blocks. The results of group segmentation experiments are shown in Fig. 5: (a) is the result of CF group segmentation, and (b) is the result of the proposed method in this study. In order to evaluate the accuracy of these two methods, F1 is
constructed in the experiments through integration of indicators of accuracy and recall ratio in equation (20). In Table2, F1 value of our method is 0.83 that is better
[image:16.439.51.392.358.555.2]than CF based on the testing of 3 video clips from PETS.
Fig. 5. (a) CF segmentation of a crowd. (b) The devised segmentation.
Table 2 The F1 comparison between CF and our method
Methods F1
CF 0.8
[image:16.439.127.312.586.619.2]2) Case 2: Crowd anomaly detection
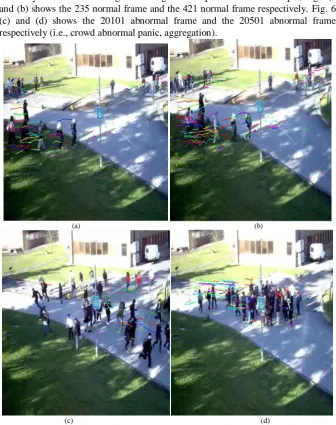
In these experiments, video frames of three scenes in PETS database from 1 to 20000 were used as normal testing samples, and from 20001 to 25000 are used as abnormal testing samples. In the paper, we evaluated our experiments by equation (20), and each scene were assessed separately. For each scene, some videos are randomly selected for training and testing in our experiments. For example, Fig. 6(a) and (b) shows the 235 normal frame and the 421 normal frame respectively. Fig. 6 (c) and (d) shows the 20101 abnormal frame and the 20501 abnormal frame respectively (i.e., crowd abnormal panic, aggregation).
(a) (b)
[image:17.439.52.389.114.539.2](c) (d)
Fig. 6. (a) and (b) two normal frames from a scene, (c) the crowd panic information on the 7540 frame, (d)
the crowd fighting information on the 10049 frame.
and 0.90 respectively, which denotes the classification recognition rate, i.e. the larger area of AUC, the better classification recognition rate, and the error rate of recognition for all the three scenes are low by using this integrated model.
[image:18.439.71.370.151.277.2]The STFD is a combination of attributes of groups to integrate spatio-temporal features covering both local and global aspects, so the rationale of this combination should be justified through designed experiments, see Table 4. The experimental results on AUC are shown the STFD can get larger AUC values than any other single attribute.
Table 3 Experimental results for the integrated model
clips
Actual Normal /Abnormal
frames
Recognized Normal /abnormal frames
Total
Accuracy AUC
Scene0 163/160 37/37 0.985 0.97
Scene1 128/123 72/70 0.965 0.99
Scene2 154/150 46/45 0.975 0.90
Table 4 The rationale of STFD
Attributes AUC
collectiveness 0.75
stability 0.81
conflict 0.85
group density 0.83
combined features 0.93
[image:18.439.59.383.380.426.2]The STFD descriptors extracted from three clips (i.e., three different scenes) of PETS (25000 frames) were inputted in CNN and other Machine Learning models to conduct training (10000 frames) and testing (15000 frames). The Experimental results in terms of accuracy, training time and testing time are compared in Table 5. The accuracy of CNN is higher than the SVM and RF based models. In the time space, the CNN spent a little more testing time (20ms) than SVM as the devised CNN needs to update the corresponding weights of the neural network,.
Table 5 A comparison of the devised CNN, SVM and RF
Models CNN Support Vector
Machine (SVM) Random Forest(RF)
Accuracy of classification (%) 88.9 69.8 70.1
Training time (min) 110 80 89
Testing time (ms) 145 125 153
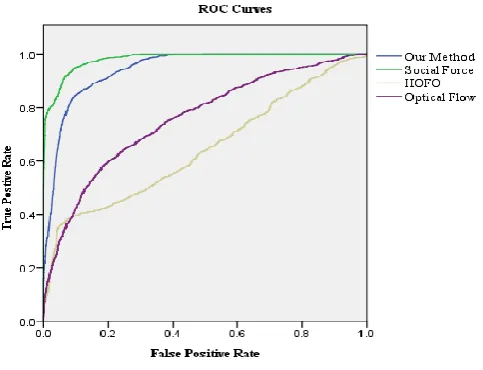
[image:18.439.78.362.565.617.2]Experiments have been designed for crowd abnormality detection by using the devised model, Optical flow, social force and histogram of optical flow orientation (HOFO) with testing data from Scene0. Table6 shows the comparisons between the proposed model and other three traditional methods. It can be found that this model is better than other classic methods in terms of accuracy and time consumption. For example, although the accuracy of the proposed model is equal to the Social Force method,the corresponding time consuming is two seconds faster than Social Force model under current setting. The ROC curves of all algorithms are illustrated in Fig. 7. The AUC of the proposed solution is superior to other traditional methods,i.e. the proposed solution has both higher detection rate and higher computational speed.
Table 6 The accuracy comparison among different methods
Method AUC Time consuming
Optical Flow [23] 0.84 35s
Social Force [23] 0.96 23.5s
HOFO [11]. 0.956 22s
Fig. 7. The Roc curves of corresponding experiments
6 Conclusions
In this paper, an integrated solution for crowd analysis and the early detection of crowd abnormality through generating instances of STFD image descriptor based on spatio-temporal group segmentations is presented. The STFD descriptor not only considers image pixels as dynamic particles to preserve interactions among groups but also integrates both local and global features of an image frame recording a crowd, which significantly improves the detection rate of crowd abnormal behaviors during online operations. In the event recognition phase, the trained CNN model with optimum parameters supports to recognize the abnormal behaviors automatically with higher accuracy and computational performance. The experimental results show that this solution has good performance and can be readily transferred to the actual scenes of real world application conditions. The effectiveness of the extracted crowd properties is validated with two application cases, i.e., the group segmentation and crowd anomaly detection. This integrated model has obtained promising results from the rigorously designed experiments. The accuracy and computational performance of the group segmentation still have room for improvements (e.g. the self-organizing maps − SOM neural network based group classification may improve the computational performance). Moreover, the weights of attributes in the STFD feature vector should be elaborated through extensive experiments in the future work.
Acknowledgements
References
1.Kalender, W. A. (2006). X-ray computed tomography. Physics in Medicine & Biology, 51, R29.
1. Li, T., Chang, H., Wang, M., Ni, B., Hong, R., & Yan, S. (2015). Crowded Scene Analysis: A Survey.
IEEE Transactions on Circuits & Systems for Video Technology, 25(3), 367-386.
2. Zhou, B., Wang, X., & Tang, X. Understanding collective crowd behaviors: Learning a Mixture model of Dynamic pedestrian-Agents. In Computer Vision and Pattern Recognition, 2012 (pp. 2871-2878) 3. Jacques Junior, J. C. S., Raupp Musse, S., & Jung, C. R. (2010). Crowd Analysis Using Computer
Vision Techniques. Signal Processing Magazine IEEE, 27(5), 66-77.
4. Mousavi, H., Galoogahi, H. K., Perina, A., & Murino, V. (2016). Detecting Abnormal Behavioral Patterns in Crowd Scenarios.
5. Mehran, R., Oyama, A., & Shah, M. Abnormal crowd behavior detection using social force model. In
Computer Vision and Pattern Recognition, 2009. CVPR 2009. IEEE Conference on, 2009 (pp. 935-942)
6. Blei, D. M., Ng, A. Y., & Jordan, M. I. (2003). Latent dirichlet allocation. Journal of Machine Learning Research, 3, 993-1022.
7. Dalal, N., & Triggs, B. Histograms of Oriented Gradients for Human Detection. In Computer Vision and Pattern Recognition, 2005. CVPR 2005. IEEE Computer Society Conference on, 2005 (pp. 886-893)
8. Yuan, Y., Fang, J., & Wang, Q. (2015). Online Anomaly Detection in Crowd Scenes via Structure Analysis. IEEE Transactions on Cybernetics, 45(3), 562.
9. Shao, J., Chen, C. L., & Wang, X. (2017). Learning Scene-Independent Group Descriptors for Crowd Understanding. IEEE Transactions on Circuits & Systems for Video Technology, 27(6), 1290-1303. 10. Christian, R., Carsten, S., Dodgson, N. A., Hans‐Peter, S., & Christian, T. Coherent Spatiotemporal
Filtering, Upsampling and Rendering of RGBZ Videos. In Computer Graphics Forum, 2012 (pp. 247-256)
11. Brox, T., Bruhn, A., Papenberg, N., & Weickert, J. (2004). High Accuracy Optical Flow Estimation Based on a Theory for Warping. 3024(:10), 25-36.
12. Horn, B. K. P., & Schunck, B. G. (1981). Determining optical flow. Artificial Intelligence, 17(1–3), 185-203.
13. Bouguet, J. Y. (1999). Pyramidal implementation of the Lucas Kanade feature tracker description of the algorithm. Opencv Documents, 22(2), 363-381.
14. Zhou, B., Tang, X., & Wang, X. (2012). Coherent filtering: detecting coherent motions from crowd clutters: Springer Berlin Heidelberg.
15. Davies, A. C., Yin, J. H., & Velastin, S. A. (1995). Crowd monitoring using image processing.
Electronics & Communication Engineering Journal, 7(1), 37-47.
16. Andrade, E. L., Blunsden, S., & Fisher, R. B. Modelling Crowd Scenes for Event Detection. In
International Conference on Pattern Recognition, 2006 (pp. 175-178)
17. Wang, C., Zhao, X., Wu, Z., & Liu, Y. Motion pattern analysis in crowded scenes based on hybrid generative-discriminative feature maps. In IEEE International Conference on Image Processing, 2014 (pp. 2837-2841)
18. Zhang, Y., Qin, L., Ji, R., Yao, H., & Huang, Q. (2015). Social Attribute-Aware Force Model: Exploiting Richness of Interaction for Abnormal Crowd Detection. IEEE Transactions on Circuits & Systems for Video Technology, 25(7), 1231-1245.
19. Dahrendorf, R. (1958). Toward a Theory of Social Conflict. Journal of Conflict Resolution, 2(2), 170-183.
20. Wheelan, S. A. (2005). The handbook of group research and practice: SAGE Publications. 21. Ouyang, W., Luo, P., Zeng, X., Qiu, S., Tian, Y., Li, H., et al. (2014). DeepID -Net: multi-stage and
deformable deep convolutional neural networks for object detection. Eprint Arxiv. 22. Overview, B. P., & Available, R. P. BEHAVE entry page.
23. Mehran, R., Oyama, A., & Shah, M. Abnormal crowd behavior detection using social force model. In