A statistical analysis of the fatigue behaviour of single and
multi-spot welded joints.
CLIFTON, Andrew James.
Available from Sheffield Hallam University Research Archive (SHURA) at:
http://shura.shu.ac.uk/19481/
This document is the author deposited version. You are advised to consult the
publisher's version if you wish to cite from it.
Published version
CLIFTON, Andrew James. (2007). A statistical analysis of the fatigue behaviour of
single and multi-spot welded joints. Doctoral, Sheffield Hallam University (United
Kingdom)..
Copyright and re-use policy
/nuocus v e n ire v^ixy oam pus
Sheffield S1 1WB
1 0 1 8 5 7 3 4 9 6
ProQuest Number: 10694362
All rights reserved
INFORMATION TO ALL USERS
The quality of this reproduction is dependent upon the quality of the copy submitted.
In the unlikely event that the author did not send a com plete manuscript
and there are missing pages, these will be noted. Also, if material had to be removed,
a note will indicate the deletion.
uest
ProQuest 10694362
Published by ProQuest LLC(2017). Copyright of the Dissertation is held by the Author.
All rights reserved.
This work is protected against unauthorized copying under Title 17, United States C ode
Microform Edition © ProQuest LLC.
ProQuest LLC.
789 East Eisenhower Parkway
P.O. Box 1346
A Statistical Analysis Of The Fatigue
Behaviour Of Single And Multi-Spot
Welded Joints
Andrew James Clifton
A thesis submitted in partial fulfilment of the requirements of
Sheffield Hallam University for the degree of Doctor of Philosophy
January 2007
Collaborating Organisations:
Abstract.
Several models exist that can provide predictions for the fatigue properties of a spot welded
joint based on geometric data. However, the accuracy of these models tends to diminish as the
number of spot welds and complexity of the joint increases. This thesis reports on the findings
of an investigative study to assess the applicability of a statistical approach for predicting the
fatigue behaviour of a multi-spot welded joint, based on data that can be gathered on single
spot welded joints that are geometrically equivalent to the individual spot welds present in the
multi-spot welded joint. A series of Staircase and Probit fatigue testing techniques were used to
gather extensive data on the fatigue behaviour of a given single spot welded joint geometry.
This data was then used, along with the proposed model, to predict the fatigue behaviour of a
series of simple multi-spot welded joints consisting of two, four, eight and sixteen nuggets,
where all the individual welds present were all ostensibly geometrically identical to the single
nugget joints. Actual values for the various multi-spot welded joints were then determined using
a series of Staircase fatigue testing techniques and compared to those predicted by the model.
The results showed an excellent correlation between predicted and experimental values for the
standard deviation of the fatigue strength distribution, and a marginal increase in the
experimentally determined mean fatigue strength, when compared to the values predicted by
the model. This difference was attributed to a small increase in the width per spot weld in the
multi-spot welded joints. Such increases in width have previously been shown to affect the
fatigue properties of spot welded joints in this manner. Once this affect was taken into account,
the results lend support to the proposed statistical approach for predicting the fatigue behaviour
of multi-spot welded joints, based on known data regarding geometrically representative single
Acknowledgements.
Acknowledgements.
While the following thesis represents the work of an individual, its completion has been aided by
the advice and technical assistance of several people, all of whom I would like to extend my
gratitude to. In particular I would like to thank my supervisory team leaders, Professor Alan J.
Smith and Professor Hans Nordberg, for their technical knowledge and advice, the Outokumpu
Stainless Research Foundation and the Engineering and Physical Sciences Research Council,
for providing material and financial support, and finally, the technical staff at Sheffield Hallam
University, particularly Tim O’Hara and Keith Wright, for their instruction and assistance with
regards to fatigue testing, and John Bradshaw and Roger Tingle, for their instrumental
instruction and assistance in the workshop.
I would like to extend a special thank you to my wife Patricia, whose relentless love and support
throughout this work, gave me the strength each day to perform
‘yet
another fatigue test’.Finally, I would also like to thank my close friends and family for their understanding and
support, and for feigning interest in the intricacies of the fatigue behaviour of spot welded joints,
in particular I would like to thank the other members of the Outokumpu Research Group: Emma,
Frank, Chris, Jamie, and Tim, whose passionate desires to rise above the 95th percentile and
leave all others in their wake, have provided me with both inspiration and amusement
Nomenclature.
A0n: Angle of nugget rotation.
A0S: Angle of sheet rotation.
AC: Alternating Current.
CTOD: Crack Tip Opening Displacement,
d: Staircase testing step divide level.
DC: Direct Current.
dn: Proposed Model: Relationship factor equal to the Z value read from the standard normal
distribution tables for a probability equal to ^0.8413 - ^ 5 .
HAZ: Heat Affected Zone.
HCF: High Cycle Fatigue.
HSLA: High Strength Low Alloy steel.
IR: Infrared.
IUT: Item Under Test
K: Stress intensity factor.
AKth: Threshold stress intensity range. Ki: Tensional stress intensity factor.
K»: Shear stress intensity factor.
Km: Out of plane shear stress intensity factor.
KTh: Threshold stress intensity factor.
K|C: Fracture toughness.
Kw: Coefficient of single spot weld standard deviation.
LCF: Low Cycle Fatigue.
LFE: Least Frequent Event.
mn: Proposed Model: Relationship factor equal to the Z value read from the standard normal
distribution tables for a probability equal to a/o!5 .
AP: Fatigue Testing: Fatigue load range.
PDF: Probability Density Function.
P(MS): Probability of survival for a multi-spot welded joint.
PSB: Persistent Slip Band.
P(SS): Probability of survival for a single spot welded joint
R: Fatigue Testing: Stress ratio.
RMS: Root Mean Square.
RSW: Resistance Spot Welding.
S: Fatigue Strength Distribution: Standard Deviation of a single spot welded joint.
S: Fatigue Testing: Fatigue Stress.
AS: Fatigue Testing: The range of the stress component of one fatigue stress cycle.
Sm " The standard deviation of the multi-spot welded joint.
Sm ax* The maximum value of the stress component of one fatigue stress cycle.
Sm in- The minimum value of the stress component of one fatigue stress cycle.
TSA: Thermoelastic Stress Analysis.
TSSW: Tensile-Shear Spot Welded.
UTS: Ultimate Tensile Test.
x: Staircase testing: Failure.
X: Fatigue Strength Distribution: Mean fatigue strength of a single spot welded joint.
Xm: Proposed Model: Mean fatigue strength of the multi-spot welded joint.
Xs: Proposed Model: Mean fatigue strength of a proportionally size single nugget joint.
X(Y): Probit Testing: Derived estimate.
Y: Probit Testing: Transformed per cent survival value identical to Z values found on
i able o f Contents,
Table of Contents.
1: Introduction...26
1.1: Theoretical Model...27
1.2: Boundary Conditions... 36
1.3: Proposed Methodology... 38
1.3.1: Summary of Proposed Theoretical Model... 41
2: Literature Review...42
2.1: Fundamentals of Resistance spot Welding...42
2.1.1: Advantages and limitations...43
2.1.2: The Welding Process...44
2.1.3: Generating Heat... 46
2.1.4: The Welding Cycle... 49
2.1.5: Defects caused by incorrect segment sequencing...51
2.1.6: Welding Current... 52
2.1.7: Welding Time...54
2.1.8: Force...56
2.1.9: Multi-spot Welding... 58
2.1.10: Current Shunting... 60
2.1.11: Summary of the Fundamentals of Resistance Spot Welding...62
2.2: Joint Design...63
2.2.1: Edge Distance... 64
2.2.2: Joint Overlap... 65
2.2.3: Nugget Size...66
2.2.4: Thickness... 67
2.2.5: Width...67
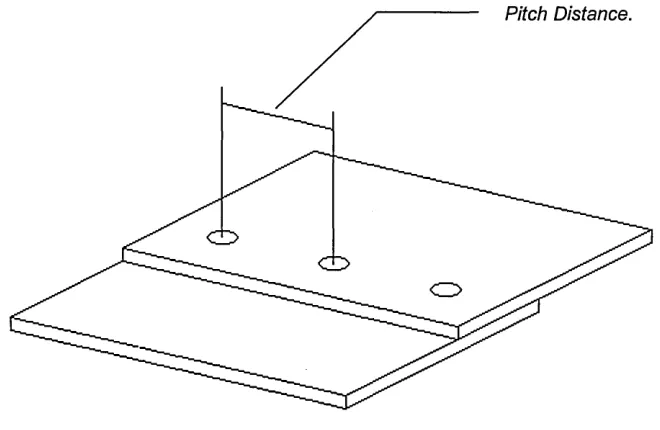
2.2.6: Pitch Distance...68
2.2.7: Free Length...69
i able o f Contents.
2.3.1.2. Stress Ratio (R)...72
2.3.1.3: SN Curves...73
2.3.2: Types of Fatigue Test... 74
2.3.3: Basic Elements of a Fatigue Test System... 77
2.3.3.1: The Load Train...77
2.3.3.2: Frame...78
2.3.3.3: Grips...78
2.3.3.4: Specimen... 78
2.3.3.5: Drive System... 79
2.3.3.6: Control System...79
2.3.3.7: Sensors...80
2.3.3.8: Communication System...80
2.3.4: Fatigue Failure Mechanism ...81
2.3.4.1: Crack Initiation...81
2.3.4.2: Crack Propagation... 82
2.3.5: Factors affecting Fatigue Properties... 84
2.3.5.1: Geometrical Factors... 84
2.3.5.2: Environmental Factors: Temperature...85
2.3.5.3: Environmental Factors: Corrosion... 85
2.3.5.4: Surface Finish and Treatment... 86
2.3.6: Fatigue of Tensile-Shear Spot Welded Joints...86
2.3.6.1: Joint Rotation...89
2.3.6.2: Loading Modes and Stress Intensity... 90
2.3.6.3: Fatigue Testing of Multi-Spot Welded Joints... 93
2.3.7: Models for Predicating Fatigue Behaviour in Spot Welded Joints...95
2.3.8: Factors Effecting Fatigue Properties of TSSW Joints...103
2.3.8.1: Sheet Thickness...104
2.3.8.2: Weld Nugget Size...105
Table o f Contents.
2.3.8.6: Non Geometric Factors... 108
2.3.9: Defining Fatigue Failure in TSSW Joints...109
2.3.10: Summary of Fatigue of TSSW Joints...111
2.4: EN AISI 301 Austenitic Stainless Steel...112
2.4.1: Resistance Weldability of AISI 301...114
2.4.2: Weld Quality...116
2.4.3: Summary of EN AISI 301 Austenitic Stainless Steel... 117
3. Methodology... 118
3.1: Experimental Techniques... 119
3.1.1: Lap-Shear Tests... 119
3.1.2: Staircase Fatigue Testing... 122
3.1.2.1: Analysis of Staircase Results...123
3.1.2.2: Applying 95% Confidence Limits to Staircase Results...128
3.1.3: Probit Fatigue Testing... 132
3.1.3.1: Determining Load Levels...132
3.1.3.2: Group Weighting... 133
3.1.3.3: Analysis of Response Curves121...134
3.1.3.4: Response Curve Example...135
3.1.3.5: Derived Estimate X(Y) [2]... 139
3.1.3.6: Derived Estimate Example...140
3.2: Experimental Procedure...141
3.2.1: Base Material Characterisation...141
3.2.2: Tensile Tests... 141
3.2.3: Hardness Tests...142
3.2.4: Weldability Study...142
3.3.5: Optimum Pitch Distance Study...146
3.3.5.1: Variation in Nugget Strength...148
Table o f Contents.
3.3.8.1: Staircase Fatigue Testing of Single Nugget Joints...161
3.3.8.2: Probit Testing of Single Nugget Joints... 162
3.3.8.3: Staircase Testing of Multi-Spot Welded Joints... 166
3.3.8.4: Defining Failure in Multi-Spot Welded Joints...170
3.3.9: Additional Experiments...173
3.3.9.1: Thermoelastic Stress Analysis (TS A )[661...173
4: Results...175
4.1: Base Material Characterisation...175
4.2: Weldability Study...176
4.3: Optimum Pitch Distance Study... 180
4.3.1: Variation in Nugget Strength... 180
4.3.1.1:12.5 mm Pitch Specimens...182
4.3.1.2:15 mm Pitch Specimens...184
4.3.1.3:17.5 mm Pitch Specimens... ...186
4.3.1.4: 20 mm Pitch Specimens...188
4.3.1.5: 30 mm Pitch Specimens...190
4.3.1.6: 40 mm Pitch Specimens...192
4.3.1.7: 50 mm Pitch Specimens...194
4.3.2: Variation in Nugget Diameter...196
4.3.2.1:12.5 mm Pitch Specimens...197
4.3.2.2:15 mm Pitch Specimens... 199
4.3.2.3:17.5 mm Pitch Specimens...201
4.3.2.4: 20 mm Pitch Specimens...203
4.3.2.5: 30 mm Pitch Specimens...205
4.3.2.6: 40 mm Pitch Specimens...207
4.3.2.7: 50 mm Pitch Specimens...209
4.3.3: Variation in Nugget Diameter at Extremely Close Pitch Distances...211
4.4: Fatigue Study...215
Table of Contents,
4.4.2.2: Calculations for the Derived Estimates... 221
4.4.3: Multi-Spot Weld Fatigue Testing... 222
4.4.3.1: Double Nugget Staircase Results...223
4.4.3.2: Four Nugget Staircase Results... 227
4.4.3.3: Eight Nugget Staircase Results... 232
4.4.3.4: Sixteen Nugget Staircase Results...239
4.4.4: Correlation between Predicted and Experimental Multi-Spot Weld Fatigue Properties. ...248
4.5: Thermoelastic Stress Analysis...250
5: Discussion...255
5.1: Base Material Characterisation... 255
5.2: Optimum Welding Parameter Investigation...255
5.3: Optimum Pitch Distance Investigation... 258
5.3.1: Variation in weld strength...258
5.3.2: Variation in Nugget Diameter... 260
5.4: Variation in Nugget Diameter at Extremely Close Pitch Distances... 261
5.5: Fatigue Testing...262
5.5.1: Staircase Fatigue Testing of Single Nugget Joints... 262
5.5.2: Probit Fatigue Testing of Single Nugget Joints...264
5.5.3: Multi-Spot Weld Staircase Testing Process...266
5.6: Correlation between Theoretical and Experimental Mean Fatigue Strength Data...270
5.7: Correlation between Theoretical and Experimental Standard Deviation Data...280
5.8: Thermoelastic Stress Analysis...281
5.9: Proposed Model...283
6: Conclusions... 284
6.1: Weldability Study...284
6.2: Optimum Pitch Distance Study... 284
Table o f Contents,
7: Further Work... 288
Table of Figures.
Fig 1.1: Normal distribution of spot weld fatigue strength... 27
Fig 1.2: Probability of survival at a given fatigue load...27
Fig 1.3: Survival conditions for a multi-spot welded joint...28
Fig 1.4: Mean and Standard Deviation of a fatigue strength distribution...29
Fig 1.5: Survival probabilities for 1 to 16 nugget joints at loads in terms of X+Kw xS...32
Fig 1.6: Changes in mean fatigue strength and standard deviation per nugget for joints with various numbers of nuggets (n)... 35
Fig 2.1: The welding process...44
Fig 2.2: A completed spot weld... 45
Fig 2.3: Areas of heat generation in spot welding[5]...47
Fig 2.4: Temperature gradients in spot welding t17]...48
Fig 2.5: A basic welding cycle... 50
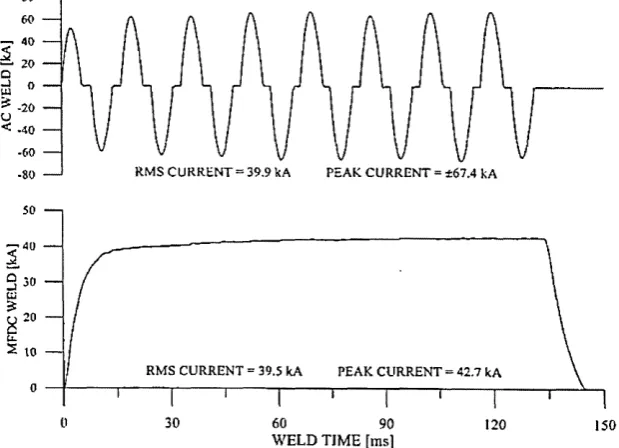
Fig 2.6: AC and DC power supply systems[21]...52
Fig 2.7: Surface asperities on joint overlap...57
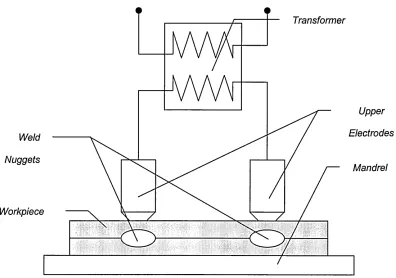
Fig 2.8: A multi-spot welder incorporating a mandrel...59
Fig 2.9: Current shunting in series welding...60
Fig 2.10: The basic single nugget TSSW joint...63
Fig 2.11: Edge distance... 64
Fig 2.12: Joint overlap...65
Fig 2.13: Nugget size...66
Fig 2.14: Sheet thickness...67
Fig 2.15: Width of TSSW joints...67
Fig 2.16: Pitch distance...68
Fig 2.17: Free length of TSSW joints...69
Fig 2.18: The fatigue stress cycle... 72
Fig 2.19: A typical S-N curve...73
Table o f Figures.
Fig 2.24: Fatigue crack propagation...82
Fig 2.25: Fatigue crack propagation in engineering materials...83
Fig 2.26: The effect of geometric factors on stress levels...84
Fig 2.27: Sheet crack initiation... 86
Fig 2.28: Sheet crack through thickness growth... 87
Fig 2.29: Lateral fatigue crack growth... 87
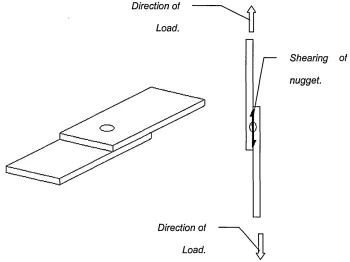
Fig 2.30: Shear fatigue failure... 88
Fig 2.31: Joint rotation in spot welded joints...89
Fig 2.32: The three modes of loading1481...90
Fig 2.33: Sheet and Shear failure initiation sites...91
Fig 2.34: Multi-spot welded ‘H’ specimens...93
Fig 2.35: Final crack size and direction of propagation in multi-spot welded H specimens... 94
Fig 2.36: Variation in fatigue crack growth rate... 96
Fig 2.37a: The effect of sheet thickness on joint stiffness (top)[55]...104
Fig 2.37b: The effect of sheet thickness on fatigue life (bottom)1551... 104
Fig 2.38a: The effect of spot weld diameter on the joint stiffness (top)1251...105
Fig 2.38b: The effect of spot weld diameter on Fatigue life (bottom)1251...105
Fig 2.39: Effect of sample width on fatigue strength...106
Fig 2.40: Effect of sample width on joint stiffness (top) and fatigue life (bottom)... 106
Fig 3.1: Typical load-extension graph obtained from a lap-shear test... 119
Fig 3.2: Weld pull-out or “button” failure mode... 120
Fig 3.3: Interface or weld shear failure mode...120
Fig 3.4: Example of a staircase chart... 123
Fig 3.5: Values for in G and H as a function of d/s[651...131
Fig 3.6: Example response curve plotted using least squares method...138
Fig 3.7: Dimensions for flat tensile test specimens...141
Fig 3.8: Specimen geometry of TSSW joints for weldability study...142
Fig 3.9: A basic welding cycle...143
Fig 3.13: Example multi-spot welding jig for optimum pitch distance study... 147
Fig 3.14: Dividing the samples into five individual specimens...148
Fig 3.15: Cutting accuracy for nugget diameter investigation...151
Fig 3.16: Dimensions of extreme pitch distance specimens... 152
Fig 3.17: Operation of extreme pitch distance specimen jig for first weld...153
Fig 3.18: Operation of extreme pitch distance specimen jig for second weld... 154
Fig 3.19: positioning of first and second welds...154
Fig 3.20: Difference in nugget diameters is always apparent, regardless of positioning of the sectioning cut...155
Fig 3.21: Geometry of 19 nugget TSSW fatigue specimens...156
Fig 3.22: Geometry of seventeen nugget TSSW fatigue specimens... 157
Fig 3.23: [LEFT] Geometry of single nugget TSSW fatigue specimens...158
Fig 3.24: [RIGHT] Geometry of double nugget TSSW fatigue specimens... 158
Fig 3.25: Geometry of four nugget TSSW fatigue specimens... 159
Fig 3.26: Geometry eight nugget TSSW fatigue specimens... 159
Fig 3.27: Geometry of sixteen nugget TSSW fatigue specimens... 160
Fig 3.28: PDF estimate derived from Staircase data...162
Fig 3.29: Second PDF estimate vs. first estimate... 164
Fig 3.30: Changes in theoretical mean fatigue strength per spot weld as the number of welds increases...169
Fig 3.31: Changes in theoretical standard deviation of the fatigue strength distribution per spot weld as the number of welds increases... 169
Fig 3.32: Schematic of the multi-spot welded joint monitoring system... 170
Fig 3.33: Photograph of the computer display showing the camera views for a sixteen nugget Staircase fatigue test...171
Fig 3.34: Photograph showing the three cameras that monitor one side of a sixteen nugget Staircase fatigue test... 171
Table o f Figures.
Fig 4.2: Consistency of weld strength with changes to spot welding parameters... 179
Fig 4.3: Sample 1 with weld positions running in sequence from top to bottom...182
Fig 4.4: Sample 2 with weld positions running in sequence from top to bottom..182
Fig 4.5: Sample 3 with weld positions running in sequence from top to bottom..183
Fig 4.6: Variation in nugget strength at 12.5 mm pitch...183
Fig 4.7: Sample 1 with weld positions running in sequence from top to bottom..184
Fig 4.8: Sample 2 with weld positions running in sequence from top to bottom..184
Fig 4.9: Sample 3 with weld positions running in sequence from top to bottom...185
Fig 4.10: Variation in nugget strength at 15 mm pitch... 185
Fig 4.11: Sample 1 with weld positions running in sequence from top to bottom...186
Fig 4.12: Sample 2 with weld positions running in sequence from top to bottom...186
Fig 4.13: Sample 3 with weld positions running in sequence from top to bottom... 187
Fig 4.14: Variation in nugget strength at 17.5 mm pitch...187
Fig 4.15: Sample 1 with weld positions running in sequence from top to bottom... 188
Fig 4.16: Sample 2 with weld positions running in sequence from top to bottom...188
Fig 4.17: Sample 3 with weld positions running in sequence from top to bottom... 189
Fig 4.18: Variation in nugget strength at 20 mm pitch... 189
Fig 4.19: Sample 1 with weld positions running in sequence from top to bottom... 190
Fig 4.20: Sample 2 with weld positions running in sequence from top to bottom... 190
Fig 4.21: Sample 3 with weld positions running in sequence from top to bottom... 191
Fig 4.22: Variation in nugget strength at 30 mm pitch... 191
Fig 4.23: Sample 1 with weld positions running in sequence from top to bottom... 192
Fig 4.24: Sample 2 with weld positions running in sequence from top to bottom... 192
Fig 4.25: Sample 3 with weld positions running in sequence from top to bottom... 193
Fig 4.26: Variation in nugget strength at 40 mm pitch...193
Fig 4.27: Sample 1 with weld positions running in sequence from top to bottom...194
Fig 4.28: Sample 2 with weld positions running in sequence from top to bottom... 194
Fig 4.29: Sample 3 with weld positions running in sequence from top to bottom...195
Fig 4.33: Weld 3...197
Fig 4.34: Weld 4... 198
Fig 4.35: Weld 5... 198
Fig 4.36: Variation in nugget diameter at 12.5 mm pitch...198
Fig 4.37: Weld 1... 199
Fig 4.38: Weld 2... 199
Fig 4.39: Weld 3... 199
Fig 4.40: Weld 4...200
Fig 4.41: Weld 5...200
Fig 4.42: Variation in nugget diameter at 15 mm pitch...200
Fig 4.43: Weld 1...201
Fig 4.44: Weld 2...201
Fig 4.45: Weld 3...201
Fig 4.46: Weld 4 ...202
Fig 4.47: Weld 5...202
Fig 4.48: Variation in nugget diameter at 17.5 mm pitch...202
Fig 4.49: Weld 1...203
Fig 4.50: Weld 2...203
Fig 4.51: Weld 3...203
Fig 4.52: Weld 4 ...204
Fig 4.53: Weld 5...204
Fig 4.54: Variation in nugget diameter at 20 mm pitch... 204
Fig 4.55: Weld 1...205
Fig 4.56: Weld 2... 205
Fig 4.57: Weld 3...205
Fig 4.58: Weld 4 ... 206
Fig 4.59: Weld 5... 206
i able o f Figures.
Fig 4.64: Weld 4 ...208
Fig 4.65: Weld 5...208
Fig 4.66: Variation in nugget diameter at 40 mm pitch...208
Fig 4.67: Weld 1...209
Fig 4.68: Weld 2...209
Fig 4.69: Weld 3...209
Fig 4.70: Weld 4 ...210
Fig 4.71: Weld 5...210
Fig 4.72: Variation in nugget diameter at 50 mm pitch... 210
Fig 4.73: Different in nugget diameter between two welds made at 6 mm pitch distances 211 Fig 4.74: Specimen 1 Weld 1... 212
Fig 4.75: Specimen 1 Weld 2... 212
Fig 4.76: Specimen 2 Weld 1...212
Fig 4.77: Specimen 2 Weld 2... 212
Fig 4.78: Specimen 3 Weld 1...213
Fig 4.79: Specimen 3 Weld 2...213
Fig 4.80: Specimen 4 Weld 1...213
Fig 4.81: Specimen 4 Weld 2...213
Fig 4.82: Specimen 5 Weld 1...214
Fig 4.83: Specimen 5 Weld 2...214
Fig 4.84: Single nugget Staircase results...215
Fig 4.85: Single nugget Probit results... 218
Fig 4.86: Single nugget Probit response curve... 220
Fig 4.87: Double nugget Staircase results... 223
Fig 4.88: Example double nugget video monitor screen grabs from side 1 of a specimen. From left to right: test start, failure conditions met, complete failure... 226
Fig 4.89: Example double nugget video monitor screen grabs from side 2 of a specimen. From left to right: test start, failure conditions met, complete failure... 226
Table of Figures.
Fig 4.92: Example four nugget video monitor screen grabs from side 2 of a specimen. From top
to bottom: test start, failure conditions met, complete failure...231
Fig 4.93: Eight nugget Staircase results... 232
Fig 4.94: Example eight nugget video monitor screen grabs from one half of side 1 of a
specimen. From top to bottom: test start, failure conditions met, complete failure 235
Fig 4.95: Example eight nugget video monitor screen grabs from second half of side 1 of a
specimen. From top to bottom: test start, failure conditions met, complete failure 236
Fig 4.96: Example eight nugget video monitor screen grabs from one half of side 2 of a
specimen. From top to bottom: test start, failure conditions met, complete failure 237
Fig 4.97: Example eight nugget video monitor screen grabs from second half of side 2 of a
specimen. From top to bottom: test start, failure conditions met, complete failure 238
Fig 4.98: Sixteen nugget Staircase results... ... 239
Fig 4.99: Example sixteen nugget video monitor screen grabs from the outside edge of side 1 of
a specimen. From top to bottom: test start, failure conditions met, complete failure 242
Fig 4.100: Example sixteen nugget video monitor screen grabs from the middle of side 1 of a
specimen. From top to bottom: test start, failure conditions met, complete failure 243
Fig 4.101: Example sixteen nugget video monitor screen grabs from the inside edge of side 1 of
a specimen. From top to bottom: test start, failure conditions met, complete failure 244
Fig 4.102: Example sixteen nugget video monitor screen grabs from the outside edge of side 2
of a specimen. From top to bottom: test start, failure conditions met, complete failure 245
Fig 4.103: Example sixteen nugget video monitor screen grabs from the middle of side 2 of a
specimen. From top to bottom: test start, failure conditions met, complete failure 246
Fig 4.104: Example sixteen nugget video monitor screen grabs from the inside edge of side 2 of
a specimen. From top to bottom: test start, failure conditions met, complete failure 247
Fig 4.105: Correlation between predicted and experimental multi-spot weld mean fatigue
strength... 248
Fig 4.106: Correlation between predicted and experimental multi-spot weld standard deviation.
Table of Figures.
Fig 4.110: Test two 400K cycles...251
Fig 4.111: Test two 500K cycles...252
Fig 4.112: Test two 600K cycles...252
Fig 4.113: Test two 700K cycles... 252
Fig 4.114: Test two 800K cycles... 253
Fig 4.115: Test two 900K cycles... 253
Fig 4.116: Test two 1000K cycles...253
Fig 4.117: Test two 1050K cycles...254
Fig 4.118: Test two 1075K cycles...254
Fig 5.1: Even fatigue cracking in single spot welded joints...263
Fig 5.2: Uneven fatigue cracking in single spot welded joints...263
Fig 5.3: Comparison of Staircase PDF estimate and Probit response curve...264
Fig 5.4: Group of cracked welds occurring in the middle of an eight weld specimen...267
Fig 5.5: Group of cracked welds occurring at the edge of an eight weld specimen...267
Fig 5.6: Rotation of upper jaw and actuator...268
Fig 5.7: Correlation between theoretical and experimental mean fatigue strength data...270
Fig 5.8a: Probability of two identical spot welds surviving two individual fatigue tests using an
applied load equal to their mean fatigue strength...272
Fig 5.8b: Probability of double weld joint surviving a fatigue test using a proportionally identical
load...272
Fig 5.9: Effect of sample width on fatigue strength [54)... 276
Fig 5.10: Perceived affect of increases in width on mean fatigue strength... 278
Table of Tables.
Table 1.1: Probaiblity of survival for various values of n at various levels of Kw...31
Table 2.1: AISI 301 % Hardened Chemical D ata[58,591... 113
Table 2.2: AISI 301 V4 Hardened Mechanical D ata[57)...113
Table 2.3: AISI 301 % Hardened Physical D ata[57]... 113
Table 3.1: Example of data collected from a typical Staircase test... 124
Table 3.2: Relative group sizes based on expected survival per cent...133
Table 3.3: Hypothetical Probit fatigue test results...135
Table 3.4: Hypothetical transformed Y values...136
Table 3.5: Response curve for hypothetical Probit fatigue test data...136
Table 3.6: Derived estimates for hypothetical Probit fatigue test data...140
Table 3.7: Initial load range levels and group sizes chosen for Probit tests...165
Table 3.8: Adjusted load range levels and group sizes chosen for Probit tests...165
Table 3.9: Mean fatigue strength and standard deviation of the fatigue strength distribution
values for whole multi-spot welded joints... 167
Table 3.10: Adjusted mean fatigue strength and standard deviation of the fatigue strength
distribution values for whole multi-spot welded joints... 168
Table 4.1: Tensile test results of the supplied AISI 301...175
Table 4.2: Vickers hardness test results for the supplied AISI 301... 175
Table 4.3: Lap-shear results for weldability study... 176
Table 4.4: Lap-shear results for weldability study continued... 177
Table 4.5: Lap-shear results for variation in weld strength study for pitch distances of 12.5 mm
and 15 mm...180
Table 4.6: Lap-shear results for variation in weld strength study for pitch distances of 17.5 mm,
20 mm, 30 mm, 40 mm and 50 mm...181
Table 4.7: Variation in nugget diameter at various pitch distances... 196
Table 4.8: Variation in nugget diameter at 6 mm pitch distances...211
Table o f Tables,
Table 4.13: Double nugget Staircase results...224
Table 4.14: Four nugget Staircase results...228
Table 4.15: Eight nugget Staircase results... 233
Table 4.16: Sixteen nugget Staircase results...240
Table 5.1: Average width per spot weld (mm) for each of the multi-spot welded joints tested..274
Table 5.2: Increase in the mean fatigue strength of the corresponding multispot welded joint
-single nugget joint compared to the -single nugget joints tested... 277
Table 5.3: Increase in joint width of corresponding multi-spot welded joint - single nugget joint
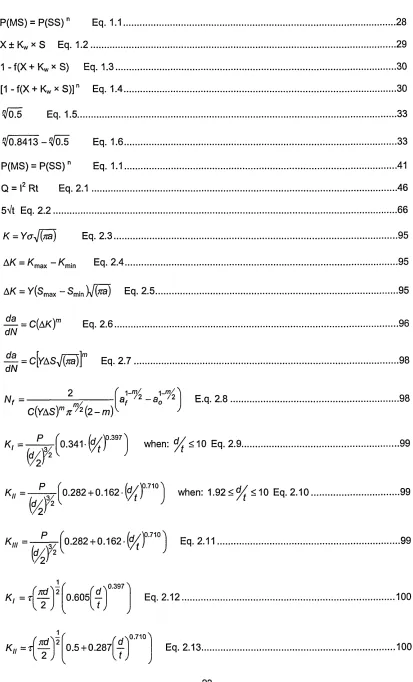
Table o f Equations.
Table of Equations.
P(MS) = P (S S )n Eq. 1.1...28
X ± Kw x S Eq. 1 .2 ...29
1 - f(X + Kw x S) Eq...1.3...30
[1 - f(X + Kw * S )]n Eq. 1.4...30
rfo.5 Eq. 1.5...33
^ 0 . 8 4 1 3 - ! ^ Eq. 1.6...33
P(MS) = P (S S )n Eq. 1.1...41
Q = I2 Rt Eq. 2 .1 ...46
5Vt Eq. 2 .2 ...66
K = YaJlna) Eq. 2 .3 ... 95
AK = Kmax- K min Eq. 2.4... 95
AK = ^(^max “ ^min )\/(^ ) ^9- 2-5... 95
— = C(AK)m
Eq. 2.6.
dN
v
.96
— = c[xASVM ]m Eq. 2.7
dN
.98
Nf =
C(VAS)m
jt^2
(2 - m)'
1- % 1- %
a, 72 - a, 72
E.q. 2.8
.98
K, = ' T ^ ’( 0-341' ^ ’397) when: % S 1 ° Eq- 2-9’ .99
= — ^ [^ 0 .28 2 + 0.162-(^/)°‘71° j when: 1.92
<d/(
< 10 Eq. 2.10,
V2.)
K,„
= - ^ [ o . 2 8 2 + 0 .1 6 2 .( % 'P ] Eq.2.11...
.99
.99
K
,=rl
2K,„ = r\ Z p 2 0.5 + 0.287
(
(
VN f = A(AE)~3 Eq. 2.15
APA0N%
. 0.71 'V
f\ — \ Eq. 2.14.
w .100
.102
A E = Eq. 2.16... 102
E fi = L0 + d \ ^ ± ± \ Eq. 3.1. .125
s = 1.620c/ B N - A 2
N 2 + 0.029 Eq. 3 .2 ... 126
BN — A2
Convergence Factor = --- — Eq. 3 .3 ... 127
N
s = 0.53c/ Eq. 3 .4 ...127
Eq- 3-5 ... 128
sm =■Gs
V/v
m ± ksm Eq. 3.7
Eq. 3 .6 ...128
.129
CTc =
42N
Hs
V/v
s ± k s s Eq. 3.10
Eq. 3 .8 ... 129
Eq. 3 .9 ...130
.130
T ( X Y ) - k X Y
Slope,
b
= — --- Eq. 3.11...1342 X 2 - k X
intercept, a = Y Eq. 3.12... 134
Yf = a +
b ( x - x )
Eq. 3.13... 135X ( y ) = X + ^ - ^ Eq. 3.14...139
Sm = dn * S Eq. 3 .17 ... 167
Xm = Xs - (mn x S) Eq. 5.1... 283
1: Introduction.
Multi-spot welded joints are routinely used in the automotive and other industries to produce
structurally critical components. Unfortunately the size and complexity of the joints often limits
the practicality of testing their mechanical properties, particularly when long term testing is
required, such as in the case of determining fatigue properties.
Conversely, single spot welded joints are easily produced and can be tested on existing
equipment with little or no modification. Clearly it would be extremely advantageous to be able
to predict the fatigue properties of a multi-spot welded component based on the data obtained
from testing single spot welded joints.
Currently there are several models that propose methods for predicting the fatigue life of a given
joint of simple geometry, the majority of which are based on a fracture mechanics approach.
However, as more spot welds are added and the complexity of the joint increases, these
existing models tend to lose their accuracy.
This project intends to determine whether it is possible to divide a complex multi-spot welded
joint into its individual welds and determine the overall fatigue properties of the joint as a whole
by understanding the fatigue properties of the individual welds. If this process proves successful
then the accuracy of the existing fracture mechanics models could still be maintained even for
1.1: Theoretical Model.
To determine all the factors that should be considered in a model that uses the proposed
approach, a baseline must first be established using the simplest situation.
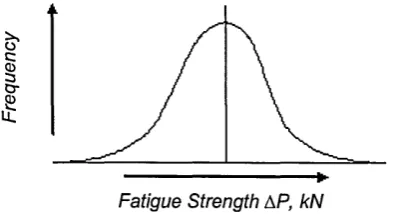
The fatigue strength distribution for a given type of single spot welded joint, for a cycle life of 106
cycles, can be assumed to fit a normal distribution. The majority of specimens will be expected
to have a particular fatigue strength (the mean fatigue strength), with fewer and fewer
specimens exhibiting strengths higher or lower than this value m'
cQ =3
Fatigue Strength AP, kN
Fig 1.1: Normal distribution of spot weld fatigue strength.
The probability of a particular single spot welded joint surviving a specific fatigue load, A, will be equal to the probability that the joint has a fatigue strength equal to or higher than that load.
This is represented by the integral of the area under the normal distribution curve between the
specific load, A, and +«>, which is equivalent to the difference between the total area under the curve and the cumulated area up to load A m.
[image:29.615.189.386.235.342.2] [image:29.615.203.384.536.658.2]If it is assumed that all the welds present in a multi-spot welded joint have equal properties and
the fatigue load is evenly distributed, such that each spot weld is supporting an equal portion of
the overall fatigue load at all times, then each spot weld will have an identical probability of
survival and the failure or survival of each spot weld can be described as a statistically
independent event. If the survival criterion of the multi-spot welded joint is then defined as the
survival of 100% of the constituent welds, then the probability of survival for the entire multi-spot
welded joint will be equal to the product of the survival probabilities of each individual spot weld,
as defined my the multiplication rule of probability[1).
o
AND
o
AND
o
...etcWELD 1
must survive
O
WELD 2
must survive
O
WELD 3
must survive
O
- etc Probability of WELD 1 Probability of WELD 2 Probability of WELD 3Surviving N cycles Surviving N cycles Surviving N cycles
Fig 1.3: Survival conditions for a multi-spot welded joint
Using these boundary conditions, and the principals of the multiplication rule, a simplified
relationship model can be determined, which suggests that the probability of a multi-spot
welded joint surviving a fatigue test with a specific fatigue load applied to each individual weld
nugget, will be equal to the probability of survival for a single spot welded joint supporting the
same fatigue load to the power of n, where n is the number of weld nuggets present in the joint.
P(MS) = P (S S )n Eq. 1.1
Where:
P(MS) = Probability of survival for a multi-spot weld joint
Literature Review,
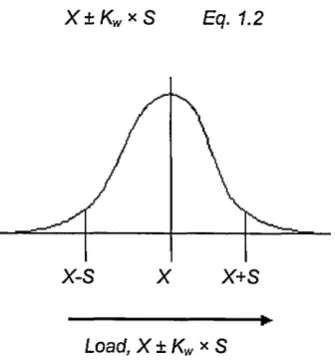
By maintaining the premise that the fatigue strength of a given spot welded joint is normally
distributed, and if the mean fatigue strength (which is the load that will give a 50% chance of
survival), for a cycle life of 106, for a single spot welded joint is denoted as X, and the fatigue strength distribution is said to have a standard deviation of S, then the various values for fatigue
load can be generalised as the mean strength, X, plus or minus some coefficient, Kw, of the standard deviation, S.
X ± K W* S Eq. 1.2
X-S X X+S
►
Load, X ± K W* S
[image:31.615.213.381.177.359.2]If, for convenience, the probability of survival for a single spot welded joint at any given fatigue
load is summarised as the total area under the distribution curve, 1, minus a function of the
given fatigue load, which represents the cumulated area under the curve up to that fatigue load,
then the probability of a joint surviving the 106 cycles at any fatigue load can be generalised as:
1 - f(X + Kw* S) Eq. 1.3
Where:
1 = The total area under the distribution curve.
X = The mean fatigue load for a single spot weld joint.
Kw = Any real number.
S = The standard deviation of the distribution for a single
spot weld joint.
f(X + Kw* S) = The cumulated area up to the load X + Kw * S, which,
as discussed, can represent any fatigue load.
Similarly, the survival probability of a multi-spot welded joint tested under the same conditions,
except with the same fatigue load applied to each individual weld nugget, can be generalised
as:
[1 -f(X + Kw * S )] n Eq. 1.4
Where:
1-f(X + Kw x S) = The probability of survival for a single spot weld joint
at an applied fatigue load of X + Kw* S
n = The number of weld nuggets present in the multi
As X and S are constants, survival probability values for various multi-spot weld joints can be determined for various values of Kw using standard normal distribution tables, since the Z values used in these tables reflects the number of standard deviations a variable lies above or below a
mean value and therefore corresponds directly to Kw.
Kw n = 1 n =2 n = 4 c II CO n = 16 0.0 0.500 0.250 0.062 0.004 0.000
-0.5 0.691 0.478 0.229 0.052 0.003
-1.0 0.841 0.708 0.501 0.251 0.063
-1.5 0.933 0.871 0.758 0.575 0.331
-2.0 0.977 0.955 0.912 0.832 0.692
-2.5 0.994 0.988 0.975 0.951 0.905
-3.0 0.999 0.997 0.995 0.989 0.979
Table 1.1: Probaiblity of survival for various values of n at various levels of Kw.
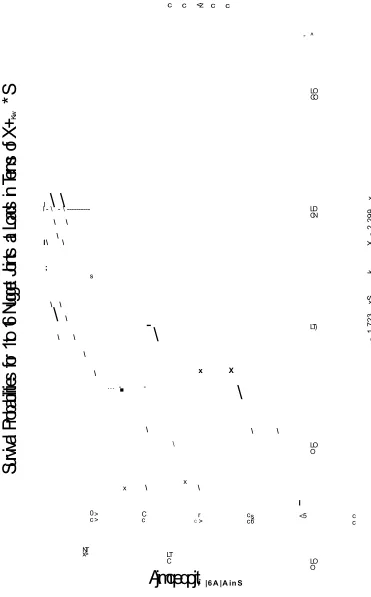
Plotting this data generates the graph shown in Fig 1.5, which depicts how the probability
distribution changes as n increases. From Fig 1.5 the mean fatigue strength and standard deviation of the fatigue strength distribution per nugget of any multi-spot welded joint can be
related to the mean fatigue strength and standard deviation of the fatigue strength distribution of
Su
rviv
al
Pro
bab
ilitie
s
for
1 to
16
Nu
gge
t J
oin
ts
at L
oad
s
in T
erm
s
of
X +
Kw* S
Literature Review.
CM COCD
II II II II II
c c <z c c
- ^
LO CO
I
\ \
l - \ - \ --- LD
\ \ \ l\ \
; CN \ \
\
\ s-
LT) \ \ \ \ ... --\
x X ■ \ \\
\ \ LOx \ x \
I O 0 c NT x>
> C
> c
LT C
Ajmq
C
eqojt
r c
> c
i |6A |A in S
s <
6 5 c c
LO O
Fig 1.5: Survival probabilities for 1 to 16 nugget joints at loads in terms of X+Kw xs.
[image:34.612.110.481.59.656.2]For example the mean fatigue strength per nugget for a sixteen nugget joint can be related to
the mean fatigue strength and standard deviation of a single spot welded joint as:
X -1.723 x S
Therefore mn = 1.723
Similarly, the standard deviation per nugget for a sixteen nugget joint can be related to the
mean fatigue strength and standard deviation of a single spot welded joint as:
( X - 2.299 x S) - (X - 1.723 x S) = 0.576 x S
Therefore dn = 0.576
Values for dn and mn can be summarised for any multi-spot welded joint by the Z value read
from the standard normal distribution tables required to give the following probabilities:
mn: Z value for a probability of:
3/05 Eq. 1.5
dn: Z value for a probability of:
3/0.8413 - ^ 0 5 Eq. 1.6
Where:
Literature Review.
Plotting the values of mn and dn for increasing values of n produces a graphical representation (Fig 1.6) of how mean fatigue strength and standard deviation per nugget changes as the
number of weld nuggets in the joint increases. Therefore, according to this basic theory, it
should be possible to predict the fatigue properties of a multi-spot welded joint from the
1.2: Boundary Conditions.
In order to determine if confidence in the suggested theory is justified, certain assumptions and
boundary conditions need to be established to control as many of the parameters as possible.
(1) All welds must have equal properties.
Without equal properties the fatigue strength distribution will be different for each weld, meaning
that the probability of survival for each weld, tested using a given set of test parameters, will
vary. This will mean that the relationship between the fatigue strength distribution of single and
multi-spot welded joints will not fit the simple power relationship explained here.
In order to achieve equal properties it will be necessary to develop a production technique that
ensures that the individual nuggets in a multi spot welded joint can be considered to be
'indentical' in both the properties of the nugget and how that section of the joint responds to a
given fatigue load.
(2) Each individual weld in a multi-spot welded speciemen must support an identical
portion of the overall fatigue load throughout the test.
If this condition is not fulfilled and maintained then, much like the requirement for equal nugget
properties, the survival probability of each nugget in the joint being tested will lie at a different
point on the distribution curve and will therefore have a different value. To maintain a balance of
fatigue load consideration must be made to the design of the specimens. Attention must also be
paid to the fatigue equipment to ensure the load train is rigid enough to distribute and support
Literature Review.
(3) The survival or failure of an individual spot weld in a multi-spot welded joint must be
an independent event.
In order for the events to be statistically independent the probability of survival or failure of any
individual spot weld must not be dependent on the conditional surival or failure of any other spot
weld. If the events are not independent then the simple multiplication rule used to define the
probability of survival in a multi-spot welded joint will not apply. The events can be assumed to
be independent if an equal portion of the load is support by each spot weld for the duration of
the fatigue test and all the welds are identical. Therefore, in order to furfil this criteria, failure
must be defined as the instance when one of the welds stops supporting an equal share of the
overall load.
(4) The failure criteria for single and multi-spot welded joints must be the same.
As mentioned, the proposed theory is based on the condition that in order for a multi-spot
welded joint to survive, none of the welds present in that joint can fail prior to the completion of
the designated cycle life. In orer to maintain the link between the single and multi-spot welded
joints, that which defines failure in the single welded specimens must also define failure in any
one of the indiividual spot welds that make up the multi-spot joints. Therefore the conditions for
failure for a single spot welded joint and the individual welds present in a multi-spot welded joint
must be identical.
(5) The fatigue strength distriubtion for single and multispot welded joints must fit the
normal probability function.
Literature Review,
1.3: Proposed Methodology.
To verify this theory, values for the mean fatigue strength and the standard deviation of the
fatigue strength distribution, per nugget, for joints containing one, two, four, eight, and sixteen
nuggets, for a cycle life of 106 cycles, would need to be determined experimentally. Particular
attention would need paying to the values for the single spot welded joints since these values
form the basis of the proposed theoretical model.
Once values for the mean fatigue strength and the standard deviation of the fatigue strength
distribution per nugget are determined experimentally for the multi-spot welded joints they can
be compared to the theoretical values determined from inputting the single nugget values into
the proposed theory.
This process of comparison will highlight any possible anomalies associated with increasing the
number of weld nuggets within a joint that are not considered in the initially proposed theory.
Should any such anomalies become apparent, then the data collected will assist in pinpointing
their cause, allowing for the next stage of model development.
In order to define statistically valid values for mean fatigue strength and standard deviation
experimentally, a comprehensive series of fatigue tests will need to be carried out that will
reveal the probability of survival at various loads for each of the specimen configurations. Since
the required data is only concerned with whether the sample survived by completing 106 cycles,
or whether it failed before completing 106 cycles, a response testing approach would be most
suitable. There are two types of response test that will be of particular use in this investigation,
The Staircase testing process is a fatigue response testing approach that can determine a
mean value for the fatigue strength of the specimens to be examined in this investigation from a
relatively small number of tests t2,31. The data collected by the Staircase method can also be
used to calculate a value for the standard deviation of the fatigue strength distribution for a
given specimen configuration, although this is less accurate than the value calculated for the
m __n [2, 4]
mean
The Probit method of testing is used to determine the complete Probability Density Function
(PDF) of the fatigue strength for a given specimen configuration. The common procedure is to
divide the specimens available into several groups and to test one group at a chosen load level,
the next group at a second level and so on. The data is then evaluated by considering the
number of failures and survivals occurring at each of the load levels and plotting the data as a
‘Response Curve’. The response curve will give an accurate representation of the complete
PDF for a given specimen configuration, however, the number of specimens required for a
Literature Review,
Since the data on the single weld specimens will form the basis of the proposed model a more
comprehensive analysis needs to be carried out on those specimens. Therefore, the single weld
investigation will consist of both a Staircase and Probit testing process. The Staircase process
will determine initial values for the mean fatigue strength and standard deviation of the fatigue
strength distribution for single spot welded joints. These initial values will then be used to
determine load levels for a Probit testing process, which will accurately determine the complete
PDF for the fatigue strength of the single welded specimens.
The data taken from the Probit testing of single spot weld specimens will then be used in
accordance with the proposed theory to generate estimate values for mean fatigue strength and
standard deviation, per nugget, for joints consisting of two , four, eight, and sixteen nuggets.
A Staircase testing process will then be carried out on each of these specimen configurations to
determine the actual values for mean fatigue strength and standard deviation per nugget. The
experimental result will then be compared to the theoretically determined ones, allowing for a
1.3.1: Summary of Proposed Theoretical Model.
Mathematically the fatigue strength distribution, and therefore the fatigue propoerties, of a multi
spot welded joint consisting of welds that are ostensibly identical, can be shown to be
proportional to those of an ostensibly identical single spot welded joint in the following way
(taking into account certain boundary conditions):
P(MS) = P(S S )n Eq. 1.1
To establish whether confidence in the proposed model is justified a fatigue testing regime
Li (era ture Re vi e vv,
2: Literature Review.
In order to accurately evaluate the proposed theory, consideration needs to be given to the
major process steps in both the manufacture and testing of the various specimen
configurations. Understanding the major process steps will allow for appropriate measures to be
taken to control the various variables associated with this investigation and assist in the overall
compliance with the established boundary conditions. The following section reviews published
work and research, which covers the main processes to be used in this project.
2.1: Fundamentals of Resistance spot Welding.
Resistance Spot Welding (RSW) was first introduced by Elihu Thompson more than 100 years
ago. The process is most commonly used for the fabrication of sheet metal assemblies up to 5
mm in thickness when the design permits the use of lap joints and airtight seams are not
required [5]. Thicker sections can also be welded in this manner, however, the loading of the
joint is limited and the extra weight added by the large overlap puts the process at a
disadvantage when compared to other processes that do not require a lap, such as laser
welding [6’7' 8’51.
Joints are made by creating spot welds at intermittent intervals on overlapping sheets of metal.
The process is used in preference to mechanical fasteners, such as rivets and screws, when
disassembly for maintenance is not required [91‘ RSW is also much faster and more economical
since a separate fastener is not needed for the assembly.
The process is used extensively for joining low carbon steel sheet metal components for
automobiles, cabinets, furniture, ventilation systems, and in the construction sector.
Developments in the process have also helped to optimise the process for welding modern
Literature Review,
2.1.1: Advantages and limitations.
The major advantages of spot welding are its high speed and its adaptability for automation
when used in the production of sheet metal assemblies. It can be incorporated into assembly
lines with other fabrication operations with relative ease and is also regarded as an economical
process in many operations using semiautomatic machines, since it is faster than arc welding or
brazing and requires less skill to perform l9].
The process also has some limitations, the three major ones being:
1. The added weight caused by the need for an overlap[9].
2. Spot welded joints are considered to have a low fatigue strength, this is due to the
presence of a crack-like notch around the periphery of the nugget, between the joined
sheets[9].
3. The full strength of the sheet can not be utilised across the spot welded joint because
Literature Review.
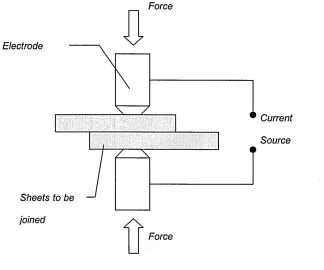
2.1.2: The Welding Process.
Resistance spot welding involves the joining of the faying surfaces of two or more sheets of
metal in a localised area by the application of heat and pressure[11,12].
Force
Electrode
• Current
Source
Sheets to be joined
Force
Fig 2.1: The welding process.
The heat is supplied by a short pulse of electric current between two water cooled, copper alloy
electrodes, through the workpiece and across the gap separating them, this path is known as
the ‘secondary circuit’ [11]. The electrical resistance in this circuit is at a peak at the join between
the two sheets. This means that the transfer of current across this gap generates a tremendous
[image:46.612.136.460.122.392.2]Lit e rat are ft s vie w.
The level of heat generated in this area is so high that the metal of the two sheets melts and
runs together creating a molten pool at the sheet interface. At the same time the clamping force
applied by the electrodes creates an intimate bond between the two sheets, containing this weld
pool in a localised area. Once the current is switched off, the continued application of this force
helps to consolidate the weld pool into a weld nugget, with a higher potential for an improved
grain structure when compared to other welding processes[6,11,14,13].
Finished Weld
Literature Review.
2.1.3: Generating Heat.
The passage of current through a circuit is caused by creating a region of potential difference
between two points, in the case of spot welding, this potential difference is found between the
two electrodes. By generating a potential difference between two points in a circuit, an electric
field is created. This field causes the electrons in the circuit to move in the direction of the
voltage drop. These electrons carry a charge across the circuit, therefore generating a current.
Inevitably these travelling electrons collide with the stationary ion cores of the material that
makes up the circuit. Each of these collisions will involve a degree of friction, which generates a
small amount of heat. The amount of friction created by these collisions is a measure of the
materials electrical resistance. Higher electrical resistances mean larger amounts of friction,
which leads to larger amounts of energy being released in the form of heat when the collisions
occur [16, 111. The amount of heat that is generated when producing a spot weld through
resistance heating is therefore a function of the amount of heat energy released by friction
between the colliding electrons and ion cores. This is primarily controlled by three factors:
1. The amount of welding current used [6,51.
2. The duration that this current flows fo r[6,5].
3. The electrical resistance at various points in the secondary circuit[6,5].
The relationship between these three factors, and the amount of heat generated, can be
approximated using Joule’s Law, which calculates the amount of heat liberated by current
travelling through a resistor for a given amount of tim e[6,11*13,51.
Eq.2.1
Where:
Q Heat generated (Joules).
/ Welding current (Amperes).
Lit era turn Re view.
For a more accurate calculation the effect of the following factors would also need to be
accounted fo r[15,12]:
1. The heat lost through conduction.
2. The heat lost through radiation.
From joules Law it can be seen that heat will be generated at any point in the secondary circuit
that offers a resistance to the flow of current. In a joint consisting of two sheets there are at least
seven areas of resistance where heat will be generated [5]. These areas are illustrated in Fig 2.3
on the next page.
Water
At end of weld time
Electrode After 20%
of weld time
Work
Welding
temperature temperatureInitial
iUipa
Water
Electrode
Temperature
Fig 2.3: Areas of heat generation in spot welding[5].
1 and 7
2 and 6
3 and 5 4
The electrodes.
The interface between the electrodes and the workpiece. The workpiece itself.
Literature Review.
Since the welding current and the time for which it is applied will be constant across all these
regions, the amount of heat generated in each of these seven locations will be proportional to
and the heat at all other locations should be minimised. Since the greatest resistance is located
at region 4, heat is most rapidly developed at that location [5,10,15,11]. Regions 2 and 6 offer the
next highest level of resistance and the temperature also rises rapidly at these locations.
However, the heat generated in regions 2 and 6 is rapidly dissipated in the highly conductive,
water cooled, copper alloy electrodes [11]. The heat that is maintained in regions 2 and 6 helps
maintain the rate of temperature rise in region 4 by retarding the heat lost through conduction
into the workpiece, allowing welding temperature to be reached much more quickly [5' 10,15]. their resistance [5, 10, 5, 11]. Welding heat, however, is required only at the workpiece interface,
Electrode Temperaturedeg C i 1500
Plates to be bonded
Area of weld
Electrode
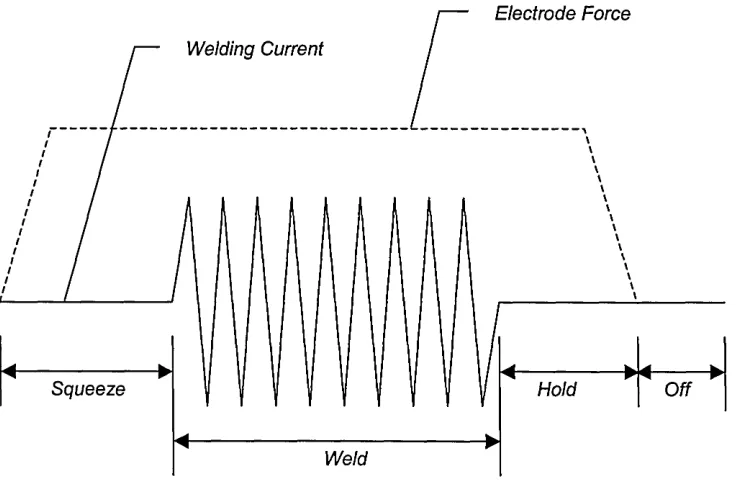
2.1.4: The Welding Cycle.
Despite the speed of RSW, a well defined sequence of events needs to occur during the
welding process in order for acceptable results to be achieved. This sequence can be adjusted
to maximise the throughput[181.
Every resistance spot weld consists of four major time segments, with each segment taking up a
portion of the total weld time. In order to maximise throughput, the four segments need to occur
seamlessly in the fraction of a second it takes to make each weld, they occur in the following
order118' 5' 151:
• Squeeze.
• Weld.
• Hold.
• Off.
Squeeze Time: This is the interval of delay between timer initiation and application of the
welding current. It provides time for the welding head to bring the upper electrode into contact
with the workpiece and apply the full amount of force. This time should be sufficient to ensure
that all the parts of the joint have attained an intimate contact before current is applied [38,15,13].
The magnitude of squeeze time should be minimised to maximise throughput but will be
ultimately depend upon the distance between the electrodes and the hardness of the material.
Typically industry aims for a value around 0.5 seconds[66].
Weld Time: This is the interval during which the welding current flows through the circuit[13,5’ 15].
The magnitude of the weld time is dependent upon the material being welded, but for most
Literature Review.
Hold Time: This is the interval in which force is maintained on the workpiece after the last
impulse of current ceases flow. This interval takes pla