Simulated biogas for nickel-based solid oxide fuel cells
Jianjun Ma, Cairong Jiang, Mark Cassidy and John T. S. Irvine
School of Chemistry, University of St Andrews, KY16 9ST, United Kingdom
Biogas is composed of variable gases including hydrogen, nitrogen and sulphur, with methane and carbon dioxide as the main components. The common ratio of methane to carbon dioxide is 60/40 in volume and this high amount of methane causes carbon deposition when biogas is used in solid oxide fuel cells. To prevent carbon deposition, dry reforming, steam reforming or partial oxidation is the common method. In this paper, a nickel cermet solid oxide fuel cell was investigated with a simulated biogas based on 63% CH4 and 37% CO2, which was obtained by
presuming 80% fuel utilisation and 25% recirculation of anode gas. Supplied with a 30 ml/min of simulated biogas, the cell generated a maximum power density of 856 mW cm-2 at 850 °C. The cell ran
stably at loads of 100 mA cm-2, 300 mA cm-2and 500 mA cm-2 over a period of 16 hours at each level.
Introduction
Biogas is a readily available resource, attracting much attention in meeting the demand for renewable energy and the reduction of CO2 emissions. The composition of biogas
varies according to place, time and biological process. The usual biogas is composed of 50-70% methane, 25-50% carbon dioxide, 1-5% hydrogen, 0.3-3% nitrogen and some other minor impurities(1-2). Recently, efforts have been made to convert the chemical energy of biogas into electricity in a clean and efficient way (3-5). Solid oxide fuel cells offer the opportunity of using biogas because of its fuel feasibility and high efficiency (6). However carbon deposition occurs in conventional nickel anode-based solid oxide fuel cells (5), which can be prevented by dry reforming (7), steam reforming (8-10), partial oxidation (2, 11-13), or anode off-gas recirculation (14-15).
Biogas benefits from the presence of carbon dioxide to some extent as carbon dioxide is a good reforming agent and can promote internal reforming thereby producing hydrogen and carbon monoxide for electrochemical energy generation (5, 16). Shiratori (17) investigated the stability of a NiO-ScSZ anode in supplying a simulated gas (CH4:CO2=60:40), and he found that the cell was stable for 200 hours at 200 mA cm-2
when operating at 900 °C. For dry reforming, there was the risk of carbon deposition
even though there was no visible carbon deposition in reported experiments (17). An efficient approach to avoid carbon deposition is by the operation of the cell under close-circuit conditions so as to provide sufficient oxygen from the cathode side to the anode side (18-19) .
The anode recirculation is also an effective strategy against carbon deposition and the overall fuel utilisation and efficiency is improved if the fuel is recycled (21-22). Powell et al. reported that the overall fuel utilization was 93%, which was much higher than the single-pass fuel utilization of 55% (23) . The cell exhaust gases provide the energy for the endothermic steam and dry reforming. Another advantage of using biogas in solid oxide fuel cells is that the heat generated from the electrochemical reaction is a good source for the reforming reaction.
In this paper, anode recirculation was applied to obtain a simulated biogas composition and the calculation was based on a typical composition of 63% CH4 and
37% CO2 (24). The simulated biogas consisting of 36%CH4, 36%CO2, 4%CO, 4%H2 and
20% H2O was used for fuel in nickel cermet-based solid oxide fuel cells. The cell was
tested at 850 °C using the above biogas at a flow rate of 30 ml/min.
Experimental
Simulated biogas
The original gas was composed of 63% CH4 and 37% CO2(24), assuming that 80% CH4
was oxidized into CO2 and H2O.
CH4+2O2→CO2+2H2O [1]
Unused CH4 (20%) decomposes into carbon and hydrogen, and consequently the
carbon reacted with the carbon dioxide to produce carbon monoxide.
CH4→C+H2 [2]
C+CO2→CO [3]
Electrochemically, carbon monoxide was oxidised into carbon dioxide and hydrogen was oxidized into H2O.
CO+O2→CO2 [4]
H2+O2→H2O [5]
It was supposed that the gases, after the electrochemical reaction, would reach an equilibrium state at 900 °C. These gases were calculated by the software HSC 5.1. The
off gas was recirculated and 25% was added into the original mixture of CH4 and CO2.
The newly obtained gas composition was subjected to 80% fuel utilization and 25% recirculation until the off gas reached a constant composition with the input gas level. The final gas composition was slightly changed and rounded into 36% CH4, 36%CO2,
4%H2, 4%CO and 20% H2O. The calculation of the simulated biogas composition was
described in detail elsewhere(25).
Cell fabrication and electrochemical test
The preparation of an anode-supported cell consisting of a NiO-YSZ anode, a YSZ electrolyte and a LSM-YSZ cathode were described in details in previous paper (26) . The active area of the electrodes was 1 cm2. Gold paste and platinum paste were used for the anode and the cathode contact, respectively.
on top. A thermocouple was placed 1 cm from the anode surface to monitor the overall temperature. The furnace was heated from room temperature to 850 °C at 5 °C/min ramp
rate. The cell was reduced in hydrogen, provided from a cylinder, until the open circuit voltage of the cell was constant value. The current-voltage curve of the cell supplied with 30 ml/min of hydrogen and 50 ml/min of air was collected on Solartron 1280B with a 20 mV scan rate. And then the cell ran at 100 mA cm-2 current load for 24 hours in hydrogen. The gas was switched to the simulated biogas with a total flow rate of 30 ml/min. At the same time, the cathode was supplied with 50 ml/min of ambient air. According to the current-voltage curve, the cell was operating at 100 mA cm-2, 300 mA cm-2 and 500 mA cm-2 load at each current level for 16 hours, respectively. The current-voltage curves were tested after the durability experiments.
The microstructure of the cell was recorded on a Scanning Electron Microscope Jeol JSM-5600.
Results and discussion
Figure 1 shows the curves of gas components as a function of temperature ranging from 100 °C to 900 °C at pressure=0.1 MPa using an original biogas of 63% CH4 and
37% CO2, or the simulated biogas. It can be seen in Figure 1 (a) that there is carbon
coking between 100 °C and 900 °C using a biogas with 63% CH4 and 37% CO2, but there
is no carbon deposition for the simulated biogas (Figure 1(b)) at the temperature range of 720 °C to 900 °C (ie, the operating temperatures of the solid oxide fuel cells). The trend
of the curves shows that concentrations of hydrogen and carbon monoxide increase remarkably up to 800 °C. This suggests that the reforming reaction, either steam
reforming or dry reforming or both, is the prevailing reaction, substantiated by the hydrogen concentration reaching a maximum of 750 °C. Above this temperature, the
increase in concentration of carbon monoxide and water is considered to be produced from the shift reaction by consuming hydrogen and carbon dioxide. The temperature range of 750 °C to 850 °C would appear to be optimal if the highest production of
hydrogen is expected.
Figure 1 Equilibrium gases composition as a function of reaction temperature with an original gascomposition of (a) 63% CH4 and 37% CO2, and (b) simulated biogas
composition of 36% CH4, 36%CO2, 4%CO, 4%H2 and 20% H2O
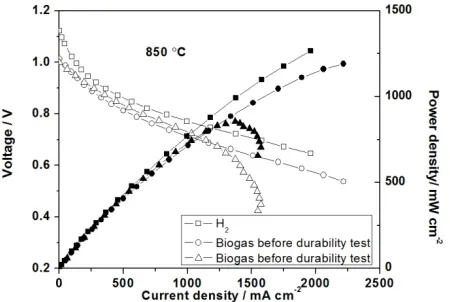
[image:3.612.117.506.487.610.2]The current-voltage and current-power curves are presented in Figure 2. The open circuit voltage of the cell in hydrogen is 1.12 V, whilst the value in biogas is 1.01 V at a temperature of 850 °C. Before the durability test, the cell performance using biogas fuel
is close to that using hydrogen fuel, which is 1191 mW cm-2. The deviation of the cell performance in hydrogen and biogas mostly comes from the difference of the open circuit voltage in these two fuels, which is shown clearly in current-voltage curves. After the durability test, the maximum power density dropped to 856 mW cm-2. The decrease in the cell performance in biogas after the durability test is probably due to the limitation on the high current density, which may be caused by the insufficient supply of the fuels either biogas at the anode or air at the cathode.
The main difference between the theoretical calculation (shown in Figure 1) and the experimental results (shown in Figure 2) is the conversion rate of methane. There is still some methane left in practical experiments, as not all the methane is consumed. Water steam and solid carbon gradually decrease with increasing temperature, and are substituted by the same products shown in Figure 1. The formed solid carbon is consumed at temperature above 720 °C according to the calculated equilibrium
composition.
[image:4.612.201.426.375.526.2]The cell voltage was stable over the whole tested period. A clear change in the cell behavior was found after switching to biogas. After a polarisation experiment was performed, a significant performance loss of the cell leading to fatal failure was observed. A starvation of hydrogen and carbon monoxide can lead to nickel-reoxidation in some regions of the anode, which can finally cause the catastrophic failure of the cell.
Figure 2 Current-voltage and Current-power density curves of the nickel anode-supported cell using hydrogen or simulate biogas fuel tested at 850 °C, the cell performance in
Figure 3 the durability test of the cell operating in hydrogen or biogas
Figure 3 presents the durability test of the cell running in hydrogen or biogas at different current loads. The first test was operated in pure hydrogen with a current load of 100 mA cm-2 for 24 hours. An improvement in performance over time was observed due to an activation process at a current load in hydrogen, the voltage was 1.02 V and increased gradually to 1.03 V after the 24 hours of activation. The gas was changed into simulated biogas and the cell behavior in biogas at 100 mA cm-2, 300 mA cm-2 and 500 mA cm-2 was recorded as well the total testing time for each level was 16 hours. The power densities were 95nmW cm-2 264nmW cm-2 and 411nmW cm-2 at each level, respectively. It was noticed that the power density at 500 mA cm-2 increased from 411 mW cm-2 to 425 mW cm-2 during the test. The fuel utilization at each level was 1.5%, 4.3% and 7.3%. These values are much lower than the expected value of 80% in the calculation and need to be improved. The present flow rate of biogas is controlled to 30 ml/min and can be lowered to get a better fuel utilization. Alternatively new cell structures or components could be developed to operate in biogas fuel.
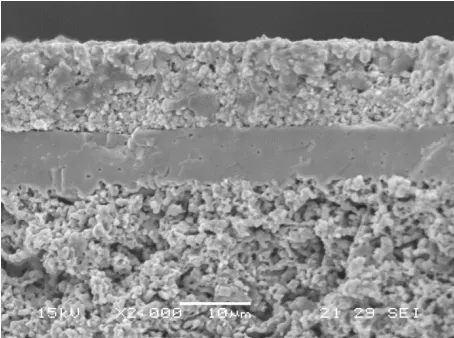
After electrochemical tests, the microstructure of the cell was tested by SEM and the image was shown in Figure 4. A porous anode with well distributed nickel and YSZ particles and a thin layer YSZ electrolyte were observed. It seemed that the porosity of LSM-YSZ cathode is not sufficient for the gas diffusion and this might be why high concentration resistance was observed after the durability test. In order to get better cell performance, the cathode structure can be further optimized.
[image:5.612.192.419.522.691.2]Conclusion
We have demonstrated that nickel-based solid oxide fuel cell can utilise simulated biogas having a composition of 36%CH4, 36% CO2, 4% H2, 4% CO and 20% H2O as a
fuel to produce electrical power without carbon deposition. Supplied with a 30 ml/min of the simulated biogas, the cell ran stably at loads of 100 mA cm-2, 300 mA cm-2and 500 mA cm-2 for 16 hours at each level. The practical fuel utilisation needs to be improved to get the proposed 80% fuel utilization.
Reference
1. K. M. Dunst et al., Solid State Ionics, 251, 70 (2013).
2. J. Van herle, F. Marechal, S. Leuenberger, D. Favrat, J. Power Sources, 118, 375 ( 2003).
3. I. Wheeldon, C. Caners, K. Karan, B. Peppley, Int. J. Green Energy, 4, 221 (2007).
4. A. Lanzini, P. Leone, Int. J. Hydrogen Energy, 35, 2463 (2010). 5. J. Staniforth, K. Kendall, J. Power Sources, 71, 275 (1998). 6. J. Staniforth, M. Ormerod, Green Chem., 3, G61 (2001). 7. J. Staniforth, R. M. Ormerod, Catal. Lett., 81, 19 (2002).
8. V. Chiodo, F. Urbani, A. Galvagno, N. Mondello, S. Freni, J. Power Sources, 206, 215 (2012).
9. D. M. Murphy, A. E. Richards, A. Colclasure, W. Rosensteel, N. P. Sullivan, Ecs
Trans., 35, 2653 (2011).
10. D. M. Murphy, A. E. Richards, A. Colclasure, W. A. Rosensteel, N. P. Sullivan, J.
Renew. Sustain. Energy, 4, (2012).
11. T. Ishihara, T. Yamada, T. Akbay, Y. Takita, Chem. Eng. Sci., 54, 1535 (1999). 12. T. Yamada, Y. Hiei, T. Akbay, T. Ishihara, Y. Takita, Solid State Ionics, 113, 253
(1998).
13. Y. Hiei, T. Ishihara, Y. Takita, Solid State Ionics, 86-8, 1267 (1996). 14. V. Eveloy, Imece2009, 6, 627 (2010).
15. C. S. Lau, D. Allen, A. Tsolakis, S. E. Golunski, M. L. Wyszynski, Biomass
Bioenerg., 40, 86 (2012).
16. S. T. Naumann, C. Myren, J. Power Sources, 56, 45 (1995). 17. Y. Shiratori, K. Sasaki, J. Power Sources, 180, 738 (2008). 18. D. J. Moon, J. W. Ryu, Catal. Today, 87, 255 (2003).
19. D. J. Moon, J. M. Park, J. S. Kang, K. S. Yoo, S. I. Hong, J. Ind. Eng. Chem., 12, 149 (2006).
20. A. L. Dicks, J. Power Sources, 71, 111 (1998). 21. V. Eveloy, M. Daoudi, Imece 2008, 387 (2009).
22. S. Farhad, Y. Yoo, F. Hamdullahpur, J. Power Sources, 195, 1446 (2010).
23. M. Powell, K. Meinhardt, V. Sprenkle, L. Chick, G. McVay, J. Power Sources,
205, 377 (2012).
24. S. Rasi, A. Veijanen, J. Rintala, Energy, 32, 1375 (2007).
25. S. Gamble, D. Neagu, J. T. S. Irvine, Ecs Trans., 57, 1527 (2013).