ARTICLE
OPEN
Experimental veri
fi
cation of the
ab initio
phase transition
sequence in SrZrO3
and comparisons with SrHfO3
and SrSnO
3
Ashok Kumar1,2, Shalini Kumari3, Hitesh Borkar1,2, Ram S Katiyar3and James Floyd Scott4
We present detailed Raman studies of SrZrO3(SZO) that show three anomalies in Raman modes: One has a small jump in frequency
ω, one has its intensity vanish, and a third has a sharp change in temperature derivative dω(T)/dTfromflat belowT= 600 K to a Curie–Weiss dependence above 600 K with extrapolation to zero frequency at the known transition temperatureT= 970 K, thereby proving the latter to be displacive. In addition, theP4mmferroelectric phase predicted at high stresses has preliminary support from polarization-voltage experiments. The inference of a new transition in the temperature region 600–650 K is in disagreement with neutron studies. Comparisons are given for family member SrSnO3and SrHfO3, and we discuss the different conclusions of
Kennedy and Knight. We show that a known transition in SrHfO3is also displacive with a well-behaved soft mode.
npj Computational Materials (2017) 3:2 ; doi:10.1038/s41524-016-0002-y
INTRODUCTION
Pervoskites such as SrZrO3(SZO), SrSnO3, SrHfO3, and SrTiO3are
important high-k dielectrics that possess a highly tilted B-site octrahedron in this ABO3-crystal structure. Due to the tilting of
BO6octahedra, these systems follow a series of phase transitions
from high-crystal to low-crystal symmetry with decrease in temperature. These systems display rich fundamental physics and immense potential as next-generation high-k dielectric for complementary metal–oxide–semiconductor technology due to their very high optical bandgap and dielectric constant. Among them SZO has been considered as a potential candidate for applications as an optical wave guide, hydrogen and oxygen gas sensor, and medium-range solid oxide fuel cell.1–9 SZO is well
known for its several structural phase transitions: orthorhombic (Pnma)→orthorhombic (Cmcm)→tetragonal (I4/mcm)→cubic (Pm3m) at 970, 1100, and 1440 K, respectively. However, its phase sequence is still a matter of debate and subject to controversy.10–14 According to group theory, the direct structural phase transition from orthorhombic (Pnma)→ orthorhombic (Cmcm) is unlikely, since it lacks subgroup relationship and is hence“reconstructive”. Carlsson proposed another sequence of phase transitions: orthorhombic (Pnma) → 970 K → pseudo-tetragonal (Imma, c/a < 1)→1100 K→tetragonal phase (I4/mcm, c/a > 1)→1440 K → cubic (Pm3m).10Recently the local density approximations infirst
principle calculations predictedantiferroicdistortion (AFD) instabil-ity in the cubic phase of SZO.2,15 Amisi et al.2 extended the theoretical modeling and proposed possible ferroelectricity with high polarization, comparable to BaTiO3, in strained cubic
structure or tetragonal P4mm due to suppressed AFDs, as observed in earlier work on the orthorhombic phases of CaMnO3
and CaTiO3.16,17Amisi et al.2calculated the energy differences for
possible crystal structures, such asPnma (a= 5.810, b= 8.161,
c= 5.764) (E =−259 meV f.u.−1) → Imma (a= 5.791, b= 8.134,
c= 5.791) (E =−236 meV f.u.−1) → Cmcm (a= 8.129, b= 8.233,
c= 8.187) (E =−223 meV f.u.−1) → I4/mcm (a= 5.736, b= 5.736,
c= 8.319) (E =−213 meV f.u.−1) → P4/mbm (a= 5.740, b= 5.740,
c= 8.332) (E =−172 meV f.u.−1) → Pm3m (a= 4.126, b= 4.126,
c= 4.126) (E = 0 meV/f.u.). These energy (in meV per formula unit (f.u.)) differences for various crystal structures suggest that some of the phase transitions are very unlikely, and some may overlap due to closeness of their energies; note that one cannot predict the phase transition temperatures based on these calculated energy differences.
The observation of a series of phase transitions in SZO is mainly due to change in the tilting angle of ZrO6octahedra with change
in ambient conditions (temperature and pressure). The tilt angle significantly decreases with increase in temperature, which causes several structural phase transitions or precursor effects. Glazer has developed a simple way to classify and understand the octahera tilting in ABO3-type perovskite structure based on the doubling of
pseudo-cubic subcell parameters.11 They proposed two type of possible octahedral tilts, (i) C-facing: a−a−c+, and (ii) all-face-centering: a−a−co; out of these two tilts, C-facing was favorite due to high probe frequency. Athee et al.11 precisely calculated the octahedral tilts of SrZrO3using neutron powder scattering data
with respect to pseudo-cubic subcell and found approximately 7.6° about c+tilt and 8.0° about a−tilts; however, with respect to
orthorhombic cell tilts were 7.6° co (orthorhombic unit cell) and
11.2° (in direction of Sr displacement). They were surprised to get the large octahedra tilting in SZO compared to CaZO3(4° and 6°,
respectively). In general it should be opposite, since the ionic radii of Ca cation is much smaller than Sr, which in turn produces large stress among various Sr–O bonding in O-octradedra. The tilts angles become negligible near the high temperature tetragonal-to-cubic phase transition, which is quite common near the structural phase transitions in perovskites.12
Received: 26 June 2016 Revised: 19 October 2016 Accepted: 2 November 2016 1
CSIR-National Physical Laboratory, Dr. K.S. Krishnan Marg, New Delhi 110012, India;2Academy of Scientific and Innovative Research (AcSIR), CSIR-National Physical Laboratory (CSIR-NPL) Campus, Dr. K.S. Krishnan Marg, New Delhi 110012, India;3
Department of Physics and Institute for Functional Nanomaterials, University of Puerto Rico, San Juan, PR 00931-3334, USA and4
Several techniques, such as thermogravimetric analysis, Raman spectroscopy, neutron scattering, X-ray diffraction (XRD), and Brillouin scattering as function of temperature have been utilized to understand the sequence of phase transitions; however, it is still not resolved. Temperature-dependent thermal expansion and heat capacity show a series of anomalies near the proposed phase transition temperatures; however, these inflexion points vary depending upon scanning speed and methodology.14,15,18 Fujimori et al.19explained the various high temperature (>800 K) phase transitions of SZO observed by Raman spectroscopy. To the best of our knowledge, work has rarely been carried out in the intermediate temperature range (500–750 K) and its possible electronic and structural phase transitions. Recently we have reported polaron-assisted giant dielectric dispersion in SZO, which may suggests a strong tilt in ZrO6octahedra in the intermediate
temperature range.20
It is known in several examples in the literature that strong phase transitions, evidenced from conductivity, thermal proper-ties, and spectroscopy, are present in some crystals where no change in lattice constant <a(T)> is observed via X-ray or neutron crystallography. This includes simple oxide ABO3 perovskites,
especially WO3(a perovskite with empty A-site), as shown by Salje
et al.21,22 Therefore in addition to reconciling two different density functional theory (DFT) calculations for SrZrO3, the present
work indicates a case in which crystallographic measurement ofa
(T) is probably not the definitive test.
Here we report a significant change in low-frequency Raman modes and decrease in frequency of various high-frequency Raman modes between 600–750 K that may relate the proposed large differences in energy for various crystal structures reported by Amisi et al.2due to change in the ZrO
6octahedra. Dielectric
spectroscopy has been employed to confirm the anomaly for various probe frequencies to verify the possible phase transitions. Measurements of leakage current and ferroelectric polarization have been carried out to understand the suppression of antiferroelectric distortions under high electric E-field.
RESULTS
Raman studies on SrZrO3
In these studies we measured two separate temperature regions of interest: first, we examine the regime from 300 to 750 K to understand in-phase tilt in orthorhombic crystal [100] (a+b−b−)
from ideal perovskite structure (a0a0a0). Second, we examined softening of low-frequency Raman modes in SZO up until 700 K, and from 700 to 970 K we find evidence of a soft-mode-driven displacive transition at 970 K. Fujimori has suggested that this is a
first-order phase transition, since they found a small discontinuity near Tc~970 K; their theory is based on an endothermic peak near
970 K, i.e., a nonzero value of the enthalpy of transition, and a significant width of the phase transition temperature.23 We also
present preliminary evidence for a possible ferroelectric phase under large applied voltage, predicted by Ghosez’s group.
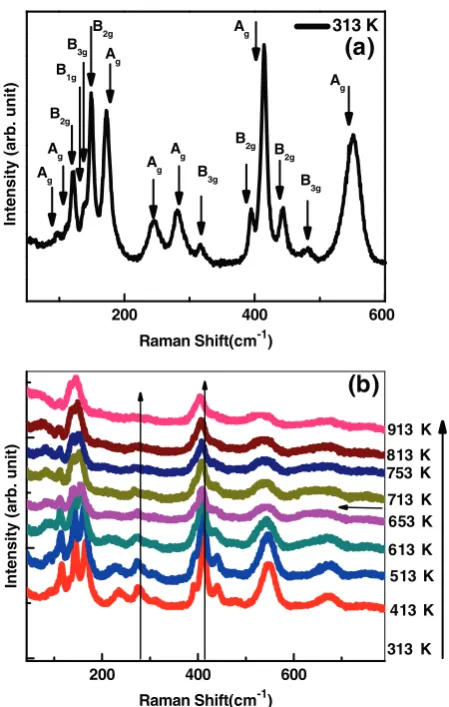
We emphasize the Raman modes of orthorhombic SZO in the temperature range of 300–900 K. Figure 1a shows the Raman modes near room temperature; these modes are assigned as per group theory for orthorhombic crystal structure with four molecules in a unit cell and space group Pnma. These modes matched very well with single crystal data reported by Kamishima et al.24 The Raman bands are given in the Fig. 1b at various temperatures as depicted and assigned in Fig.1a. Surprisingly, we found nearly complete merger of two Agmodes and one B1g(B3g)
modes between 240–315 cm−1below 800 K, above which a single temperature-independent 280 cm−1AgRaman mode persists until
the next higher structural phase transition temperature. Clearer and expanded views at various temperatures are given in the supplementary Fig.SP1. The merger of these modes can be easily seen in the Figs.2a–d, where three highly intense peaks merge in to a single Ag peak around 278 cm−1 (Fig. 2d). Above 600 K it
became impractical to distinguish among these peaks andfit with separate Raman modes. These data suggest that the local vibrational environment of various O–Zr–O bonds and its tilt angles significantly change above 600 K. The lowest Raman mode at 97 cm−1softens negligibly until 650 K, above which it follows the mean field theory ω02=ωTc2+A× (Tc−T) with a damping
constant 70 cm−1(+/−2 cm−1).
Dielectric and polarization studies on SrZrO3
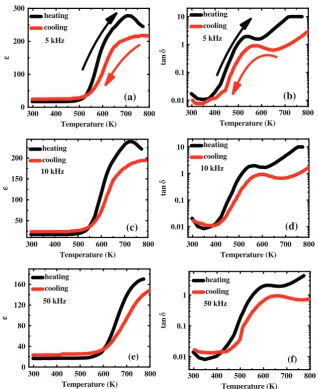
The temperature-dependent dielectric spectra and tangent loss of SZO from 300 to 800 K at various probe frequencies, 5, 10, and 50 KHz, are shown in Figs. 3a–f. The magnitude and nature of dielectric constant data suggest frequency-independent dielectric constant with magnitude nearly 22-450 K, above which it increases exponentially with large dielectric anomaly peaks in the range of 650–750 K, which increase in temperature with increase in probe frequency (thermally activated charge carriers). A signature of strong electron-phonon (small polaron) coupling above 650 K was observed.20,25 The dielectric dispersion and
anomaly data suggest that there may be faint pseudo structural phase transition due to the significant tilting of ZrO6 octahedra
and screening among the electrons and the polaronic charge species. Due to the weakness of the dielectric anomaly, we checked the dielectric constant and tangent loss behavior for both
(b)
200 400 600
913 K
813 K 753 K
713 K 653 K
613 K
513 K
413 K
Intensity (arb. unit)
313 K
200 400 600
B
2g
B
3g
B2g B
2g
B
3g
B
3g
B
2g
Ag A
g
A
g
A
g
A
g
A
g
Intensity (arb. unit)
Raman Shift(cm-1)
Raman Shift(cm-1)
313 K
A
g
B
1g
(a)
Fig. 1 aRoom temperature Raman modes and the modes
assign-ment are illustrated. bA close view of change in low-frequency
Raman spectra as function of temperature from 300 to 913 K.
Merger of A1gand B1g(B3g) modes to a single A1gmode above 650 K
[image:2.595.57.282.54.408.2]heating and cooling; we first heated the sample in similar condition (+/−5°/min) and left the sample for 30 min for temperature-microstructure stabilization and later measured the dielectric properties on cooling. We found almost identical behavior in dielectric loss data with significant dielectric hysteresis and broader and more diffuse dielectric behavior between 600 and 800 K. The dielectric data on heating and cooling provide strong evidence of electron-phonon coupling-mediated tilt in ZrO6 octahedra and screening among the electrons in the
intermediate temperature range. We performed the dielectric and tangent loss measurements on the same series of samples that were used a year ago.20
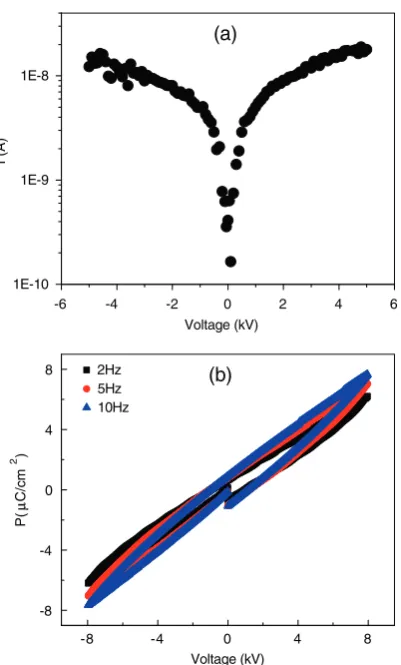
Ferroelectric hysteresis is observed under very high voltage, which may be due to suppression of AFD instability and development of ferroelectricity at the zone center. The room temperature current-voltage (I-V) and polarization-voltage data are shown in Figs.4a,b, respectively. A symmetric I-V curve was obtained for both positive and negative polarity; the magnitude of current was found in the range of ~nA under application of large voltage (~5000 V). However, such a modest loop can be due to charge injection and requires further study.
SrSnO3and SrHfO3results
Other family members of SrZrO3 share its controversies with
regard to structures. We mention them briefly to alert readers that this is therefore a generic problem. The phases of SrSnO3
are known in some measure from the studies of Singh et al.8,9
These studies used a wide variety of experimental techniques, including Raman, specific heat, thermal expansion, etc. Of particular interest are two transitions at moderate temperature, a broad order–disorder transition reported at 265–270 K and a probably displacive transition (no vibrational linewidth broad-ening) at 160 K. Very recently Kennedy and Knight reported26from powder neutron diffractions that these transitions are not present in their data. However, data in the Ph.D. thesis of Dr. Elizabeth Mountstevens (Cambridge University, 1998) measured
T= 260+/−5 K, in very good agreement with that of Singh et al.8,9 It is also important that Mountstevens’samples were powder from UK ingredients, whereas those of Singh were both ceramics and powders from Korea, from India, and from the USA. Therefore, the sample standing out as completely out-of-line from the others is the powder specimen from Kennedy and Knight. We note that the samples used by Kennedy and Knight were reported to be as
12 16 20 24
T (K) 144
152 160 168
T (K)
270 285 300 315
T (K) 126
132 138 144 150
T (K)
300 400 500 600 85
90 95
data fitting
T (K)
400 600 800 1000
78 84 90 96
ω
(cm
-1)
ω
(cm
-1)
ω
(cm
-1)
ω
(cm
-1)
ω
(cm
-1)
Γ
(cm
-1)
T (K)
(f)
(e)
(d)
(c)
(b)
(a)
400 600 800 1000
400 600 800 1000 400 600 800 1000
300 400 500 600
Fig. 2 Damped harmonic oscillator (DHO) modelfitting of low-frequency Raman modes.alowest soft mode at ~97 cm−1using all the active
Raman modes in DHOfitting, till 600 K, it shows negligible nonlinear decrease in frequency with increase in temperature, later follows the
linear behavior tillfirst phase transition temperature and above, b147 cm−1 Raman mode shows linear temperature-dependent nature,
c169 cm−1Raman mode displays linear behavior as function of temperature,dmerger of 315 and 285 cm−1modes near 600 K,eDHOfitting is
used on onlyfirstfive low-frequency Raman modes and their obtained data for low-frequency 96 cm−1soft mode with itsfitting with modified
Curie–Weiss law (solid line), andffull width at half maximum behavior of low-frequency 96 cm−1soft mode
[image:3.595.136.455.53.428.2]received “directly from Sigma-Aldrich”. In our experience, this material from that and other suppliers are not perfectly stoichiometric. We prepared our samples with a 1400 °C anneal, which is known to be required for stoichiometry. Thus, the mostly likely source of the experimental differences is that the Kennedy–Knight sample was sufficiently off-stoichiometry that some subtle transition has disappeared.
There are several possibilities for these different conclusions. First, our work is on pressed ceramics, and it is always possible that a small strain exists in such specimens, compared with powders, producing a phase transition. A second plausible hypothesis is that the neutron studies involve relatively long integration times and/or large areas, whereas the Raman data are sensitive on a 10−13s time scale and few-micron spot size. There is
a history of this kind of discrepancy in the case of beta-cristobalite,27 where the neutron studies of Swainson et al.28 disagree with the theory of Coh;29Raman and infrared data prove the lower-symmetry model of Coh, but Swainson’s data give a temporal time-averaged structure.
We regard the temperature(s) of these two lower-T phase transitions in SrSnO3as moot and encourage DFT calculations on
this material. Our view is that the sequence of transitions in both SrZrO3 and SrSnO3 follows Glazer’s Rule,30 which empirically
relates tilt transitions in perovskites and order–disorder dynamics
[in-plane tilts in perovskites must be displacive, not order–disorder]. The original assignments of Mountstevens and Redfern violate Glazer’s Rule that tilt transitions in perovskites must be displacive (since adjacent octahedra are completely linked, disorder is impossible),31whereas those of Singh et al.8,9 reconcile that problem. Supplementary FigureSP2in Supplemen-tary information diagrams the short-range ferroelectric ordering in SrSnO3; we regard this ordering as a phase transition.32
SrHfO3findings
For completeness, we refer readers to the very recent work by Singh et al.8 on strontium hafnate. They demonstrated an underdamped soft mode at temperatures below a high-T phase transition thereby shown unambiguously to be displacive. The equivalent phase transition in SrSnO3 is now also known to be
displacive, with 1.0–1.5 nm diameter ferroelectric nano-regions, although earlier 2005 work claimed it to be order–disorder.32
DISCUSSION
We find evidence for a new transition near T= 650 K that is probably related to the onset of polaron conduction. From 650–970 K, there is a soft mode extrapolating to zero frequency
0 40 80 120 160
ε
heating cooling
50 kHz
0.01 0.1 1
heating cooling 50 kHz 0.01
0.1 1
10 heating cooling 10 kHz 0.01
0.1 1 10
tan
δ
heating cooling
5 kHz
0 100 200 300
ε
Temperature (K) heating
cooling
5 kHz
50 100 150 200
ε
heating cooling 10 kHz
(f) (e)
(d)
(c)
(b)
(a)
300 400 500 600 700 800
Temperature (K)
300 400 500 600 700 800
Temperature (K)
300 400 500 600 700 800
Temperature (K)
300 400 500 600 700 800
Temperature (K)
300 400 500 600 700 800
Temperature (K)
300 400 500 600 700 800
tan
δ
tan
δ
Fig. 3 a–f show temperature-dependent dielectric constant (a, c,e) and tangent loss (b, d,f) for 5, 10, and 50 kHz probe frequency,
respectively. The dielectric data in cooling mode are taken on the same sample after 1 year and compared with our previous heating data. It matches well except more diffused peak in cooling mode; however, almost similar features are seen in tangent loss data
[image:4.595.144.463.55.445.2]slightly above the known transition toCmcmatT= 970 K, implying that the latter is displacive and nearly second order. We report merger of several Raman modes between 650 and 750 K, a large dielectric anomaly nearly in the same temperature region, and a preliminary signature of nonlinear polarization under large E-stress.
Further, DFT modeling of the SrZrO3, SrSnO3, SrHfO3sequence
is warranted. What this hafnate work shares with the zirconate and stannate studies is that Raman studies complement DFTab initio
studies by unambiguously discriminating between displacive and order–disorder transitions and clarifying how close to second-order each transition is. The overall conclusion of the present work is that DFT work on SrZrO3 and its newly predicted phase(s)
should be extended to SrSnO3and SrHfO3with special attention
to examining Glazer’s Rule in this sequence of transitions. The idea that different specimens of SrZrO3, SrHfO3, or SrSnO3
might exhibit different phases has arisen several times: some authors suggest that soft chemistry processing gives different structures than conventional solid state processing; others report, in contrast with Glerup et al.,33 that the Pmcm-Incntransition is
absent. Yali34predicts that theCmcmandP4mmphases reported by Cherrad et al.35are probably unstable or nonexistent [Cherrad
et al.35 give I4/mcm–Imma–Cmcm–P4/mbm–P4mm for SrHfO3].
There are such a large number of possible phases with very close energies that defect density might play a large role. However, it is our view that the best specimens will reveal the largest number of phase transitions, since defects and especially vacancies will generally spread the temperature widths of spatially averaged phases, such as the ferroelectric nano-phases.32
METHODS
The bulk ceramic pellets of SrZrO3 (SZO) were synthesized by high
temperature solid state reaction route using the initial ingredients SrCO3
and ZrO2from Sigma Aldrich (purity 99.9 %). An equimolar ratio of initial
precursors was thoroughly mixed and calcined at 800 °C for 10 h; later this calcined powder was pelletized into circular shapes with diameter 13 mm and thickness 1–1.5 mm under uniaxial pressure of 5–6 tons per square inch. These pellets were sintered in air at 1400 °C for 6 h to achieve 95–98 % of theoretical density. The crystal quality, phase purity, grain distribution, elemental compositions, and surface morphology were determined by XRD (Bruker AXS D8 Advance X-ray diffractometer) using the Cu-kα(kα= 1.54059 A°) monochromatic radiation, in 2θrange between 20° and 80°, and a scanning electron microscope (Zeiss EVO MA-10).20 Dielectric properties and leakage current were measured in capacitor structures using silver as electrodes. Temperature-dependent dielectric measurement was carried out over wide range of frequencies (100 Hz–1 MHz) and temperatures (300–800 K) using an LCR meter (HIOKI-3532–50) at an amplitude of 0.5 V. Micro-Raman spectra were recorded using a T64000 spectrometer (JobinYvon) equipped with a triple-grating mono-chromator with additive dispersion in the backscattering geometry, using 514.5 nm monochromatic radiation over a wide range of temperatures (low and high temperature cryostage from Linkam). The Raman signal was analyzed by employing normal back-scattering geometry with typical spectral resolution less than 1 cm−1.
ACKNOWLEDGEMENTS
AK acknowledges the CSIR-National Physical Laboratoryinternal net work project, INDIA. Hitesh Borkar would like to acknowledge the CSIR (SRF) to provide fellowship to carry out PhD program.
AUTHOR CONTRIBUTIONS
AK, SK and HB conducted temperature-dependent, Raman and dielectric experiment,
andfitted the experimental Raman data using DHO model. AK, JFS and RSK analyzed
the data, correlate with their earlier published work on SrSnO3and SrHfO3and designed the paper. All authors discussed the results and participated in writing the paper.
COMPETING INTERESTS
The authors declare that they have no competing interests.
REFERENCES
1. Moore, G. E. Cramming more components onto integrated circuits.Electronics Mag.8, 82–85 (1965).
2. Amisi, S., Bousquet, E., Katcho, K. & Ghosez, P. First-principles study of structural and vibrational properties of SrZrO3.Phys. Rev. B85, 064112 (2012).
3. Kingon, A. I., Maria, J.-P. & Streiffer, S. K. Alternative dielectrics to silicon dioxide for memory and logic devices.Nature406, 1032–1038 (2000).
4. Pavunny, S. P., Thomas, R., Kumar, A., Fachini, E. & Katiyar, R. S. Optical properties of amorphous high-k LaGdO3films and its band alignment with Si.J. Appl. Phys.
111, 044106 (2012).
5. Wilk, G. D., Wallace, R. M. & Anthony, J. M. High-κgate dielectrics: current status and materials properties considerations.J. Appl. Phys.89, 5243–5272 (2001). 6. Weston, L., Janotti, A., Cui, X. Y., Stampfl, C. & Van de Walle, C. G. Hybrid functional
calculations of point defects and hydrogen in SrZrO3.Phys. Rev. B89, 184109 (2014).
7. Yajima, T., Suzuki, H., Yogo, T. & Iwahara, H. Protonic conduction in SrZrO3-based oxides.Sol. Sta. Ionics51, 101–107 (1992).
8. Singh, M. K. et al.High-temperature phase transitions in SrSnO3: a Raman scattering study.Europhy. Lett.107, 26004 (2014).
9. Singh, M. K.et al.New cryogenic phase transitions in SrSnO3.J. Phys. Condens.
Matter22, 095901 (2010).
10. Carlsson, L. High-temperature phase transitions in SrZrO3.Acta Crystallogr23, 901–905 (1967).
11. Ahtee, A., Ahtee, M., Glazer, A. M. & Hewat, A. W. The structure of orthorhombic SrZrO3by neutron powder diffraction.Acta Crystallogr.B32, 3243–3246 (1976). 12. Ahtee, A., Glazer, A. M. & Hewat, A. W. High-temperature phases of SrZrO3.Acta
Crystallogr.B34, 752–758 (1978).
13. Kennedy, B. J., Howard, C. J. & Chakoumakos, B. C. High-temperature phase transitions in SrZrO3.Phys. Rev. B59, 4023–4027 (1999).
-8 -4 0 4 8
-8 -4 0 4
8 2Hz
5Hz 10Hz
P(
μ
C/c
m
2 )
Voltage (kV)
-6 -4 -2 0 2 4 6
1E-10 1E-9 1E-8
I (A)
Voltage (kV)
(b) (a)
Fig. 4 aLeakage current behavior as function of applied electric
field,bnonlinear slim polarization under large stress E-field
[image:5.595.62.263.53.386.2]14. Matsuda, T., Yamanaka, S., Kurosaki, K. & Kobayashi, S.-I. High temperature phase transitions of SrZrO3.J. Alloys Compd.351, 43–46 (2003).
15. Vali, R. Lattice dynamics of cubic SrZrO3.J. Phys. Chem. Solids69, 876–879 (2008). 16. Bhattacharjee, S., Bousquet, E. & Ghosez, P. First-principles study of the dielectric and dynamical properties of orthorhombic CaMnO3.J. Phys.: Condens. Matter20, 255229 (2008).
17. Eklund, C.-J., Fennie, C. J. & Rabe, K. M. Strain-induced ferroelectricity in orthor-hombic CaTiO3fromfirst principles.Phys. Rev. B79, 220101(R) (2009). 18. DeLigny, D. & Richet, P. High-temperature heat capacity and thermal expansion
of SrTiO3 and SrZrO3 perovskites. Phys. Rev. B 53, 3013–3022 (1996).
19. Fujimori, H., Kakihana, M., Ioku, K., Goto, S. & Yoshimura, M. Structural phase transitions between 700 and 850°C in SrZrO3studied by Raman spectroscopy.J.
Ceram. Soc. Jpn112, 189–192 (2004).
20. Borkar, H.et al.Polaron-electron assisted giant dielectric dispersion in SrZrO3 high-k dielectric.J. Appl. Phys.119, 214101 (2016).
21. Salje, E. & Viswanathan, K. Physical properties and phase transitions in WO3.Acta
Cryst.A31, 356–359 (1975).
22. Salje, E. K.-H.et al.Crystal structure and paramagnetic behavior of WO3-x.J. Phys.
Cond. Mat.9, 6563–6577 (1997).
23. Fujimori, H., Yashima, M., Kakihana, M. & Yoshimura, M. Phase transition and soft phonon modes in SrZrO3around 1200°C by ultraviolet laser Raman spectroscopy.
Phys. Rev. B61, 3971–3974 (2000).
24. Kamishima, O., Hattori, T., Ohta, K., Chiba, Y. & Ishigame, M. Raman scattering of single-crystal SrZrO3.J. Phys.: Condens. Matter11, 5355–5365 (1999).
25. Weston, L., Janotti, A., Cui, X. Y., Himmetoglu, B., Stampfl, C. & Van de Walle, C. G. Structural and electronic properties of SrZrO3and Sr(Ti,Zr)O3alloys.Phy. Rev. B
92, 085201 (2015).
26. Kennedy, J., Qasim, I. & Knight, K. S. Low temperature structural studies of SrSnO3.
J. Phys. Cond. Mat.27, 365401 (2015).
27. Zhang, M. & Scott, J. F. Raman studies of oxide minerals: a retrospective on cristobalite phases.J. Phys. Cond. Mat.19, 275201 (2007).
28. Swainson, I. P. & Dove, M. T. Low-frequencyfloppy modes inβ-cristobalite.Phys. Rev. Lett.71, 193–196 (1993).
29. Coh, S. & Vanderbilt, D. Structural stability and lattice dynamics of SiO2 cristobalite.Phys. Rev. B78, 054117 (2008).
30. Geday, M. A. & Glazer, A. M. Birefringence of SrTiO3at the ferroelastic phase transition.J. Phys.: Condens. Matter16, 3303–3310 (2004).
31. Mountstevens, E. H., Redfern, S. A. T. & Attfield, J. P. Order-disorder octahedral tilting transitions in SrSnO3perovskite.Phys. Rev. B71, 220102R (2005). 32. Goodwin, A. L., Redfern, S., Dove, M. T., Keen, D. A. & Tucker, M. G. Ferroelectric
nano-scale domains and the 905 K transition in SrSnO3.Phys. Rev. B76, 174114 (2007).
33. Glerup, M., Knight, K. S. & Poulsen, F. W. High temperature structural phase transitions in SrSnO3perovskite.Mat. Res. Bul.40, 507–520 (2005).
34. Vali, R. Structural phases of SrHfO3.Solid State Commun.148, 29–31 (2008). 35. Cherrad, D. & Maouche, D. Structural, electronic, and optical properties of SrHfO3.
Physica B405, 3862–3868 (2010).
This work is licensed under a Creative Commons Attribution 4.0 International License. The images or other third party material in this article are included in the article’s Creative Commons license, unless indicated otherwise in the credit line; if the material is not included under the Creative Commons license, users will need to obtain permission from the license holder to reproduce the material. To view a copy of this license, visithttp://creativecommons.org/licenses/by/ 4.0/
© The Author(s) 2017
Supplementary Information accompanies the paper on thenpj Computational Materialswebsite (doi:10.1038/s41524-016-0002-y)