Photoionization and heating of a supernova-driven turbulent
interstellar medium
J. E. Barnes,
1‹Kenneth Wood,
1Alex S. Hill
2and L. M. Haffner
3,41School of Physics & Astronomy, University of St Andrews, North Haugh, St Andrews, Fife KY16 9SS, Scotland 2CSIRO Astronomy & Space Science, Marsfield, NSW 1710, Australia
3Department of Astronomy, University of Wisconsin Madison, 475 North Charter Street, Madison, WI 53706, USA 4Space Science Institute, 4750 Walnut Street, Suite 205, Boulder, CO 80301, USA
Accepted 2014 March 13. Received 2014 March 13; in original form 2013 December 5
A B S T R A C T
The diffuse ionized gas (DIG) in galaxies traces photoionization feedback from massive stars. Through three-dimensional photoionization simulations, we study the propagation of ionizing photons, photoionization heating and the resulting distribution of ionized and neutral gas within snapshots of magnetohydrodynamic simulations of a supernova-driven turbulent interstellar medium. We also investigate the impact of non-photoionization heating on observed optical emission line ratios. Inclusion of a heating term which scales less steeply with electron density than photoionization is required to produce diagnostic emission line ratios similar to those observed with the Wisconsin HαMapper. Once such heating terms have been included, we are also able to produce temperatures similar to those inferred from observations of the DIG, with temperatures increasing to above 15 000 K at heights|z|1 kpc. We find that ionizing photons travel through low-density regions close to the mid-plane of the simulations, while travelling through diffuse low-density regions at large heights. The majority of photons travel small distances (100 pc); however some travel kiloparsecs and ionize the DIG.
Key words: ISM: General – galaxies: ISM.
1 I N T R O D U C T I O N
The interstellar medium (ISM) is a vital component of the cycle of star formation and the evolution of galaxies. The composition and dynamics of the ISM determine the formation of new stars in the Galaxy, while stars provide feedback through ionization, out-flows and supernovae (Mac Low & Klessen2004). In this paper, we study the formation of widespread ionized gas as observed pri-marily through Hαin the Milky Way and other galaxies. This gas (reviewed by Haffner et al.2009), commonly referred to as the dif-fuse ionized gas (DIG) or warm ionized medium, is low density (0.1 cm−3), warm (∼8000 K), consists of regions of nearly fully
ionized hydrogen (Hausen et al.2002) and has a scaleheight of 1– 1.5 kpc near the Sun (Haffner, Reynolds & Tufte1999; Gaensler et al.2008; Savage & Wakker2009).
The most likely sources of the ionization of the DIG in the Galaxy are O stars (Reynolds1990). Photoionization simulations of a smooth ISM are able to reproduce some of the observed prop-erties of the DIG (e.g. Wood & Mathis2004; Miller & Cox1993). However, to allow ionizing photons from mid-plane OB stars to propagate to large distances, these models require the vertical
E-mail:[email protected]
umn density of hydrogen to be lower than that inferred from HI 21 cm observations of the Galaxy. Photoionization simulations of a clumpy or fractal density structure show that the introduction of lower density paths in a three-dimensional (3D) ISM allows pho-tons to travel to large heights above the mid-plane (see for example fig. 16 of Haffner et al. 2009). The most likely source of such clumping is turbulence (e.g. Armstrong, Rickett & Spangler1995; Hill et al. 2008; Chepurnov & Lazarian2010; Burkhart, Lazar-ian & Gaensler2012) which could be driven by supernovae (e.g. Armstrong et al.1995; de Avillez2000; Mac Low & Klessen2004). Wood et al. (2010) demonstrated that in a 3D supernova-driven tur-bulent medium, ionizing photons are indeed able to propagate to large distances and produce the DIG. However, the width of the distribution of emission measure in these simulations is wider than observed in the Galaxy. The discrepancy appears to be due to too wide a variation of density with height, requiring a mechanism to smooth out the density variations in the dynamical simulations. One possible smoothing mechanism is pressure from magnetic fields. In this paper, we extend the work of Wood et al. (2010) to study pho-toionization of a supernova-driven turbulent magnetized ISM, using the 3D density structures from the magnetohydrodynamic (MHD) simulations of Hill et al. (2012a).
Our simulations naturally produce a vertically extended ion-ized component and a compact neutral layer of gas, in qualitative
at University of St Andrews on September 8, 2014
http://mnras.oxfordjournals.org/
agreement with observations. However, the Hαintensity from the ionized layer has a smaller scaleheight than observed in the Galaxy. To better reproduce Hαobservations in the Galaxy, we have created models of a 3D fractal ISM which provide estimates for the den-sity structure and column densities for future MHD simulations. We also investigate the distance travelled by ionizing photons in the ISM and find that the majority of photons travel only short dis-tances and only a small fraction need to travel kiloparsec disdis-tances to ionize the DIG.
The outline of the paper is as follows: a description of observa-tions of the DIG is given in Section 2. The MHD and Monte Carlo photoionization codes are briefly described in Section 3, the results of our simulations are presented in Section 4 and are compared with observations of the DIG in the Galaxy. In Section 5, we describe the results of photoionization models of a 3D fractal ISM. In Sec-tion 6, we investigate how far photons are able to travel through the ISM to create the DIG. Finally, our conclusions are presented in Section 7.
2 W I S C O N S I N Hα M A P P E R
Although the DIG was first detected at radio frequencies (Hoyle & Ellis1963), much of our knowledge of its properties come from observations of optical emission lines (see review by Haffner et al. 2009). In our present study, we utilize data from the Wisconsin Hα Mapper (WHAM) survey which has mapped the entire northern sky in Hα(Haffner et al.2003) and large sections in other optical emis-sion lines including Hβ, [NII]λ6584 Å and [SII]λ6716 Å (Haffner
et al.1999; Madsen & Reynolds2005; Madsen, Reynolds & Haffner 2006), and targeted observations of [O I]λ6300 Å (Reynolds et al. 1998; Hausen et al.2002) and [OIII]λ5007 Å (Madsen & Reynolds
2005). These observations provide information on the distribution, kinematics, and physical conditions in the DIG (Haffner et al.1999; Haffner et al.2003). Some of the main results from WHAM are that the temperature of the gas appears to increase with height from the mid-plane, inferred from the increase of [NII]/Hαand [SII]/Hα
with height. Similar trends in line ratio and temperature have also been observed in other galaxies (e.g. Rand1998; Otte, Gallagher & Reynolds2002).
We take advantage of the kinematic information provided by WHAM to compare our photoionization simulations with observa-tions of regions of the Galaxy with different star formation rates, namely gas associated with the Perseus Arm and an interarm re-gion. The gas associated with the Perseus Arm is taken to be in the velocity range−75 km s−1<V
lsr<−45 km s−1and Galactic
coordinate range l= 125◦to 156◦and b= −6◦to−35◦. There is some uncertainty as to the velocity of Hαassociated with the Perseus Arm with other authors taking the arm to be in the range −50 km s−1<V
lsr<−30 km s−1(Haffner et al.1999). We use an
interarm region in the solar neighbourhood which lies in the veloc-ity range−15 km s−1<V
lsr<15 km s−1and Galactic coordinate
rangel=120◦to 160◦andb= −30◦to 30◦(Madsen et al.2006). These regions were observed as part of the WHAM Northern Sky Survey and are seen clearly in Hαemission (Madsen et al.2006). In addition to Hα, maps of these regions in the [NII]λ6584 Å and [SII]
λ6716 Å lines provide information on the temperature and ioniza-tion state of the gas up to 2 kpc above the mid-plane of the Galaxy (Haffner et al. 1999; Madsen et al. 2006; Madsen & Reynolds 2005).
3 M O D E L S
In this section, we briefly describe the MHD and Monte Carlo pho-toionization codes used in our theoretical study of diffuse ionized gas in the Galaxy.
3.1 Magnetohydrodynamic simulations
We investigate the structure of DIG photoionized by OB stars using a 3D density structure from supernova-driven MHD simulations of the ISM (Hill et al.2012b). These simulations use FLASH v2.5 (Fryxell et al.2000) and are based on those of Joung & Mac Low (2006) and Joung, Mac Low & Bryan (2009). A brief description of the simulations follows.
The density grid we use is from the magnetized ‘bx50hr’ simu-lation described by Hill et al. (2012a) which employs an adaptive mesh grid with maximum resolution of 2 pc near the mid-plane and lower resolution at|z| 50–300 pc. The ‘bx50hr’ model has an initial uniform horizontal magnetic field of 6.5µG in the mid-plane which approaches an rms value of 5–6µG (see review by Kulsrud & Zweibel2008). The full simulation grid is 1×1×40 kpc, with the mid-plane situated at the centre of the box.
The MHD simulations use a modified version of the Kuijken & Gilmore (1989) gravitational potential which includes a stellar disc, spherical dark matter halo, and a Navarro, Frenk & White (1996) profile above|z| =8 kpc. Supernova explosions drive turbulence and structure the ISM, while heating and cooling establish a mul-tiphase, vertically stratified ISM. The supernovae are set off at ap-proximately the Galactic supernova rate used by Joung et al. (2009): Type Ia= 6.58 Myr−1kpc−2, core collapse= 27.4 Myr−1kpc−2.
Three fifths of the core-collapse supernovae are clustered spatially and temporally to simulate super bubbles, though supernova posi-tions and times are determined without knowledge of the gas distri-bution. For our photoionization simulation, we consider a snapshot att=316 Myr.
These simulations include a diffuse heating term representing photoelectric heating by dust grains (Wolfire et al. 1995). They also contain heating terms from supernova explosions and stellar winds. photoionization is not considered and therefore heating by this mechanism is not included. Radiative cooling is incorporated as appropriate for an optically thin, solar metallicity plasma in collisional ionization equilibrium.
Since these simulations do not include photoionization, they are unable to distinguish between the warm ionized and neutral medium. The thermal pressure for a given density and temperature in the DIG is≈2 times that in the warm neutral medium due to the extra electron associated with each H atom. However, the impact of this on the dynamics should be small because in 104K gas the
thermal pressure is significantly smaller than the turbulent pressure. Additionally, simulations of high-mass stars have shown that ion-izing radiation is able to produce molecular outflows. However, the properties of the outflows suggest that ionizing radiation is not the main driver (Peters et al.2012).
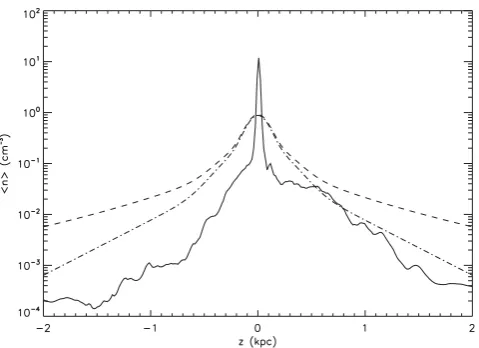
Fig.1shows horizontally averaged density from the MHD simu-lation as a function of height (z). We also show a Dickey–Lockman distribution for neutral hydrogen in the Galaxy (Dickey & Lockman 1990) and a Dickey–Lockman plus vertically extended component, as required to match the observed Hα in the Galaxy (Reynolds, Haffner & Tufte1999). Although the average vertical column den-sity for the MHD models (3.1×1020cm−2) is similar to that of the
Dickey–Lockman distribution (2.9×1020cm−2), the MHD density
at University of St Andrews on September 8, 2014
http://mnras.oxfordjournals.org/
Figure 1. Mean density (solid line) from MHD simulations, Dickey– Lockman density (dot–dashed line) and Dickey–Lockman plus vertically extended gas component (dashed line). The MHD simulation has densities ≈100 times lower at|z| =2 kpc and is much more sharply peaked than the average density structure required to produce the observed scaleheight of Hαin the Galaxy.
is more centrally peaked and is considerably lower at large|z|. As we will discuss in Section 4, the MHD density structure affects the scaleheight of Hα emission, temperature, and the line ratios [NII]/Hαand [SII]/Hαfrom the photoionization models.
3.2 Photoionization models
In order to determine how ionizing photons propagate and ion-ize the DIG, we use the 3D Monte Carlo photoionization code of Wood, Mathis & Ercolano (2004). This model follows ionizing photons through a 3D Cartesian grid and computes the tempera-ture and ionization state of H, He, C, S, N, O, and Ne in each cell. Ionization from both direct stellar and diffuse photons from recombinations of H+and He+are included. Previous studies (e.g. Wood et al.2010) indicate that the impact of dust on photoion-ization in the low-density DIG is minimal and has therefore been neglected. We adopt the following abundances appropriate for the diffuse ISM: He/H=0.1, C/H=1.4×10−4, N/H=6.5×10−5,
O/H=4.3×10−4, Ne/H=1.17×10−4, and S/H=1.4×10−5.
The O/H and N/H abundances are averages from Jenkins (2009) and Simpson et al. (2004), S/H is taken from Daflon et al. (2009), He/H and Ne/H are from Mathis (2000).
For the photoionization simulations, we use a section of the MHD grid that extends±2 kpc from the mid-plane. Memory restrictions of our photoionization code on a desktop computer require us to rebin the density grid and reduce the resolution to 15.6 pc per grid cell. We have explored higher spatial resolution ionization simula-tions for small secsimula-tions of the grid as well as binning according to density-squared (because of the recombination rate dependence). The resulting local ionization and temperature structures are un-changed at the 5 per cent level compared to the lower resolution runs. This resolution does not allow us to study the small scale ionization of individual HII regions within the larger ISM grid.
Therefore, the sources of ionizing radiation in our simulation rep-resent radiation escaping from HIIregions into the large-scale ISM
and can be thought of as ‘leaky HIIregions’ (e.g. Zurita, Rozas
& Beckman2000; Zurita et al.2002). The sources are randomly
distributed in thexyplane, and theirzlocation is randomly sampled from a Gaussian distribution with a scaleheight of 63 pc, the ob-served scaleheight of O stars in the Galaxy (Ma´ız-Apell´aniz2001). Heating is from photoionization of the gas while cooling comes from recombination, free–free radiation, and collisionally excited line radiation from C, N, O, Ne, and S. We ignore the temperature structure from the MHD simulations, taking the density grid and calculating the temperature of the gas based only on heating by pho-toionization plus an additional heating term (as required to explain emission line ratios in the gas).
We randomly place 24 sources in our simulations, following the study by Garmany, Conti & Chiosi (1982) who estimated the surface density of O stars in the solar neighbourhood to be 24 stars kpc−2. The sources are distributed uniformly inxandy, with
z chosen to reproduce the scaleheight of O stars in the Galaxy (Ma´ız-Apell´aniz2001). The stars within 2.5 kpc of the Sun have a total estimated Lyman continuum luminosityQ=7×1051s−1
(Garmany et al.1982), while the total ionizing luminosity of the stars in the Galaxy is estimated to be 2.6×1053 s−1 (Williams
& McKee 1997). Some ionizing photons will produce the DIG, some will escape the Galaxy altogether, and the remainder will be trapped and produce local HIIregions around each source. As
mentioned earlier, the small-scale HIIregions are not studied in this
paper. We equally distribute the ionizing luminosity among the 24 sources and investigate total luminosities escaping from HIIregions
0.5<Q49<10, whereQ49≡Q/(1049s−1). As expected, the ionizing
luminosity required to produce the DIG in our simulations is smaller than the total budget estimated by Vacca, Garmany & Shull (1996) ofQ49≈35 for all stars in 1 kpc2of the disc. Like the dynamical
simulations which produce the density grid, the radiation transfer simulation has repeating boundary conditions where photons that leave the simulation box from thexoryfaces re-enter the box on the opposite side. The ionizing spectrum is taken from the library of radiation-driven wind atmosphere models for hot stars computed by Pauldrach, Hoffmann & Lennon (2001) and Sternberg, Hoffmann & Pauldrach (2003). The spectrum used for these simulations is from a model atmosphere with solar abundance, logg=3.4 and
T=35 000 K.
For an input density structure from the MHD simulations, we calculate the ionization and temperature structure arising from pure photoionization. We do not include photoelectric heating or shock heating, the two heating effects included in the MHD simulations. Therefore, the very high temperatures (∼106K) in some regions of
the MHD simulations are not accounted for in the photoionization models. Such regions represent the hot ionized medium component of the ISM (McKee & Ostriker1977; Cox2005) and have a volume filling factor of around 60 per cent in the sub-grid from the MHD simulation (i.e.|z|<2 kpc), in good agreement with other obser-vational and theoretical studies of the ISM (e.g. McKee & Ostriker 1977; Harfst, Theis & Hensler2006). Since Hαemissivity is pro-portional toT−0.9(Osterbrock & Ferland2006) and the gas is at very
low density, the very hot regions will produce very low Hαintensity and can be ignored when computing the total intensity maps from the photoionization models. We have produced Hαmaps with and without emission from the hot cells from the MHD simulation; they are almost identical for the reasons we have outlined. However, the low Hαintensity and high temperature of these cells makes analysis of our results more difficult. Therefore, in the following analysis the intensity and line ratio maps from the photoionization models do not include emission from the regions in the MHD simulations that haveT>30 000 K.
at University of St Andrews on September 8, 2014
http://mnras.oxfordjournals.org/
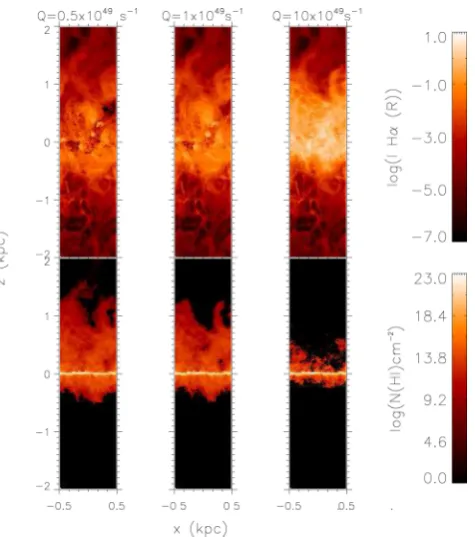
Figure 2. Edge on view of Hαintensity (top row) and column density of neutral hydrogen (bottom row) shown for increasing ionizing luminosity,
Q49=0.5 (left), 1 (centre), 10 (right).
4 R E S U LT S
Fig.2shows maps of Hαintensity and column density of neutral hydrogen for different ionizing luminosities in our simulations. As in Wood et al. (2010), the photoionization simulations naturally produce ionized gas at all heights and a less vertically extended distribution of neutral hydrogen. As the ionizing luminosity is in-creased, the vertical extent of the neutral hydrogen decreases. These general properties are in qualitative agreement with observations in the Milky Way and many other galaxies.
Reynolds (1990) estimated that approximately 12 per cent of the ionizing photons from OB stars are required to support the ioniza-tion of the DIG. We find that a luminosity of 1Q10×1049s−1
is able to ionize hydrogen to heights of±2 kpc and produce a com-pact distribution of neutral gas. This implies that for our simulations, around 3–28 per cent of the estimated Lyman continuum budget of
Q49≈35 for 1 kpc2(Vacca et al.1996) is required to escape from
HIIregions to ionize the DIG. Similarly to Wood et al. (2010), we
find that the most important parameter is the ionizing luminosity and that the position of the sources has little effect on ionization of the gas at large|z|. A fraction of the photons in our simulations, typically less than a few per cent, escape the simulation grid alto-gether (i.e. beyondz= ±2 kpc) and represent the escape fraction of ionizing photons into the intergalactic medium. Recent galaxy-wide simulations estimate the escape fraction of ionizing photons from dwarf galaxies into the IGM to be in the range 0.08 and 5.9 per cent (Kim et al.2013), while Barger, Haffner & Bland-Hawthorn (2013) find that up to 4 per cent of ionizing photons escape from the SMC while up to 5.5 per cent escape from the LMC, encompassing the values from our study.
[image:4.595.48.286.54.323.2]Fig.3shows that the scaleheight of Hαintensity from the MHD model is smaller than observed in the Milky Way. For simulations withQ49 =10, the Hαscaleheight is 150 pc while forQ49 =1
Figure 3. Fit to the horizontally averaged Hαintensity versus height ob-served in the Perseus Arm (red), compared with photoionization models from Fig.2. Top line:Q49=10 and a fit to the region of the model cor-responding to observations of the Perseus Arm (dashed line); bottom line
Q49=1 and fit (dashed line). The scaleheight of Hαintensity for the Perseus Arm is 500 pc. The simulations have scaleheights of 150 pc (Q49=10) and 250 pc (Q49=1). The Hαintensity close to the mid-plane is small for
Q49=1 because this low ionizing luminosity produces a smaller fraction of ionized gas close to the dense mid-plane regions compared to models with higher ionizing luminosity.
Figure 4. Emission line ratios showing [NII]/Hαversus Hαintensity for MHD simulations withQ49=1 (red points) compared with WHAM data from the Perseus Arm (black points). The vertical line represents the WHAM sensitivity limit. Upper and lower panels show simulations without and with additional heating, respectively.
it is 250 pc. These Hαscaleheights are smaller than the typical 500 pc observed in the Milky Way because of the lower scaleheight of the input density grid. Compared to low-Qmodels, in the high-Q
models there is more ionized gas and hence a larger Hαintensity at small|z|and a smaller Hαscaleheight (see Figs2and4).
4.1 Emission line ratios in the DIG
Observations of [SII]/Hαand [NII]/Hαin the DIG show that these
line ratios increase with decreasing Hα intensity (Haffner et al. 1999) while [SII]/[NII] remains almost constant. It has been
sug-gested that variations in temperature could explain the observed line ratios (e.g. Bland-Hawthorn, Freeman & Quinn1997), with a higher temperature increasing [SII]/Hαand [NII]/Hαwhile keeping
at University of St Andrews on September 8, 2014
http://mnras.oxfordjournals.org/
[image:4.595.306.544.341.511.2][SII]/[NII] constant as result of the similar excitation potentials of S
and N (Reynolds et al.1999). The observed increase of [SII]/Hαand
[NII]/Hαwith altitude (Haffner et al.2009) suggests a temperature
in the DIG that increases with|z|and requires additional physical processes that heat the gas in addition to photoionization. To provide additional heating in the low-density gas at high|z|, these sources of heating should have a shallower dependence on density than the
n2
e dependence of photoionization heating. Possible mechanisms
include heating from the dissipation of turbulence (proportional to
ne, Minter & Spangler1997) and cosmic ray heating (proportional
ton−1/2
e ; Wiener, Zweibel & Oh2013).
Following the nomenclature in previous papers (Reynolds et al. 1999; Wood & Mathis2004; Wiener et al.2013), the heating/cooling equation can be written as
G0n2e+G1ne+G3n−e1/2= n 2
e, (1)
where the heating from photoionization (G0) and the cooling
func-tion () are computed explicitly in our code. For these simulations, we introduce one additional heating termG1neerg cm−3s−1, which
will dominate over photoionization heating at low values ofne. In
the analytic fractal density structures considered in Section 5, we also consider additional heating from cosmic rays with the term
G3n−e1/2erg cm−3s−1.
Figs4and 5show diagnostic line ratio plots of [SII]/Hα and
[NII]/Hαversus Hαfrom our simulations without (top panels) and
with (bottom panels) additional heatingG1ne. In Fig.4, we
com-pare the models to observations of the Perseus Arm, restricting the models to heights|z|<1.8 kpc. Fig.5compares our models to observations of the lower star formation rate interarm region. With-out additional heating, the [SII]/Hαand [NII]/Hαline ratios show
little variation with Hαintensity and certainly no indication of the observed increase of the line ratios towards low Hαintensities. In-cluding an additional heating term withG1=1.5×10⁻²⁷erg s−1
does raise the [NII]/Hα, but only at extremely small Hαintensities.
It is important to note that the MHD simulations were performed for the average galactic supernova rate from Joung et al. (2009) with Type Ia and core collapse rates of 6.58 and 27.4 Myr−1kpc−2. The
[image:5.595.46.285.505.674.2]supernova rate is likely to be higher in the Perseus Arm where stars are forming. It is therefore appropriate to compare the simulated line ratios with an interarm region where the star formation and
Figure 5. Emission line ratios showing [NII]/Hαand [SII]/Hαversus Hα intensity for MHD simulations withQ49=1 (red points) compared with WHAM data from the inter arm region (black points). The vertical line repre-sents the WHAM sensitivity limit. Upper and lower panels show simulations without and with additional heating, respectively.
supernova rate will be closer to the average rates for the Galaxy. Observations of [NII]/Hαand [SII]/Hαline ratios in the interarm
region have a smaller increase with decreasing Hαintensity. How-ever, due to the low Hα intensity at large|z|in our simulations where the density is very small, we are still unable to match these ratios. There is a significant difference between the line ratios from regions below and above the mid-plane in the simulations and is at-tributed to the asymmetric density structure in the MHD simulation (see Fig.1). It is notable that we have assumed a path length through our simulations of 1 kpc; however, this is an arbitrary choice. If we adopt a path length of 2 kpc, then the Hαintensity would be twice as large, and therefore closer to that observed in the Perseus Arm, while leaving the line ratios unchanged.
We have been unable to produce any increase in [SII]/Hα
to-wards low Hαintensities even with an additional heating term. The difficulty in reproducing observations of S lines is not unexpected and is most likely because the dielectronic recombination rates for S are unknown. Most photoionization codes either ignore dielectronic recombination for S or, as employed here, use averages of the rates for C, N, and O neglecting any temperature dependence (Ali et al. 1991).
4.2 Temperature
With the assumption thatNis primarily in the singly-ionized state throughout the DIG, observations of the line ratios in the Perseus Arm have been analysed to determine the temperature structure in the gas indicating that it rises from around 7000 K at|z| =0.75 kpc to over 10 000 K above|z| =1.75 kpc (Haffner et al.1999; Madsen et al.2006). In Fig.6, we present the average temperature of ionized material in our simulations with and without the additional heating term,G1. To produce Fig.6, we have applied a cut where cells with
temperature over 30 000 K in the MHD simulations (typically corre-sponding to density below≈5×10⁻⁴cm−3) have been neglected.
These cells represent parts of ‘bubbles’ in the MHD simulations which in reality will be shock-heated and collisionally ionized, pro-cesses that we do not consider in our current pure photoionization models.
Fig.6shows that without the addition of a non-photoionization heating term, we are unable to reproduce the inferred increase
Figure 6. Average vertical temperature structure of photoionized gas in simulations with (top panel) no additional heating and (bottom panel) ad-ditional heatingG1ne=1.5×10⁻²⁷erg s−1nefor ionizing luminosities.
Q49=10 (red), 1(blue), 0.5 (black).
at University of St Andrews on September 8, 2014
http://mnras.oxfordjournals.org/
[image:5.595.309.549.508.684.2]in temperature with height. However, once additional heating (G1ne = 1.5 ×10⁻²⁷ne erg cm−3 s−1) has been added, we do
reproduce this increase. We find that this increase is larger than in-ferred by Haffner et al. (1999), with the gas temperature increasing to above 17 000 K at 1.75 kpc because of the very small densities for|z|300 pc in the MHD simulation. A smaller value forG1
gives lower temperatures but does not give a noticeable increase of [NII]/Hα at lowne. There is a significant difference between
the line ratios from regions below and above the mid-plane in the simulations and is attributed to the asymmetric density structure in the MHD simulation (see Fig.1).
5 F R AC TA L M O D E L O F T H E I S M
In the previous section, we have shown that photoionization models of a turbulent ISM can reproduce general trends in Hαemission observed in the Galactic DIG, and that to increase emission line ratios an additional heating component is required. However, due to the small scaleheight in the MHD simulations, the scaleheight of Hαis smaller than observed in the Perseus Arm of the Galaxy. As a guide for future MHD simulations of the Galactic ISM, in this section we explore the photoionization of analytic density structures that can better reproduce the observed average vertical distribution of Hαintensity and emission line ratios observed by WHAM.
We adopt a smooth, four-component ISM density structure com-prising a Dickey–Lockman distribution plus a more vertically ex-tended component to produce the Hαemission from the DIG. To allow ionizing photons from mid-plane OB stars to propagate to large heights, we turn the smooth density into a 3D fractal struc-ture using the fractal algorithm of Elmegreen (1997) as described by Wood et al. (2005). We adopt the same five-level hierarchical clumping algorithm, casting 16 seeds at the first level and 32 at each subsequent level. The density structure is arranged so that 33 per cent of the mass is smoothly distributed with the remaining fraction in the hierarchical clumps. For further details of the algorithm, see fig. 4 of Wood et al. (2005) and the accompanying description.
A density structure that produces the observed scaleheight of Hα with an input ionizing luminosity ofQ49=16 is
n(z)=0.4e−(|z|/h1)2/2+0.11e−(|z|/h2)2/2
+0.06e−|z|/h3+0.04e−|z|/h4, (2)
where the heightzis measured in pc and the number densities are per cm3. The first three components represent the Dickey–Lockman
dis-tribution shown in Fig.1with scaleheightsh1=90 pc,h2=225 pc,
h3=400 pc. The fourth term represents the low-density extended
diffuse ionized gas and we take the scaleheight to beh4=1000 pc,
as typically inferred from Hαobservations in the Galaxy.
As before, we place 24 ionizing sources in the simulation and assign each source aT =35 000 K model atmosphere spectrum corresponding to an O5II star (Underhill et al.1979).
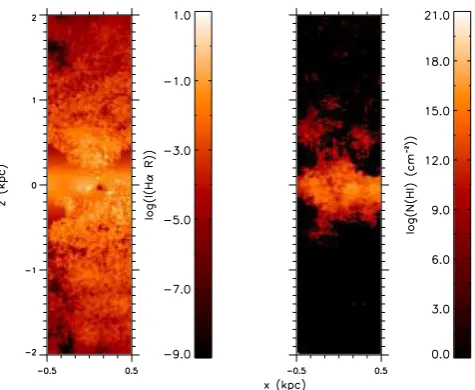
Fig.7shows the edge-on view of the Hαintensity and the neutral hydrogen column density for the fractal density structure described above. The low-density pathways of the interclump medium al-low ionizing photons to reach and ionize gas many kpc from the mid-plane and the Hαintensity and [NII]/Hαline ratios shown in
[image:6.595.309.547.54.249.2]Figs8–10are similar to observed in the Perseus Arm. This is not surprising as we have adopted a density structure that will produce the intensity distribution of Hαin line with the analytic results pre-sented by Haffner et al. (1999) and Reynolds et al. (1999). While the fractal models, with additional heating terms, reproduce many of the features in diagnostic line ratio plots, the Hαintensity map does
[image:6.595.307.544.291.466.2]Figure 7. Edge-on view of Hαintensity (left) and column density of neutral hydrogen (right) for an analytic fractal model of the DIG.
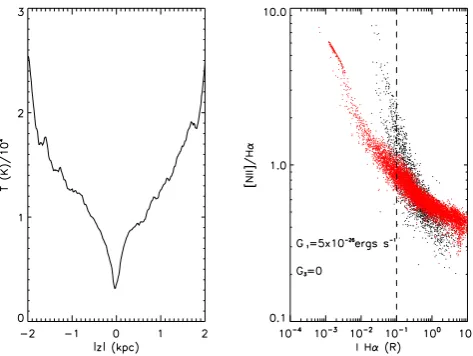
Figure 8. Analytic fractal model of the DIG. Left: average vertical temper-ature structure of ionized gas. Right: [NII]/Hαversus Hαfor the Perseus Arm (black) and this model (red). The vertical line represents the WHAM sensitivity limit. Here, we show [NII]/Hαline ratios only in the region that corresponds to the Perseus Arm (|z|<1.8 kpc). Although this model seems able to reproduce the observed Hαand neutral H, [NII]/Hαand temperature are different to those expected, suggesting the need for an additional heating term to increase temperature and [NII]/Hαat large|z|.
not exhibit the filamentary structures, loops, and bubbles present in the MHD simulations. Therefore, the fractal models should serve as a guide for the average density structure and additional heating required for future MHD simulations of the ISM and DIG.
The resulting average temperature structure and [NII]/Hαversus
Hαare shown for simulations with no additional heating (Fig.8), ad-ditional heating proportional tone(Fig.9) withG1=4×10⁻²⁶, and
an additional heating term to simulate cosmic ray heating (Fig.10) parametrized by
G3=1.2×10⁻²⁹e−3|z|/4000 pcerg cm−3s−1, (3)
as in equation (1). This equation for cosmic ray heating was deter-mined by Wiener et al. (2013) via analytic modelling of the [NII]
and Hαemission and assuming that N+/H+is constant in the DIG and assuming a 1D density structure.G3is 100 times smaller than
at University of St Andrews on September 8, 2014
http://mnras.oxfordjournals.org/
Figure 9. Same as Fig.8including additional heatingG1 =4×1026. This model is now able to produce [NII]/Hαand temperatures similar to those inferred. Here, we show [NII]/Hαline ratios only in the region that corresponds to the Perseus Arm (|z|<1.8 kpc).
Figure 10. Same as Fig.8including additional heating from cosmic rays
G3from equation (3). Here, we show [NII]/Hαline ratios only in the region that corresponds to the Perseus Arm (|z|<1.8 kpc.)
the value found by Wiener et al. (2013), because our simulations determine the actual ionization fractions, and include the spatial variation of ionization, heating and cooling due to the 3D density, radiation field, and temperature structure. Modelling data using our 3D photoionization code therefore provides a better estimate of the additional heating terms required to reproduce the observed trends in the diagnostic diagrams.
6 H OW FA R C A N P H OT O N S T R AV E L T O I O N I Z E T H E D I G ?
How far photons are able to travel through the ISM and ionize the DIG is a question that is important to studies not only of DIG in galaxies, but also for the escape of ionizing photons into the inter-galactic medium. The 3D structures in the MHD and fractal density grids provide low-density pathways allowing ionizing photons to reach far above the mid-plane. Fig.11shows a histogram of the distances travelled by ionizing photons in the density structure pro-vided by the MHD simulations. Some photons do indeed travel very large distances from their sources and are responsible for ionizing
[image:7.595.310.549.282.450.2]Figure 11. Histogram of distances travelled by ionizing photons through the MHD simulation grid for ionizing luminositiesQ49=10 (black), 1 (red), 0.5 (blue).
Figure 12. Histogram showing distances travelled by all ionizing photons (black), diffuse photons from hydrogen (red), and helium (blue) forQ49=1.
the gas at large |z|. The majority of the ionizing photons ionize denser gas towards the mid-plane and only a small fraction is re-quired to ionize the low-density high-altitude gas. Increasing the ionizing luminosity allows photons to travel larger distances be-cause more of the gas at low altitudes is ionized and hence presents a very small opacity.
Our photoionization code tracks direct stellar photons and also diffuse ionizing radiation from H and He recombination. The diffuse ionizing radiation consists of Lyman continuum from recombina-tions to the ground state of H and He, the He two-photon continuum, and the 19.8 eV line from He (Wood et al.2004). Fig.12 shows a histogram of the distances travelled by direct and diffuse ioniz-ing photons and shows that the majority of the diffuse photons are absorbed close to their location of emission (i.e. the ‘on the spot’ approximation in many photoionization codes), but some do travel many hundreds of parsecs through the MHD density grid.
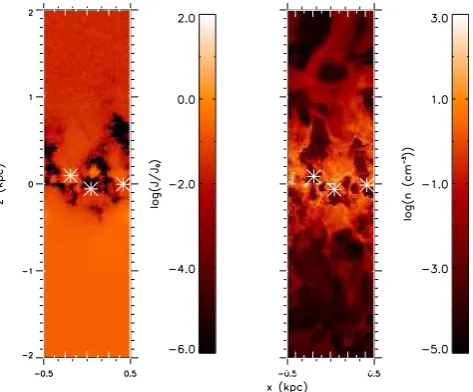
Fig.13shows the mean intensity of the ionizing photons in a one pixel wide slice of the simulation box compared to the density in that slice with positions of ‘bubbles’ marked with a star. Photons travel primarily in the low-density regions of the grid at high al-titude, but close to the mid-plane they travel primarily in bubbles or structures attached to these bubbles. The brightest regions in the
at University of St Andrews on September 8, 2014
http://mnras.oxfordjournals.org/
[image:7.595.47.285.291.465.2]Figure 13. Maps showing mean intensity of ionizing radiation (left) and density (right) in one slice of the simulation box. White stars indicate the position of ‘bubbles’ in the MHD simulations and are characterized by low-density regions in the low-density structure (right). Bright regions of intensity show areas in which many photons are travelling while dark regions have few photons entering them. There is a strong relation between the density of the region and the number of photons travelling in that gas with low-density regions having many photons in them and high-density regions appearing dark in mean intensity.
mean intensity map correspond to source locations, and in the case where a source has been randomly placed in a high-density region close to the mid-plane, its ionizing photons are trapped close to the source. At higher altitudes the mean intensity becomes more uni-form but higher density regions are still visible with fewer photons penetrating into and through these cells. All of the ‘bubbles’ in the simulations are located close to the mid-plane of the box and so at high altitudes photons appear to be travelling through a low-density medium. This provides further evidence that compared to a smooth density structure a 3D ISM naturally allows for ionizing photons to penetrate to larger distances and produce widespread diffuse ionized gas.
7 C O N C L U S I O N S
We have produced photoionization simulations of the DIG in an environment similar to that in the outer disc of a spiral galaxy and compared these to observations of the Perseus Arm and an interarm region in the solar neighbourhood. We summarize our main conclusions here.
(i) The photoionization of 3D density structures from MHD sim-ulations naturally produces widespread diffuse ionized gas with a density scaleheight larger than that of neutral hydrogen. However, the density grids from the MHD simulations we have used here have a low scaleheight resulting in smaller Hαintensity scaleheight than observed in the Perseus Arm.
(ii) We find that with the addition of a heating term, such as heating by cosmic rays or dissipation of turbulence, our simulations are able to reproduce general trends in [NII]/Hαoptical emission
line ratios in the DIG.
(iii) A fractal density structure for the ISM with higher density at large|z|than in the MHD simulations better reproduces WHAM
observations of the Perseus Arm. This will provide a guide for the required density structure for future MHD simulations of the DIG. (iv) Finally, our simulations demonstrate that ionizing photons are able to travel many kiloparsecs to ionize the DIG at large heights above the mid-plane, with photons travelling through low-density ‘bubbles’ close to the mid-plane and through low-density diffuse gas at large heights.
An important next step in modelling the ionization of the DIG will be to include photoionization as a dynamical process in MHD simulations of the gas (e.g. de Avillez et al.2012). This may increase the density of gas at large heights since photoionization will increase the temperature of the gas and allow the gas to expand to a larger height, thereby sustaining higher densities above the mid-plane of the Galaxy that are demanded by the WHAM observations.
AC K N OW L E D G E M E N T S
The Wisconsin H-Alpha Mapper is funded by the US National Science Foundation. JB acknowledges the support of an STFC stu-dentship. The authors would like to thank Mordecai-Mark Mac Low for his helpful comments on this manuscript.
R E F E R E N C E S
Ali B., Blum R. D., Bumgardner T. E., Cranmer S. R., Ferland G. J., Haefner R. I., Tiede G. P., 1991, PASP, 103, 1182
Armstrong J. W., Rickett B. J., Spangler S. R., 1995, ApJ, 443, 209 Barger K. A., Haffner L. M., Bland-Hawthorn J., 2013, ApJ, 771, 132 Bland-Hawthorn J., Freeman K. C., Quinn P. J., 1997, ApJ, 490, 143 Burkhart B., Lazarian A., Gaensler B. M., 2012, ApJ, 749, 145 Chepurnov A., Lazarian A., 2010, ApJ, 710, 853
Cox D. P., 2005, ARA&A, 43, 337
Daflon S., Cunha K., de la Reza R., Holtzman J., Chiappini C., 2009, AJ, 138, 1577
de Avillez M. A., 2000, MNRAS, 315, 479
de Avillez M. A., Asgekar A., Breitschwerdt D., Spitoni E., 2012, MNRAS, 423, L107
Dickey J. M., Lockman F. J., 1990, ARA&A, 28, 215 Elmegreen B. G., 1997, ApJ, 477, 196
Fryxell B. et al., 2000, ApJS, 131, 273
Gaensler B. M., Madsen G. J., Chatterjee S., Mao S. A., 2008, PASA, 25, 184
Garmany C. D., Conti P. S., Chiosi C., 1982, ApJ, 263, 777 Haffner L. M., Reynolds R. J., Tufte S. L., 1999, ApJ, 523, 223
Haffner L. M., Reynolds R. J., Tufte S. L., Madsen G. J., Jaehnig K. P., Percival J. W., 2003, ApJS, 149, 405
Haffner L. M. et al., 2009, Rev. Mod. Phys., 81, 969 Harfst S., Theis C., Hensler G., 2006, A&A, 449, 509
Hausen N. R., Reynolds R. J., Haffner L. M., Tufte S. L., 2002, ApJ, 565, 1060
Hill A. S., Benjamin R. A., Kowal G., Reynolds R. J., Haffner L. M., Lazarian A., 2008, ApJ, 686, 363
Hill A. S., Joung M. R., Mac Low M.-M., Benjamin R. A., Haffner L. M., Klingenberg C., Waagan K., 2012a, ApJ, 750, 104
Hill A. S., Joung M. R., Mac Low M.-M., Benjamin R. A., Haffner L. M., Klingenberg C., Waagan K., 2012b, ApJ, 761, 189
Hoyle F., Ellis G. R. A., 1963, Aust. J. Phys., 16, 1 Jenkins E. B., 2009, ApJ, 700, 1299
Joung M. K. R., Mac Low M.-M., 2006, ApJ, 653, 1266 Joung M. R., Mac Low M.-M., Bryan G. L., 2009, ApJ, 704, 137 Kim J.-h., Krumholz M. R., Wise J. H., Turk M. J., Goldbaum N. J., Abel
T., 2013, ApJ, 775, 109
Kuijken K., Gilmore G., 1989, MNRAS, 239, 605
Kulsrud R. M., Zweibel E. G., 2008, Rep. Prog. Phys., 71, 046901
at University of St Andrews on September 8, 2014
http://mnras.oxfordjournals.org/
McKee C. F., Ostriker J. P., 1977, ApJ, 218, 148
Mac Low M.-M., Klessen R. S., 2004, Rev. Mod. Phys., 76, 125 Madsen G. J., Reynolds R. J., 2005, ApJ, 630, 925
Madsen G. J., Reynolds R. J., Haffner L. M., 2006, ApJ, 652, 401 Ma´ız-Apell´aniz J., 2001, AJ, 121, 2737
Mathis J. S., 2000, ApJ, 544, 347
Miller W. W., III, Cox D. P., 1993, ApJ, 417, 579 Minter A. H., Spangler S. R., 1997, ApJ, 485, 182
Navarro J. F., Frenk C. S., White S. D. M., 1996, ApJ, 462, 563
Osterbrock D. E., Ferland G. J., 2006, Astrophysics of Gaseous Nebulae and Active Galactic Nuclei. University Science Books, Mill Valley, CA Otte B., Gallagher J. S., III, Reynolds R. J., 2002, ApJ, 572, 823
Pauldrach A. W. A., Hoffmann T. L., Lennon M., 2001, A&A, 375, 161 Peters T., Klaassen P. D., Mac Low M.-M., Klessen R. S., Banerjee R., 2012,
ApJ, 760, 91
Rand R. J., 1998, ApJ, 501, 137 Reynolds R. J., 1990, ApJ, 349, L17
Reynolds R. J., Hausen N. R., Tufte S. L., Haffner L. M., 1998, ApJ, 494, L99
Reynolds R. J., Haffner L. M., Tufte S. L., 1999, ApJ, 525, L21 Savage B. D., Wakker B. P., 2009, ApJ, 702, 1472
Simpson J. P., Rubin R. H., Colgan S. W. J., Erickson E. F., Haas M. R., 2004, ApJ, 611, 338
Sternberg A., Hoffmann T. L., Pauldrach A. W. A., 2003, ApJ, 599, 1333 Underhill A. B., Divan L., Prevot-Burnichon M. L., Doazan V., 1979, in
Conti P. S., De Loore C. W. H., eds, Proc. IAU Symp., Vol. 83, Mass Loss and Evolution of O-Type Stars. Reidel, Dordrecht, p. 103 Vacca W. D., Garmany C. D., Shull J. M., 1996, ApJ, 460, 914 Wiener J., Zweibel E. G., Oh S. P., 2013, ApJ, 767, 87 Williams J. P., McKee C. F., 1997, ApJ, 476, 166
Wolfire M. G., Hollenbach D., McKee C. F., Tielens A. G. G. M., Bakes E. L. O., 1995, ApJ, 443, 152
Wood K., Mathis J. S., 2004, MNRAS, 353, 1126
Wood K., Mathis J. S., Ercolano B., 2004, MNRAS, 348, 1337
Wood K., Haffner L. M., Reynolds R. J., Mathis J. S., Madsen G., 2005, ApJ, 633, 295
Wood K., Hill A. S., Joung M. R., Mac Low M.-M., Benjamin R. A., Haffner L. M., Reynolds R. J., Madsen G. J., 2010, ApJ, 721, 1397
Zurita A., Rozas M., Beckman J. E., 2000, A&A, 363, 9
Zurita A., Beckman J. E., Rozas M., Ryder S., 2002, A&A, 386, 801
This paper has been typeset from a TEX/LATEX file prepared by the author.
at University of St Andrews on September 8, 2014
http://mnras.oxfordjournals.org/