© 2019, IRJET | Impact Factor value: 7.211 | ISO 9001:2008 Certified Journal
| Page 5469
Parametric Optimization of Stainless Steel 304 for MIG Welding by
Using Taguchi’s Method
Abhishek D. Dhonde
1, Subhash S. Mane
21
M.Tech Scholar, Department of Mechanical Production Engineering, KIT, Kolhapur, Maharashtra, India
2Professor, Department of Mechanical Production Engineering, KIT, Kolhapur, Maharashtra, India
---***---Abstract –
The MIG Welding is one of the most popularwelding techniques used in industries. The input parameter in MIG welding play a significant role in deciding the weld quality, strength, cost and speed. Most of the time manufacturer faces a problem to select optimum process parameters for a good quality welding. This paper tries to present the effect of different welding parameters like welding current, stickout length and gas flow rate on the hardness of the weld and tensile strength of the weld joint. These all parameters have different effect on welding quality. In order to optimize these parameters for better weld quality Taguchi method has been used. The stainless steel plate have been used as welding material. The ANOVA is also employed to predict the percentage effect of each parameter on results.
Key Words: Taguchi, Hardness, Tensile Strength, SS 304,
ANOVA
1. INTRODUCTION
Welding current is the most influential parameter because it affects bead shape, controls the rate at which electrode is melted and therefore also controls the deposition rate, heat affected zone, the depth of penetration, and the amount of base metal melted. Penetration and reinforcement increase with the increase in welding current. If the current is too high at a given welding speed, the depth of fusion or penetration will also be too high so that the resulting weld may tend to melt through the metal being joined. High current also leads to waste of electrodes in the form of excessive reinforcement and produces digging arc and undercut. This over welding increases weld shrinkage and causes greater distortion. Bead width increases with welding current until a critical value is reached and then starts decreasing if the polarity used is DCEP. When DCEN polarity is employed bead width increases with the increase in current for entire range. For the same flux, heat affected zone also increases with the increase in welding current. If the current is too low, inadequate penetration or incomplete fusion may result. Too low current also leads to unstable arc, inadequate penetration and overlapping. [1]
Welding usually requires high current (over 80 amperes) and it can need above 12,000 amperes in spot welding. Low current can also be used; welding two razor blades together at 5 amps with gas tungsten arc welding is a good example. Welding machines are usually classified as constant current (CC) or constant voltage (CV); a constant current machine varies its output voltage to maintain a steady current while a constant voltage machine will fluctuate its output current to maintain a set voltage. Shielded metal arc welding and gas tungsten arc welding will use a constant current source and
gas metal arc welding and flux-cored arc welding typically use constant voltage sources but constant current is also possible with a voltage sensing wire feeder. In the MIG welding process, welding current is directly related to Stick out length if we increase stickout length there will be less concentration of current due to that there is a chance of inadequate heating [2]
2. LITERATURE REVIEW
Labesh kumar et. al. [1] In this paper they have used the optimisation technic using DOE, here they have studied the parameter optimisation or welding optimisation by using process parameter welding current, number of passes, welding voltage, welding time. From above study they conclude that when number of passes and current increases welding strength get increases and when welding time decreases welding quality decreases.
Rakesh Kumar [2] The study of the welding parameter’s effect on residual stresses and hardness of weld specimen were carried out by statistical technique i.e. analysis of variance (ANOVA) and Signal to Noise (S/N) ratio. The optimum parametric conditions were found out by Taguchi method. Confirmatory test was performed to achieve the validity of the results. By performing investigation procedure, it was found by the analysis based on S/N ratio and ANOVA that the welding voltage contributes 57.3% towards the total variation observed in residual stresses. The welding current contributes 26.14% of the total variation observed in residual stresses. The welding voltage contributes 61.59% towards the total variation observed in hardness. The variable travel speed contributes 32.28% of the total variation observed in hardness.
Kamaleshwar Dhar Dwivedi et. al. [3] The aim this paper work is to study the hardness that affect the welding joint of dissimilar metals. Dissimilar metals welding have great scope in advanced technology now days owing to their high strength, hardness, and corrosion resistance properties. In this experiment they conclude that the hardness depends on the variable parameter and wire feed rate is the main effective parameter.
© 2019, IRJET | Impact Factor value: 7.211 | ISO 9001:2008 Certified Journal
| Page 5470
each parameter has effect on welding quality like weldingstrength, hardness.
Amit Pal [5] This paper tries to present the effect of different welding parameters like welding voltage, filler wire rate and v-butt angle on the strength of the weld joint and elongation produced during the tensile test. These all parameters have different effect on welding quality. In order to optimize these parameters for better weld quality Taguchi Orthogonal array has been used. The medium carbon steel slabs have been used as welding material. The ANOVA is also employed to predict the percentage effect of each parameter on results.
Nirmalendu Choudhary [6] has presented their work on design optimization of process parameters of TIG welding using Taguchi method. They considered welding current, gas flow rate and filler rod as input process parameters and optimizes their values using Taguchi method to improve the ultimate load on weld materials. Taguchi design of experiment, S/N ratio and ANOVA analysis has performed for optimizing the results. The stainless steel slabs & mild steel slabs were used as work piece material. The optimum welding condition is obtained by the Taguchi method: current= 100A, gas flow rate= 18l/min, filler rod= 2. Confirmation test confirmed the optimum values.
Priti Sonasale [7] In this paper they have used four control factors such as wire feed rate, arc voltage, welding speed and gas flow rate are considered. The welding parameters such as bead width, dilution and depth of HAZ have been considered. By using DOE method, the weld parameters were optimized. Analysis is done using ANOVA to determine the significance of parameters. Finally the confirmation test is carried out to compare the predicated values with the experimental values confirm its effectiveness in the analysis of bead width, dilution and depth of HAZ.
A. K. Panday et. al. [8] performed their analysis on optimization of resistance spot welding parameters using Taguchi method. The experiments were conducted under varying pressure, welding current and welding time. The output characteristic considered was tensile strength of the welded joint. The material used was low carbon steel sheets of 0.9mm. Their conclusion leads that the contribution of welding current holding time and pressure towards tensile strength is 61%, 28.7% and 4 % respectively as determined by the ANOVA method.
S. R. Patil et. al. [9] presented their work on optimization of MIG welding parameters for improving welding strength. They presents the influence of welding parameters welding current, welding voltage, welding speed on ultimate strength of welded joints of AISI mild steel materials. A plan of experiments using Taguchi has decided. Experiments were performed and result was confirmed. From this study they concluded that the welding current and welding speed are the major factors affecting tensile strength of welded joints.
Ajit Hooda et. al. [10] has done their research on optimization of MIG welding parameters in order to improve
yield strength of AISI 1040 mild steel. The process parameters welding current, voltage, gas flow rate and wire speed were studied. The experiments were conducted based on four factors, three level orthogonal arrays. The empirical relationship can be used to predict the yield strength of welded material. They conclude that from above study welding current, voltage, gas flow rate and wire speed are major factors affecting the yield strength of welded material. If welding current decrease yield strength get decreases and when wire speed increases yield strength get decreases.
3. METODOLOGY
The experiment have been conducted using MIG WAR 250 model having 250A maximum current with semi-automated welding set up
3.1 Material Selection
The present study has been carried out with two stainless steel 304 plates having 3mm thickness. This material widely used in industries.
Table-1: Chemical Composition of Stainless Steel Grade 304
Table-2: Mechanical Properties 304 Grade Stainless Steel
Grade Tensile
Strength (MPa)
min
Yield Strength
(MPa) min
Elongati on(% in 50mm)m
in
Hardness Rock
well B max
Vickers Max
304 515 205 40 92 203
Electrode wire used for this experimentation is ER304L of diameter 1.2mm and Argon gas used as shielding gas.
3.2 Preparation of Plate Specimen
Specimen of SS 304 material of dimensions 100×50×3 mm are joined by MIG welding. This thickness of plate is widely used compare to other SS Domestic work. As the Thickness of this plate is very less hence there is no any requirement of V groove.
Fig-1: CAD model of prepared specimen
Element C Si Mn P S Ni Cr
© 2019, IRJET | Impact Factor value: 7.211 | ISO 9001:2008 Certified Journal
| Page 5471
Fig-2: Drawing of prepared specimen3.3 Design of Experiments Based on Taguchi
Method
Input Parameters: Welding Current, Stickout Length and Gas Flow Rate
Output Parameters: Hardnes and Tensile Strength
Selected parameter ranges and levels for trail experiments shown in following table
Table-3: Parameter Ranges and Levels Control
Factors Notation Levels Units
I II III
Current A 180 20
0 220 Amp
Stick out
length B 4 8 12 Mm
Gas Flow
Rate C 10 15 20 l/min
Taguchi orthogonal array by using MINITAB 17 were used to conduct the experiments to find the contributions of each factor and to optimize the parameter settings.
The DOE will be carried according to following conditionsL9(3*3) orthogonal array were selected for this work which represent 9 run of experiments.
3.4 Experimentation, Data Validation and
Optimization
Single objective optimization of hardness carried out by using Taguchi method uses a statistical measure of performance called Signal to Noise (S/N) ratio. The S/N ratio is the ratio of mean (signal) to standard deviation (noise) and it is calculated by using MINITAB 17 software. It depends on the quality of product or process. The standard S/N ratio used as follows:
i. Nominal is the better
ii. Higher is the better
iii. Lower is the better.
Where, n= Number of trail or measurement, Measured value of ith run, s= Standard Deviation.
Response for Hardness:
Maximization is required for hardness; hence higher is the better has been used. The effect of process parameters on the performance is indicated by S/N ratio. Larger S/N ratio indicates that better signal is obtained and lesser noise is occurred.
Table-4: Hardness values as per experiments
EXPERIMENT Current SL GFR HARDNESS
1 180 4 10 192
2 180 8 15 177
3 180 12 20 180
4 200 4 15 178
5 200 8 20 192
6 200 12 10 185
7 220 4 20 182
8 220 8 10 195
9 220 12 15 190
For each experimental run, corresponding to mean response and S/N ratio is computed and listed in Table-5, Table-6 mean S/N ratio table for hardness and Fig-3 Main effect plot for S/N ratio of hardness. ANOVA results for tensile strength tabulated in Table-7.
Table-5: Mean and S/N ratio of hardness
EXPERIMENT SNRA MEAN
1 45.6660 192
2 44.9595 177
3 45.1055 180
4 45.0084 178
5 45.6660 192
6 45.3434 185
7 45.2014 182
8 45.8007 195
© 2019, IRJET | Impact Factor value: 7.211 | ISO 9001:2008 Certified Journal
| Page 5472
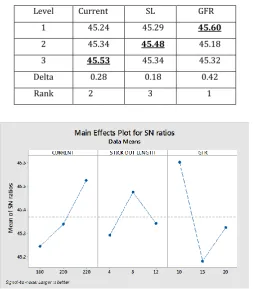
Table -6: S/N ratios response for hardnessLevel Current SL GFR
1 45.24 45.29 45.60
2 45.34 45.48 45.18
3 45.53 45.34 45.32
Delta 0.28 0.18 0.42
Rank 2 3 1
[image:4.595.36.290.105.395.2]Fig-3: Main effect plot for S/N ratio of hardness
Table-7: Analysis of variance for Hardness
Source DF Seq SS Contrib
ution Adj SS Ad
j M S
F-Val
ue P-Va lu e
Current 2 56 15.30% 56 28 0.3
5 0.738
SL 2 26 7.10% 26 13 0.1
6 0.859
GFR 2 126 34.43% 126 63 0.8
0 0.556
Error 2 158 43.17% 158 79
Total 8 366 100.0%
From ANOVA table we can able to identify the percentage contribution of input parameters on the hardness and percentage accuracy of experimentation
Response for Tensile Strength:
[image:4.595.307.561.109.289.2]Maximization is also required for Tensile Strength; hence higher is the better has been used. The effect of process parameters on the performance is indicated by S/N ratio. Larger S/N ratio indicates that better signal is obtained and lesser noise is occurred.
Table-8: Tensile Strength values as per experiments
EXPERIMENT CURRENT SL GFR TENSILE
STRENGTH
1 180 4 10 265.51
2 180 8 15 436.55
3 180 12 20 396.32
4 200 4 15 329.94
5 200 8 20 251.06
6 200 12 10 286.00
7 220 4 20 342.90
8 220 8 10 294.58
9 220 12 15 599.85
[image:4.595.306.561.375.545.2]For each experimental run, corresponding to mean response and S/N ratio is computed and listed in Table-9, Table-10 mean S/N ratio table for tensile strength and Fig-4 Main effect plot for S/N ratio of tensile strength. ANOVA results for tensile strength tabulated in Table-.11.
Table-9: Mean and S/N ratio of Tensile Strength
EXPERIMENT SNRA MEAN
1 48.4816 265.51
2 52.8007 436.55
3 51.9609 396.32
4 50.3687 329.94
5 47.9956 251.06
6 49.1273 286.00
7 50.7033 342.90
8 49.3841 294.58
9 55.5609 599.85
Table-10: S/N Response table for Tensile Strength
Level Current SL GFR
1 51.08 49.85 49.00
2 49.16 50.06 52.91
3 51.88 52.22 50.22
Delta 2.72 2.37 3.91
[image:4.595.30.293.438.610.2]© 2019, IRJET | Impact Factor value: 7.211 | ISO 9001:2008 Certified Journal
| Page 5473
Fig-4: Main effect plot for S/N ratio of Tensile StrengthTable-11: Analysis of variance for Tensile Strength
Sourc e
DF Seq
SS
Contribu tion
Adj SS
Adj MS
F-Val
ue P-Val
ue
Curre nt
2 23332 24.23% 2333
2
1166 6.0
15. 30
0.0 61
SL 2 23347 24.22% 2334
7
1167 3.5
15. 31
0.0 61
GFR 2 48097 49.94% 4809
7
2404 8.4
31. 54
0.0 31
Error 2 1525 1.58% 1525 762.
4
Total 8 96301 100.00%
Analysis of variance (ANOVA) using MINITAB 17 software has been performed to determine the contribution of process parameters on Tensile Strength for Taguchi optimization method
4 RESULTS AND DISCUSSION
For hardness: Fig.-3 shows the effect of the different levels of parameters on the hardness. The highest values are bold and underlined in Table 13.5.
Level 3 for current (i.e. 220 Amp), resulting 189.0 is indicated as the optimum condition in terms of hardness while variation of current is only considered.
Level 2 for stick out length (i.e. 8 mm), resulting 188.0 is indicated as the optimum condition in terms of hardness while variation in stick out length only considered.
Level 1 for gas flow rate (i.e. 10 l/min) resulting 190.7 is indicated as optimum condition in term of hardness while variation in gas flow rate only considered.
For tensile strength: Fig-4 shows the effect of the different levels of parameters on the Tensile Strength. The highest values are bold and underlined in Table 13.10
Level 3 for current (i.e. 220 Amp), resulting 412.4 is indicated as the optimum condition in terms of tensile strength while variation of current is only considered.
Level 3 for stick out length (i.e. 12 mm), resulting 427.4 is indicated as the optimum condition in terms of tensile strength while variation in stick out length only considered. Level 2 for gas flow rate (i.e. 15 l/min) resulting 455.4 is indicated as optimum condition in term of tensile strength while variation in gas flow rate only considered.
5 CONCLUSION
This paper has presented an investigation on the optimization and the effect of welding parameters on the hardness and tensile strength of weld by using Minitab 17 and level of importance of the welding parameters on hardness and tensile strength determined by using ANOVA. Based on the ANOVA method, the highly effective parameter on hardness and gas flow rate is gas flow rate followed by current and stickout length and from above result conclude that to reduce the variation in parameter we have to conduct final experiment by using L27 orthogonal array with interaction to find out optimal parameter combination of current, stickout length and gas flow rate
REFERENCES
[1] Rakesh Kumar, and Gurinder Singh Brar, Optimization of Process Parameters for MIG Welding by Taguchi Method, International Journal of Scientific Research Engineering & Technology (IJSRET), ISSN 2278 – 0882 Volume 6, Issue 7, July 2017
[2] Amit Pal, MIG Welding Parametric Optimization Using Taguchi’s Orthogonal Array And Analysis of Variance, International Journal Of Research Review In Engineering Science & Technology (ISSN 2278–6643) Volume-4, ISSUE-1, APRIL-2015
[3] Raj Kumar Yadav, Sandhaya Yadav, Anurag Singh and Pankaj Singh, Optimization Of MIG Welding Technique Parameters With The Help Of Taguchi Method, International Journal of Production Technology and Management (IJPTM) Volume 7, Issue 2, July-December, 2016, pp. 16–27, Article ID: IJPTM_07_02_003.
© 2019, IRJET | Impact Factor value: 7.211 | ISO 9001:2008 Certified Journal
| Page 5474
[5] Nirmalendhu Choudhury, Asish Bandyopadhyay, RameshRudrapati, (2014), Design optimization of process parameters for TIG welding based on Taguchi method. International Journal of Cureent Engineering and Technology, pp. 12-16.
[6] S.R. Patil, C.A. Waghmare, (2013), Optimization of MIG welding parameters for improving strength of welded joints. International Journal of Advanced Engineering and Studies, pp.14-16
[7] Ajit Hooda, Ashwani Dhingra and Satpal Sharma, (2012) , Optimization of Welding process parameters to predict maximum yield strength in AISI 1040. International Journal of mechanical Engineering and Robotics Research India, pp. 204-212