warwick.ac.uk/lib-publications
A Thesis Submitted for the Degree of PhD at the University of Warwick
Permanent WRAP URL:
http://wrap.warwick.ac.uk/104207
Copyright and reuse:
This thesis is made available online and is protected by original copyright.
Please scroll down to view the document itself.
Please refer to the repository record for this item for information to help you to cite it.
Our policy information is available from the repository home page.
1
Cancer gene mutation
detection in circulating
cell-free DNA in blood
by
Hugh Kikuchi BSc MPhil
A thesis submitted in partial fulfilment of the requirements for the degree of
Doctor of Philosophy in Medical Sciences
Division of Biomedical Sciences, Warwick Medical School, University of Warwick
2
Table of Contents
Table of Contents ... 2
Abbreviations ... 7
List of Figures ... 13
List of Tables ... 17
Acknowledgements ... 23
Declaration ... 26
List of Publications ... 28
Abstract ... 30
Chapter One - Introduction ... 32
1.1 LUNG CANCER ... 33
1.1.1 Diagnosis of Lung Cancer in the UK ... 34
1.1.2 Treatment of Lung Cancer ... 37
1.2 INTRODUCTION TO COLORECTAL CANCER ... 38
1.2.1 Diagnosis of Colorectal Cancer ... 40
1.2.2 Treatment of Colorectal cancer ... 41
1.3 GENETIC BASIS OF CRC AND NSCLC ... 41
1.3.1 EGFR ... 42
1.3.2 KRAS ... 44
1.3.3 Other significant genes in the EGFR/ KRAS pathway ... 46
1.4 NICE GUIDELINES FOR EGFR TESTING IN NSCLC ... 49
1.5 NICE GUIDELINES FOR KRAS TESTING IN COLORECTAL CANCER ... 57
1.6 LIMITATIONS OF EXISTING PROTOCOLS ... 57
1.7 INTRODUCTION TO CELL FREE DNA ... 58
1.8 STUDIES OF EGFR MUTATION DETECTION ... 62
1.8.1 Studies Investigating Alternative Tissue Sample Types or Sample Processing Methods ... 64
1.8.2 Studies of EGFR Mutation Detection Techniques ... 69
1.8.3 Studies of EGFR Mutant Detection using Blood/ cfDNA ... 74
1.8.4 Recent Validations of EGFR testing Methods ... 76
1.9 SUMMARY ... 81
1.10 HYPOTHESIS/ RESEARCH QUESTIONS ... 83
1.11 PROJECT AIMS ... 83
1.12 JUSTIFICATION OF RESEARCH DESIGN ... 84
A1 CHAPTER ONE APPENDIX ... 85
3
A1.1 Search One- To identify articles related to EGFR detection from tissue ... 85
A1.2 Search Two- To identify articles related to EGFR detection from blood/ cfDNA ... 85
A1.3 Search Three- To identify articles performing direct comparisons of techniques ... 86
A1.4 Search Four- To identify articles specifically investigation Cell Free/ Circulating Tumour DNA ... 86
A1.5 Search Five- To identify recent validation studies to update literature search ... 86
A1.6 Literature Results ... 88
Chapter Two – Detection of EGFR and KRAS mutants using the novel GeneFirst™ PNA PCR assay ... 92
2.1 INTRODUCTION ... 93
2.1.1 AIMS ... 99
2.2 METHODS ... 100
2.2.1 Equipment ... 100
2.2.2 Kits ... 100
2.2.3 Pathology Department Extracted DNA Samples ... 101
2.2.4 Lung Cancer (NSCLC) Extracted DNA samples ... 101
2.2.5 CRC Extracted DNA samples ... 102
2.2.6 UHCW Pathology Department Mutation Results ... 103
2.2.6.1 Qiagen Therascreen EGFR RGQ PCR ... 103
2.2.6.2 Life Technologies KRAS castPCR™ ... 103
2.2.7 Quantification of DNA by the Qubit platform ... 105
2.2.8 GeneFirst PCR ... 106
2.2.8.1 GeneFirst EGFR Kit ... 106
2.2.8.2 GeneFirst KRAS Kit ... 109
2.2.8.3 Next Generation Sequencing of Tissue DNA ... 112
2.3 RESULTS... 115
GENEFIRST EGFR ASSAY ... 115
2.3.1 GF EGFR Assay Version 1 ... 115
2.3.2 GF EGFR Assay Version 2 ... 118
2.3.3 GF EGFR Assay Version 3 ... 122
2.3.4 GF EGFR Assay Version 4 ... 125
2.3.5 GF EGFR Assay Version 5 ... 127
GENEFIRST KRAS ASSAY ... 132
2.3.6 GF KRAS Assay Version 1 ... 132
4
2.3.8 GF KRAS Assay Version 3 ... 138
2.3.9 GF KRAS Assay Version 4 ... 140
2.3.10 GF KRAS Assay Version 5 ... 143
2.3.11 Confirmatory Testing using Next Generation Sequencing... 148
2.3.12 GF EGFR/ KRAS Assays and cfDNA ... 151
2.3 DISCUSSION ... 153
2.3.1 GeneFirst EGFR PCR assay development using Tissue ... 153
2.3.2 GeneFirst KRAS PCR assay development using Tissue ... 155
2.3.3 NGS application ... 158
2.3.4 Conclusion ... 159
A2 CHAPTER TWO APPENDIX ... 161
A2.1 GeneFirst EGFR raw data versions 1-5 ... 161
A2.2 GeneFirst KRAS raw data versions 1-5 ... 167
A2.3 NGS Supplemental Data ... 173
Chapter Three – Optimisation and Validation of Cancer Gene Mutation Detection in tissue using TaqMan Array ... 174
3.1 INTRODUCTION ... 175
3.1.1 Aims ... 178
3.2 METHODS ... 179
3.2.1 Equipment ... 179
3.2.2 Kits and Reagents ... 179
3.2.3 Design of REB Arrays ... 180
3.2.4 Patients and Samples ... 182
3.2.5 DNA Extraction ... 182
3.2.6 TaqMan Arrays ... 183
3.2.7 Data Analysis ... 184
3.3 RESULTS... 186
3.3.1 Setting Analysis Thresholds ... 186
3.3.2 Optimisation of sample loading ... 193
3.3.3 Parallel testing of Pathology Department Diagnostic Samples ... 199
3.3.4 Parallel testing: EGFR ... 199
3.3.5 Parallel testing: KRAS/ NRAS ... 201
3.3.6 Parallel testing: BRAF ... 203
3.3.7 Sensitivity and Specificity ... 205
5
3.4 DISCUSSION ... 210
A3 CHAPTER THREE APPENDIX ... 215
Chapter Four – Automated isolation of circulating cell free DNA from blood plasma in lung cancer ... 216
4.1 INTRODUCTION ... 217
4.1.1 Aims ... 220
4.2 METHODS ... 221
4.2.1 Equipment ... 221
4.2.2 Kits ... 222
4.2.3 Cell Free DNA Analysis ... 223
4.2.3.1 Patients and Samples ... 224
4.2.3.2 Plasma Separation ... 224
4.2.3.3 DNA Extraction from Plasma ... 225
4.2.4 DNA quantification ... 226
4.2.5 Ion Torrent Next Generation Sequencing of Plasma DNA ... 227
4.2.6 TaqMan Array PCR Assay ... 228
4.2.7 Statistical Analysis ... 228
4.3 RESULTS... 229
4.3.1 DNA quantity ... 229
4.3.2 NGS Library quality: Quantitation EZ1 vs Maxwell ... 233
4.3.3 NGS Data Quality ... 234
4.3.4 NGS Variant Detection ... 241
4.3.5 NGS Hotspot Detection ... 242
4.3.6 Performance of cfDNA in TaqMan Array Assay ... 244
4.3.7 Disease Stage versus cfDNA Levels in Plasma ... 245
4.4 DISCUSSION ... 247
Chapter Five – Discussion ... 253
5.1 INTRODUCTION ... 254
5.2 SINGLE GENE TESTING ... 254
5.3 MULTIPLE GENE TESTING ... 257
5.4 CELL FREE DNA ... 259
5.5 OUTCOMES FROM WORK PERFORMED IN THIS PROJECT ... 262
5.6 LIMTATIONS OF THE PROJECT ... 263
5.6.1 GeneFirst Assays ... 263
5.6.2 TaqMan Array ... 264
6
5.7 DEVELOPMENTS IN THIS FIELD ... 266 5.8 FUTURE WORK AND CONCLUSION ... 269
7
Abbreviations
% Percent
ΔCt Delta Cycle threshold
AKT Alternative name for PKB (Protein Kinase B)
ALK Anaplastic Lymphoma Kinase
ARMS Amplification Refractory Mutation System
ATC Anaplastic Thyroid Carcinoma
BAL Bronchoalveolar lavage
BEAMing Beads Emulsion Amplification Magnetics
Bi-PASA Bidirectional PCR Amplification of Specific Alleles
bp Base Pair
BRAF v-Raf murine sarcoma viral oncogene homolog B
BRISQ Biospecimen reporting for improved study quality
castPCR Competitive allele-specific Polymerase Chain Reaction, also referred to as CAST
CD340 Cluster of Differentiation 340
CE-IVD CE marked- In Vitro Diagnostic
CE-SSCA Capillary Electrophoresis Single-Strand Conformation analysis
cfDNA Circulating/ Cell Free Deoxyribonucleic Acid
CNG Copy Number Gain
CNV Copy Number Variation
COLD-PCR Co-amplification at Lower Denaturation temperature-PCR
COSMIC Catalogue of Somatic Mutations in Cancer, online database
CoV Coefficient of Variance
CR Conserved Regions
8
CRC Colorectal Cancer
CRUK Cancer Research UK
Ct Cycle Threshold
CT Computed Tomography
CTC Circulating Tumour DNA
ctDNA Circulating Tumour Cell
dH2O Distilled and autoclaved water
DLBCL Diffuse Large B-Cell Lymphoma
DNA Deoxyribonucleic Acid
dPCR Digital Polymerase Chain Reaction
dsDNA Double Stranded Deoxyribonucleic Acid
EBUS Endobronchial ultrasound
EDTA Ethylenediaminetetraacetic acid
EGF Epidermal Growth Factor
EGFR Epidermal Growth Factor Rector
EQA External Quality Assessment
ErbB2 Alternative name for HER2
ErbB3 Alternative name for HER3
EUS Endoscopic ultrasound
FDA Food and Drug Administration
FFPE Formulin Fixed Parafin Embedded
FFPET Formulin Fixed Parafin Embedded Tumour
FNA Fine Needle Aspiration
FRET-PCR Fluorescence Resonance Energy Transfer PCR
9
gDNA Genomic Deoxyribonucleic Acid
GDP Guanosine diphosphate
GF GeneFirst
GTP Guanosine-5'-triphosphate
HE Hematoxylin and Eosin
HER Human Epidermal Growth Factor Receptor
HER 3 Human Epidermal Growth Factor Receptor 3
HER2/neu Human Epidermal Growth Factor Receptor 2/ proto-oncogene neu
HRM High Resolution Melt
HVR Hypervariable Region
IHC Immunohistochemistry
IL Interleukin
KRAS Kirsten Rat Sarcoma viral oncogene homolog
LBC Liquid Based Cytology
LCM Laser Capture Microdissection
LINE-1 Long interspersed nuclear elements 1
LNA Linked Nucleic Acid
LoD Limit of Detection
MALDI-TOF Matrix-Assisted Laser Desorption/Ionization Time Of Flight
MAP MIDI Activated Pyrophosphorolysis
MAPK Mitogen-Activated Protein Kinase
MDT Multidisciplinary Team
ME-PCR Mutant Enriched Polymerase Chain Reaction
MET MET Proto-Oncogene, Receptor Tyrosine Kinase, also referred to as c-MET
10
MIDI Micro-Insertions, Deletions, Indels
miRNA Micro Ribonucleic Acid
MM Master Mix
MPE Malignant Pleural Effusion
MRI Magnetic Resonance Imaging
MS Mass Spectrometry
n Number
NAEDI National Awareness and Early Diagnosis Initiative
ng Nanogram
NGS Next Generation Sequencing
NHS National Health Service
NICE National Institute of Health and Care Excellent
NPA Negative Percent Agreement
NPC Nasopharyngeal Carcinoma
NPV Negative Predictive Value
NRAS Neuroblastoma RAS viral oncogene homolog
NSCLC Non-Small Cell Lung Cancer
NTC No Template Control
p Probability
P. Page
PAP-A Pyrophosphorolysis-Activated Polymerisation Allele specific amplification
PBMC Peripheral Blood Mononuclear Cell
PCR Polymerase Chain Reaction
PE Pleural Effusion
11
PFS Progression Free Survival
PGM Personal Genome Machine (NGS Instrument)
PI3K Phosphatidylinositol-3-Kinase
PIK3CG Phosphatidylinositol-4,5-bisphosphate 3-kinase catalytic subunit gamma isoform
pM Picomolar
PNA Peptide Nucleic Acid
PPA Positive Percent Agreement
PPV Positive Predictive Value
PTEN Phosphatase and tensin homolog
Q-PCR Quantitative Polymerase Chain Reaction
RFLP Restriction Fragment Length Polymorphism
RGQ RotorGene ™ Q (PCR Instrument)
RNA Ribonucleic Acid
RPO Residual Polyp of Origin
RT-PCR Real Time Polymerase Chain Reaction
SAP Shrimp Alkaline Phosphatase
SD Stable Disease
SNP Single Nucleotide Polymorphism
SOP Standard Operating Procedure
SSCP Single Strand Conformation Polymorphism
SSLC Small Cell Lung Cancer
STAT Signal Transducer and Activator of Transcription
TA TaqMan Array
Tam-Seq Tagged-amplicon deep Sequencing
12
TGFα Transforming Growth Factor Alpha
TKI Tyrosine Kinase Inhibitor
TLDA TaqMan Low Density Array (original name for TaqMan Array)
TP53 Tumor Protein p53, also known as P53
UHCW University Hospital Coventry and Warwickshire
UK United Kingdom
UKLS UK Lung Cancer Screening Trial
µl Microlitre
UV Ultraviolet
VEGF-A Vascular Endothelial Growth Factor A
WGS Whole Genome Sequencing
13
List of Figures
Figure 1.2 Page 40 Diagram of benign to CRC transformation.
Figure 1.3 Page 42 Summary of the EGFR and KRAS signalling pathway.
Figure 1.3.3 Page 47 Diagram of RAS functional domains and isoforms.
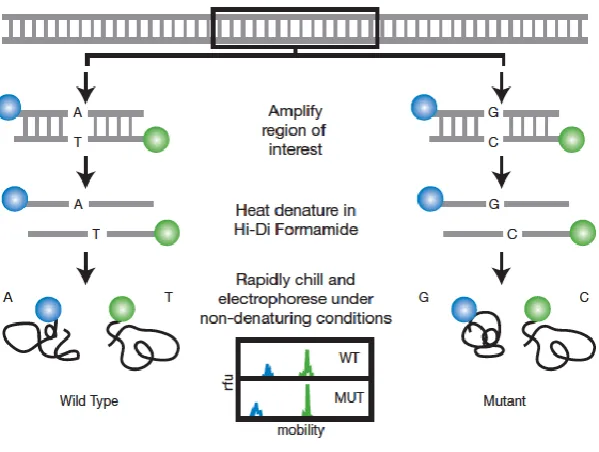
Figure 1.4.4 Page 54 The chemistry of pyrosequencing technology.
Figure 1.4.6. Page 55 Diagram demonstrating the principle of Single Strand
Confirmation Polymorphism (SSCP) Analysis.
Figure 1.4.7. Page 57 Diagram showing the melt curves from HRM analysis.
Figure 1.8.2.1 Page 74 Diagram of the Bi-PASA reaction.
Figure 1.8.2.2 Page 75 Diagram of the SNaPshot® kit chemistry.
Figure 2.1.1 Page 95 ARMS primers.
Figure2.1.2 Page 96 The mechanism of the Scorpion Primer Probe.
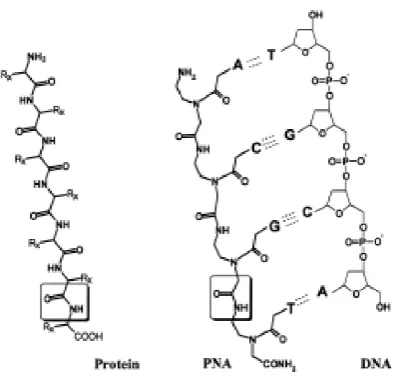
Figure 2.1.3: Page 97 Diagram of a PNA molecule and a PNA/ DNA duplex.
Figure 2.2.6.1 Page 103 Mutations tested by Qiagen Therascreen EGFR RGQ PCR Kit.
Figure 2.2.6.2 Page 104 Mutations tested by Life Technologies BRAF KRAS castPCR
assay.
Figure 2.2.7 Page 105 Qubit 2.0 Nucleic Acid Analyser Instrument.
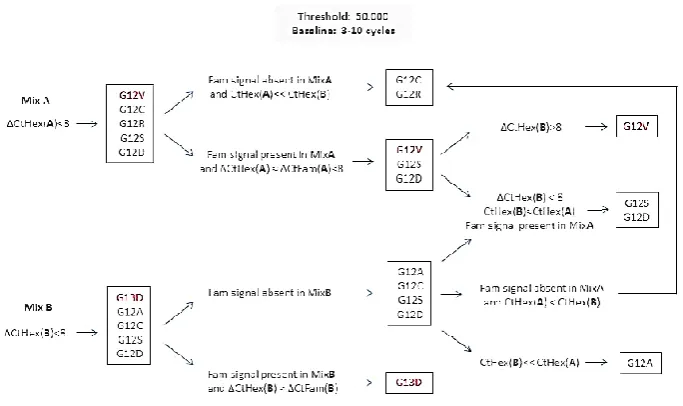
Figure 2.2.8.2 Page 112 Additional analysis algorithm for GF KRAS PCR version 5.
Figure 2.2.8.3.2 Page 114 Ion Chef Instrument and Ion Torrent Personal Genome
Machine (PGM).
Figure 2.3.3 Page 124 Agarose gel image of GF EGFR version 3 assay PCR products.
Figure 2.3.10.1 Page 147 EGFR and KRAS Endogenous Control performance.
Figure A2.1 Page 166 Amplification plot showing the ROX channel from the no
14
Figure A2.2.1 Page 172 Amplification plot showing the ROX channel from the no
template control experiment with GF KRAS assay version 3.
Figure A2.2.2 Page 172 Amplification plot showing the FAM channel from the no
template control experiment with GF KRAS assay version 3.
Figure 3.2.6 Page 184 Diagram of the TaqMan Array card.
Figure 3.3.2.1 Page 195 Amplification plots from TaqMan Array runs at varying
gDNA concentrations.
Figure 3.3.2.2 Page 196 Amplification plots from TaqMan Array runs at varying
gDNA concentrations.
Figure 3.3.2.3 Page 196 Performance of TA control assays (_rf) at varying DNA
inputs.
Figure 3.3.2.4 Page 197 Summary chart of mean Ct from all control assays (_rf) at
varying DNA inputs.
Figure 3.3.2.5 Page 197 Performance of TA mutant target assays (_mu) at varying
DNA inputs.
Figure 4.2.1.1 Page 222 Promega Maxwell and Qiagen EZ1 DNA Extraction
Instruments.
Figure 4.2.1.2 Page 222 Nanodrop spectrophotometer instrument.
Figure 4.3.1.1 Page 230 DNA isolation from plasma, using platforms Qiagen EZ1 and
Promega Maxwell. Measurements by Nanodrop.
Figure 4.3.1.2 Page 230 DNA isolation from plasma, using platforms Qiagen EZ1 and
Promega Maxwell. Measurements by Qubit.
Figure 4.3.1.3 Page 231 Graph showing the cfDNA recovery from plasma separated
15
Figure 4.3.1.4 Page 232 Graph showing the cfDNA recovery from plasma separated
at varying storage times. EZ1 platform only. Measurements from Qubit
instrument.
Figure 4.3.1.5 Page 232 Graph showing the cfDNA recovery from plasma separated
at varying storage times. Maxwell platform only. Measurements from Qubit
instrument.
Figure 4.3.2 Page 234 Graph showing NGS library quantification values, arranged
in ascending order from Maxwell extracts.
Figure 4.3.3.1 Page 235 Graph showing EDTA blood storage time against mean read
length from NGS analysis.
Figure 4.3.3.2 Page 236 Graph showing EDTA blood storage time against mean read
length from NGS analysis. EZ1 platform only.
Figure 4.3.3.3 Page 236 Graph showing EDTA blood storage time against mean read
length from NGS analysis. Maxwell platform only.
Figure 4.3.3.4 Page 238 Graph showing EDTA blood storage time against mean
number of reads from NGS analysis.
Figure 4.3.3.5 Page 239 Graph showing EDTA blood storage time against mean
number of reads from NGS analysis. EZ1 Platform only.
Figure 4.3.3.6 Page 239 Graph showing EDTA blood storage time against mean
number of reads from NGS analysis. Maxwell Platform only.
Figure 4.3.3.7 Page 240 Graph correlating read length against coverage from NGS
analysis. Samples are grouped by extraction method.
Figure 4.3.4 Page 242 Graph showing the number of variants detected in each
cfDNA sample, arranged in ascending order (based on Maxwell extract
variant detection).
16
Figure 4.3.7 Page 246 Graph showing cfDNA concentration against patient disease
17
List of Tables
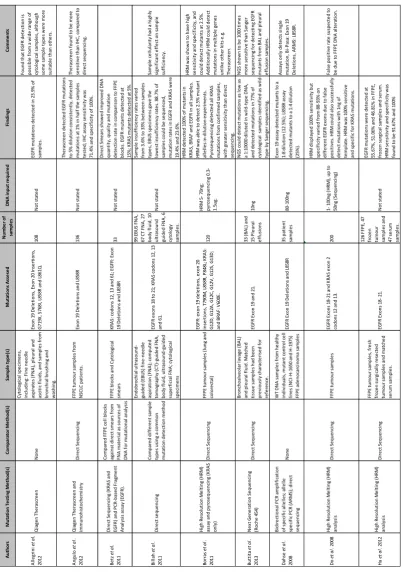
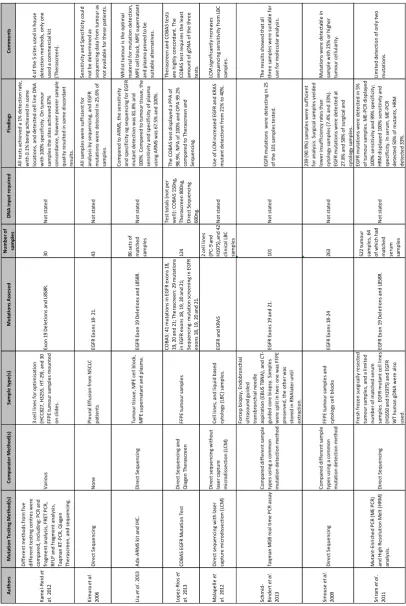
Table A1.6.1 Page 90 Articles selected after literature search and filtering. Part 1.
Table A1.6.2 Page 91 Articles selected after literature search and filtering. Part 2.
Table A1.6.3 Page 92 Articles selected after literature search and filtering. Part 3.
Table 2.2.6.1 Page 103 Mutations tested by Qiagen Therascreen EGFR RGQ PCR Kit.
Table 2.2.8.1.1 Page 106 EGFR mutations detected by the GeneFirst assays.
Table 2.2.8.1.2 Page 107 Reaction compositions of the GeneFirst EGFR PCR kits.
Table 2.2.8.1.3 Page 108 Cycling conditions of the GeneFirst EGFR PCR kits.
Table 2.2.8.2.1 Page 109 KRAS mutations detected by the GeneFirst assays.
Table 2.2.8.2.2 Page 110 Reaction composition of the GeneFirst KRAS PCR kits.
Table 2.2.8.2.3 Page 111 Cycling conditions of the GeneFirst KRAS PCR kits.
Table 2.2.8.3.1 Page 113 The European OncoNetwork 22-gene NGS panel.
Table 2.3.1.1 Page 116 Summary table showing the concordance % and discrepancy
% of the GeneFirst EGFR PCR assay version 1.
Table 2.3.1.2 Page 117 Endogenous control results from samples tested with EGFR
assay version 1.
Table 2.3.2.1 Page 119 Summary table showing the concordance % and discrepancy
% of the GeneFirst EGFR PCR assay version 2.
Table 2.3.2.2 Page 120 Limit of Detection (LOD) experiments using mutant samples
diluted to varying degrees with WT samples.
Table 2.3.2.4 Page 121 Endogenous control results from samples tested with EGFR
assay version 2.
Table 2.3.3.1 Page 122 Summary table showing the concordance % and discrepancy
18
Table 2.3.3.2 Page 124 Endogenous control results from samples tested with EGFR
assay version 3.
Table 2.3.4.1 Page 126 Summary table showing the concordance % and discrepancy
% of the GeneFirst EGFR PCR assay version 4.
Table 2.3.4.2 Page 126 Endogenous control results from samples tested using EGFR
assay version 4.
Table 2.3.5.1 Page 128 Summary table showing the concordance % and discrepancy
% of the GeneFirst EGFR PCR assay version 5.
Table 2.3.5.2 Page 129 Complete analysis of PCR results from all GF EGFRv5 master
mixes.
Table 2.3.5.3 Page 130 Summary of GF EGFR version 5 data.
Table 2.3.5.4 Page 130 Endogenous control results from samples tested using the
EGFR version 5 assay.
Table 2.3.5.5 Page 131 Summary table showing the concordance % and discrepancy
% of all the samples tested with the GeneFirst EGFR PCR assay versions 1- 5.
Table 2.3.6.1 Page 133 Summary table showing the concordance % and discrepancy
% of the GeneFirst KRAS PCR assay version 1.
Table 2.3.6.3 Page 134 Endogenous control results from samples tested using the
KRAS assay version 1.
Table 2.3.7.1 Page 136 Summary table showing the concordance % and discrepancy
% of the GeneFirst KRAS PCR assay version 2.
Table 2.3.7.2 Page 136 Limit of Detection (LoD) experiments using mutant samples
diluted to varying degrees with WT samples.
Table 2.3.7.3 Page 137 Endogenous control results from samples tested using the
19
Table 2.3.8.2 Page 139 Summary table showing the concordance % and discrepancy
% of the GeneFirst KRAS PCR assay version 3.
Table 2.3.8.3 Page 140 Endogenous control results from samples tested using the
KRAS assay version 3.
Table 2.3.9.2 Page 141 Summary table showing the concordance % and discrepancy
% of the GeneFirst KRAS PCR assay version 4.
Table 2.3.9.3 Page 142 Endogenous control results from samples tested using the
KRAS assay version 4.
Table 2.3.10.1 Page 143 Summary table showing the concordance % and discrepancy
% of the GeneFirst KRAS PCR assay version 5.
Table 2.3.10.2 Page 144 Analysis of PCR results from all GF KRASv5 master mixes.
Table 2.3.10.3 Page 145 Endogenous control results from samples tested using the
KRAS assay version 5.
Table 2.3.10.4 Page 146 Summary of GF KRAS version 5 data.
Table 2.3.10.5 Page 147 Summary table showing the overall concordance % and
discrepancy % of the GeneFirst KRAS PCR assay versions 1-5.
Table 2.3.11.1 Page 149 Hotspot mutations detected in samples from the GeneFirst
EGFR and KRAS assays.
Table 2.3.11.2 Page 149 Mutation detection results from five assays: Therascreen,
GeneFirst EGFR PCR, castPCR, GeneFirst KRAS PCR and Ion Torrent NGS.
Table 2.3.12.1 Page 151 Endogenous control results from plasma samples tested on
EGFR assay version 3.
Table 2.3.12.2 Page 151 Endogenous control results from plasma samples tested on
KRAS assay version 3.
20
Table A2.1.1 Page 161 Anonymised Pathology samples tested using the GeneFirst
EGFR PCR assay version 1.
Table A2.1.2: Page 162 Anonymised Pathology samples tested using the GeneFirst
EGFR PCR assay version 2.
Table A2.1.3 Page 163 Anonymised Pathology samples tested using the GeneFirst
EGFR PCR assay version 3.
Table A2.1.4 Page 164 Anonymised Pathology samples tested using the GeneFirst
EGFR PCR assay version 4.
Table A2.1.5 Page 165 Anonymised Pathology samples tested using the GeneFirst
EGFR PCR assay version 5.
Table A2.1.6 Page 166 Experiments running no template controls in the GF EGFR
assay version 3.
Table A2.2.1 Page 167 Anonymised Pathology samples tested using the GeneFirst
KRAS PCR assay version 1.
Table A2.2.2 Page 168 Anonymised Pathology samples tested using the GeneFirst
KRAS PCR assay version 2.
Table A2.2.3 Page 169 Anonymised Pathology samples tested using the GeneFirst
KRAS PCR assay version 3.
Table A2.2.4 Page 170 Anonymised Pathology samples tested using the GeneFirst
KRAS PCR assay version 4.
Table A2.2.5 Page 171 Anonymised Pathology samples tested using the GeneFirst
KRAS PCR assay version 5.
Table A2.2.6 Page 171 Experiments running no template controls in the GF KRAS
assay version 3.
Table A2.3 Page 173 All NGS hotspot data detected in tissue DNA samples that
21
Table 3.2.3 Page 181 Reference (suffix _rf) and Mutant (suffix _mu) assays
included in the TA assay plate lay out.
Table 3.3.1.1 Page 187 TaqMan Array control assay performance with a selection of
samples at varying DNA concentrations.
Table 3.3.1.2 Page 189 TaqMan Array mutant target assay performance with a
selection of samples at varying DNA concentrations.
Table 3.3.1.3 Page 190 TaqMan Array control assay performance with a selection of
samples at varying DNA concentrations.
Table 3.3.1.4 Page 192 TaqMan Array control assay performance with a selection of
samples at varying DNA concentrations.
Table 3.3.2.1 Page 194 Data from increasing DNA input.
Table 3.3.4.1 Page 200 Results of NSCLC validation samples, including Therascreen
and TaqMan Array results.
Table 3.3.4.2 Page 201 NSCLC samples giving discrepant results (Therascreen vs
TaqMan Array) and associated NGS results.
Table 3.3.5.1 Page 202 Results of colorectal validation samples, including castPCR
and TaqMan Array results.
Table 3.3.5.2 Page 203 Colorectal samples giving discrepant results (castPCR vs
TaqMan Array) and associated NGS results.
Table 3.3.6.1 Page 204 Results of Melanoma validation samples, including TaqMan
Array and NGS results.
Table 3.3.6.2 Page 204 Colorectal samples giving discrepant results (castPCR vs
TaqMan Array) and associated NGS results.
Table 3.3.7.1 Page 205 Validation summary of lung samples tested using the
22
Table 3.3.7.2 Page 206 Validation summary of colorectal samples tested using the
TaqMan Array assay.
Table 3.3.7.3 Page 206 Validation summary of melanoma samples tested using the
TaqMan Array assay.
Table 3.3.7.4 Page 207 Validation summary of Melanoma samples tested using the
TaqMan Array assay.
Table 3.3.8 Page 208 TA results for control and mutant assays using prospective
cfDNA samples.
Table A3 Page 215 Costings estimate for new TaqMan Array assay compared to
the currently in use test (Qiagen Therascreen).
Table 4.2.3.1 Page 225 Samples and clinical details, n= 40. N.B. PL012 and PL017
excluded due to technical reasons.
Table 4.3.5 Page 244 Hotspots detected from cfDNA samples.
Table 4.3.6 Page 245 Results from TaqMan Array analysis of paired cfDNA
23
Acknowledgements
The work presented in this thesis would not be possible without the assistance of a very
broad range of people and institutions, who I would like to acknowledge and thank here.
My academic supervisor Prof Ian Cree, whose knowledge and experience are unmatched in
the field of molecular pathology and has been a constant source of advice, guidance, support
and encouragement throughout the project. My second academic supervisor, Dr Anne
Reiman, whose expertise in molecular genetics was invaluable to my supervision, and also
delivered a vast majority of my training in the laboratory, gave me the skills to complete this
project. My additional supervisor, Prof Dimitris Grammatopoulos, who took over as primary
supervisor at the end of the project, was critical to facilitating the completion of the project
at Warwick Medical School.
All laboratory work included in this thesis was performed in the Pathology Department at
University Hospital Coventry and Warwickshire, so I would like to give my heartfelt thanks to
all the staff in the Pathology Department who accommodated me using their laboratory
space during their busy diagnostic schedules. In particular I would like to thank the staff of
the molecular laboratory who were always so accommodating and supportive: Jenifer Nyoni,
Andrew Whitehead, Zandra Woodward, Monika Dutt, Ranveer Chaven, Harriet Pegden,
Sarah Clark (extra thanks for proof reading draft 3 of the thesis manuscript), Steve Hamilton
and Conor Cairns. The molecular laboratory manager, Tina Wotherspoon, was extremely
supportive of our research work and has been instrumental in our assay validations and the
constructing of business cases for ongoing work in the department. The clinical scientists:
Katie Jones, Megan Goddard, Samantha Horridge and Lisa Hodges, were very supportive and
24
Hodges for her continued support and for proof reading the second draft of my thesis
manuscript.
The Arden Tissue Bank was instrumental in obtaining FFPE tissue samples used in this project.
I would to thank Sean James the tissue bank manager for his continued support and
assistance, as well as the other staff, Andrew White and Adrian Fisk.
The Blood Sciences laboratory of the UHCW Pathology Department was essential for
obtaining EDTA blood samples for this project. I would like to thank the Senior BMA, Julie
Evans, as well as Mark Huntley and Carl Young for the huge amount of assistance they gave
me in terms of understanding the systems in Blood Sciences and how to most efficiently
collect the samples.
I would like to thank David Snead (consultant histopathologist) for his support, clinical
expertise, insight and interest in our work during this project. Also in Histopathology I’d like
to thank Peter Smith (clinical scientist) and Dr William Anderson for their assistance in
collecting tissue samples and compiling clinical data. Finally from Pathology, I would like to
thank the Deputy Department Head, Dr Judith Timms, who was very supportive throughout
the project and was instrumental in bringing our developments into diagnostic use.
Outside of the Pathology Department, I’m very grateful to the clinical staff at UHCW who
were instrumental to facilitating the collection of clinical samples for use in this research
project. From the lung clinic, I’d like to thank Dr Judith Drought for her active assistance in
triaging blood samples to Pathology specifically for research use. From the nursing teams, I
would like to thank Lindsay Fitzpatrick, Sam Thomas and Dawn Beaty from the lung nursing
25
inclusion in this project. Without the support of the clinical staff this project would not have
been anywhere near as complete.
This work involved a number of outside collaborators from Industry. At GeneFirst, I would
like to thank CEO Guoliang Fu for initial funding of the project and supply of reagents, as well
as senior scientist Michal Bilski for his advice and assistance during the early development
phase of this project. At Promega, I would like to thank Fiona Marshall for collaborating with
us in the development of the circulating DNA extraction kit, for supplying us with prototype
kits, and for continued technical support and advice. At Thermo Fisher Scientific, I would like
to thank: Marco Rijnen and Freddie Sharkey from the clinical team for their support of our
work; Chris Maddren, Daniel Dancer, Ashley Page and Kicki Bergefall for technical support;
Rachel Holding and Charlie Fuller for arranging discounts on consumables; and finally
particular thanks go to Andy Gaze as our engineer for all the installation, technical support,
troubleshooting and servicing of our sequencing instruments, without whom we’d have
(occasionally) been in real trouble!
Beyond the areas of academia and industry, I would like to thank my family and friends who
have been utterly critical in supporting me during this degree, and without whom the
decision to return to study as a mature student would have been significantly harder. To my
fellow students at Warwick Medical School (too numerous to individually name), thank you
for the support and interest, and for helping me balance work and life.
Finally I’d thank my parents Greer and Koyu Kikuchi, and my brothers Ian and Tom, for their
unwavering support during this very challenging phase of my career, getting to the end
26
Declaration
This thesis is submitted to the University of Warwick in support of my application for the
degree of Doctor of Philosophy. I, Hugh Kikuchi, declare that it has been composed by myself
and has not been submitted in any previous application for any degree and all the research
has been undertaken in accordance with University safety policy and Guidelines on Ethical
Practice.
I am aware of University regulations governing plagiarism and I declare that this document
is all my own work except where I have stated otherwise.
The presented work, including data generation and data analysis, was carried out by the
author except in the cases outlined below:
Tissue sample collection and processing. Tissue samples were collected by UHCW
surgical teams as part of their routine delivery of treatment to lung and colorectal
cancer patients. Tissue samples were processed and fixed by biomedical scientists in
the histopathology laboratory in the UHCW Pathology department. Routine testing
of clinical samples for genetic markers was performed by biomedical scientists in the
molecular laboratory, the results of which were used to select samples for testing
during this project.
Blood sample collection. Blood samples were collected by phlebotomists in the
27
laboratory (specimen reception) in the UHCW Pathology department, where they
were processed and stored by biomedical scientists and biomedical assistants.
Prospective testing of cfDNA samples using the validated TaqMan Array assay in
UHCW Pathology was performed by BMS staff as part of the routine workflow. The
data from these tests are shown in table 3.3.8.
Statistical analysis and selected figures (Chapter 4). Statistical analysis of data
generated in this chapter was analysed by Katherine Lloyd, the statistics expert in
our research group. Katherine wrote the methods text describing the analysis done
(chapter four methods) and also produced the following figures: 4.3.1.1- 5; 4.3.2;
28
List of Publications
Parts of this thesis have been published by the author. The findings from chapter three
were published in the journal Pathogenesis with the following details:
Authors: Hugh Kikuchi 1,2, Anne Reiman 1,2, Jenifer Nyoni 1, Katherine Lloyd 3, Richard
Savage 4, Tina Wotherspoon 1, Lisa Berry 1, David Snead 1,2, Ian A. Cree
1,5,6,*Corresponding Author
Institutions: 1. Department of Pathology – Coventry and Warwickshire Pathology
Services (CWPS), University Hospitals Coventry and Warwickshire, Coventry
CV2 2DX, UK
2. Warwick Medical School, University of Warwick, University Hospitals
Coventry and Warwickshire, Coventry CV2 2DX, UK
3. MOAC DTC, University of Warwick, Gibbet Hill Road, Coventry CV4 7AL,
UK
4. Systems Biology Centre, University of Warwick, Gibbet Hill Road,
Coventry CV4 7AL, UK
5. Institute of Ophthalmology, University College London, Bath Street,
London EC1V 9EL, UK
6. Centre for Technology Enabled Health Research (CTEHR), Faculty of
Health & Life Sciences, Coventry University, Coventry CV1 5FB, UK
Article Title: Development and validation of a TaqMan Array for cancer mutation
analysis
29
Authors: Lesley Uttley, BSc; Helen Buckley Woods, BSc; Hugh Kikuchi, BSc; Anne
Reiman, PhD; Susan Harnan, PhD; Becky L Whiteman, BSc; Sian Taylor
Phillips, PhD; Michael Messenger, PhD; Angela Cox, BA, PhD; Dawn Teare,
BSc, MSc, PhD; Orla Sheils; Jacqui Shaw; Ian A Cree, MBChB, PhD, FRCPath;*
* Corresponding author
Article Title: The evidence base for circulating tumour DNA blood-based biomarkers for
the early detection of cancer
30
Abstract
Background: Lung cancer is the most common cause of cancer death worldwide and is
estimated to account for more than 1,380,000 deaths per year. Lung cancer can be separated
into two major histological types: Small Cell Lung Cancer (SCLC) and Non-Small Cell Lung
Cancer (NSCLC), accounting for approximately 15% and 85% of cases respectively. Epidermal
Growth Factor Receptor (EGFR) is a tyrosine-kinase receptor. In NSCLC EGFR overexpression
is found in over 80% of cases, and EGFR copy number gain (CNG) or amplification is found in
nearly 60% of them. Tumours with EGFR mutations can be treated using anti-EGFR drugs;
however currently genetic analysis has to be performed on tissue which is obtained by
biopsy.
Aims: This project aims to investigate alternative methods of obtaining tumour DNA
for genetic analysis, to potentially improve or support the current diagnostic process.
This project will investigate both new testing methods (molecular assays) and new
sources of tumour DNA (cell free DNA from plasma).
Methods: A number of methods were employed during this project. Initially EGFR and KRAS
mutation detection was attempted using a novel Peptide Nucleic Acid Polymerase Chain
Reaction (PNA-PCR) assay devised by GeneFirst Ltd (Oxford, UK). The second approach
utilised custom designed TaqMan Array 384 well plate assays for the detection of EGFR,
KRAS, NRAS and BRAF mutations. 40 clinical EDTA blood samples were obtained for the
investigation of the use cfDNA for oncogenic mutation detection. Plasma DNA extracted
using two automated platforms (Qiagen EZ1 and Promega Maxwell). The extracted DNA was
31
Results: The GeneFirst novel PNA PCR assays appeared to tolerate low concentration FFPE
DNA samples but had a very high false positive rate and the endogenous control assay failed
regularly (0- 33.3% failure rate over different assay versions). The TaqMan Array assay was
very successful at detecting EGFR, KRAS, NRAS and BRAF mutations from FFPE tissue,
displaying 97.62% and 94.74% concordance with previously used diagnostic assays (Qiagen
Therascreen EGFR RGQ PCR and Thermo Fisher KRAS castPCR). For the automated isolation
of cfDNA, the Promega Maxwell instrument gave consistently superior results to the Qiagen
EZ1. CfDNA was successfully used to detect oncogenic mutations using both PCR and NGS
assays.
Conclusion: This project has utilised a number of approaches in order to investigate new
approaches for the detection of clinically actionable oncogenic mutations, both in FFPE tissue
(obtained through surgery or biopsy) and the relatively new cfDNA analyte. Two PCR
techniques were compared using DNA from FFPE tissue, and the TaqMan Array assay was
shown to be vastly superior. The TaqMan Array was subsequently adopted as the primary
diagnostic assay in UHCW Pathology. CfDNA (despite the limited number of samples) showed
great potential as an alternative for tissue for detection actionable cancer mutations. The
Ion Torrent Next Generation Sequencing system proved to be the most sensitive and
powerful technique of the ones utilised here, and will prove an invaluable asset for future
32
33
1.1 LUNG CANCER
Lung cancer is the most common cause of cancer death worldwide and it is estimated to
account for more than 1,380,000 deaths a year (Ferlay et al., 2010). In the UK the National
Health Service records 39,000 new diagnoses and 35,000 deaths annually (NICE, 2011b).
Amongst these cases a large proportion, approximately 90% (Subramanian & Govindan,
2007), are smoking related, however there is still a significant proportion of lung cancer
patients who are never smokers. This ratio between smokers and former/non-smokers varies
greatly internationally. Gender is also a consideration, as amongst male and female groups
of lung cancer patients the proportion of smokers varies. The 90% figure given previous
generally applies to North America and Europe, where smoking levels are relatively high. In
other areas of world such as Asia, where smoking levels are lower and environmental hazards
are more common, they have a much higher proportion of lung cancer patients who have
never smoked. For example levels of smoking amongst female lung cancer sufferers in Korea
and Hong Kong were previous recorded as 25% (Lee et al., 2000) and 56% (Toh et al., 2004)
respectively- far lower than the North American and European levels. Therefore although
efforts to reduce tobacco use would have a dramatic effect on lung cancer prevalence, there
is still a significant cohort of lung cancers amongst non-smoking patients.
Lung cancer can be separated into two major histological types: Small Cell Lung Cancer (SCLC)
and Non-Small Cell Lung Cancer (NSCLC). SCLC accounts for approximately 13% of lung cancer
worldwide (Woolf et al., 2016). In SCLC the cancer cells contain dense neurosecretory
granules. SCLC may have an endocrine or paraneoplastic syndrome association (Rosti et al.,
2006), and these cancers are often associated with the larger airways (Leslie, 2011). As the
34
cytoplasm. Some suggest that the reduced cytoplasm is caused by damage to the control
mechanisms within the cell that regulate its size (Leslie, 2011).
The other histological type is Non-Small Cell Lung Cancer (NSCLC). This is the more common
type of lung cancer, accounting for approximately 85% of cases worldwide (Ettinger et al.,
2010). In England and Wales NSCLC accounts for 72% (NICE, 2012) of lung cancer cases.
NSCLC can be further classified into three subtypes: adenocarcinoma, squamous-cell lung
carcinoma and large-cell lung carcinoma (Pikor et al., 2013). Adenocarcinoma is the most
common form, making up 40% of all lung cancers. Whilst it is often associated with smoking,
adenocarcinoma is also the most common form of lung cancer amongst never-smokers
(defined as those who have smoked fewer than 100 cigarettes in their life time). Squamous
cell carcinoma accounts for approximately 30% of lung cancers and typically occurs in the
larger airways. Large cell carcinoma makes up about 9% of lung cancers. They are
characterised by large cancer cells, with large and conspicuous nuclei and excess cytoplasm,
and may show keratinisation in some cells.
1.1.1 Diagnosis of Lung Cancer in the UK
Early diagnosis is a critical factor in patient prognosis, as the chances of progression-free
survival (PFS), stable disease (SD), remission and recovery are maximised if diagnosis is
confirmed early and treatment started as soon as possible. As the stage at diagnosis
increases, the likelihood of a favourable outcome for the patient reduces dramatically. The
35
In 2008 the National Awareness and Early Diagnosis Initiative (NAEDI) was launched by the
Department of Health in collaboration with Cancer Research UK (Richards, 2009) to better
inform the public about the symptoms of various cancers including lung, so those showing
symptoms can present themselves to their doctors as early as possible. A recent strategy for
early detection is the UK Lung Cancer Screening Trial (UKLS) which has offered low-dose CT
screening to individuals considered at high risk of developing lung cancer (Field et al., 2016).
In total 1994 individuals were scanned by low-dose CT (computed tomography), resulting in
42 (2.1%) new diagnoses of lung cancer. This trial proposes that routine screening of high
risk individuals may be an efficient means of detecting early disease and cost effective in
terms of treatment. In addition to awareness and early diagnosis, supporting smoking
cessation is another key healthcare priority. The NHS Stop Smoking Services were established
in 1999 (Dobbie et al., 2015) to support those trying to stop smoking.
Some of the symptoms of lung cancer can often be confused with other less severe
conditions, and this may contribute towards late diagnosis in many patients. The main
symptom of lung cancer is haemoptysis, but this is not always the first symptom and thus
not a reliable symptom for early diagnosis. Haemoptysis can be experienced with or without
any of the following other unexplained or persistent symptoms (i.e. lasting longer than three
weeks): cough, chest or shoulder pain, dyspnoea, weight loss, chest signs, hoarseness, finger
clubbing, cervical/ supraclavicular lymphadenopathy and any features of metastasis (for
example in brain, bone, liver or skin)(NICE, 2012).
Upon presenting with any of these symptoms, a suspected lung cancer patient will be
36
onto a lung cancer multidisciplinary team (MDT), and will be offered a contrast-enhanced
Computed Tomography (CT) scan of the chest, liver and adrenals. This is often followed up
with a spirometry to assess fitness for definitive treatment (NICE, 2017). Diagnosis requires
biopsy, which is also important for staging of the disease by histology and cytology. At this
stage the techniques that can be used for confirmation and investigation of the disease
depend greatly on the size and location of the lesion. Obtaining tissue may require
bronchoscopy, endobronchial ultrasound (EBUS)-guided transbronchial needle aspiration or
biopsy, endoscopic ultrasound (EUS)-guided fine needle aspiration or biopsy and
non-ultrasound-guided transbronchial needle aspiration (NICE, 2011b). If surgery is considered,
then Positron-Emission Tomography (PET) is often used to stage patients more accurately.
If biopsy is possible, the collected tissue is fixed in 10% neutral buffered formalin (4%
formaldehyde) and embedded in paraffin wax, producing a Formalin Fixed Paraffin
Embedded (FFPE) block of tissue (Cree et al., 2014). Sections of the tumour block are
mounted onto microscope slides and are analysed by a histopathologist to classify the
tumour and confirm the histology. For patients who are eligible for EGFR mutational analysis
the neoplastic cell content of the sample must be evaluated, and macrodissection may be
performed on the FFPE sample (Cree et al., 2014). This is done to increase the proportion of
37
1.1.2 Treatment of Lung Cancer
Patients with a confirmed diagnosis of lung cancer are offered a number of treatments,
depending on many factors such as the age and general health of the patient, the stage of
the disease and the mutation status of their cancer. Treatment options include:
chemotherapy, targeted molecular therapy, immunotherapy, radiotherapy, surgery. As the
disease stage increases the treatment options become limited. Radiotherapy and surgery are
often not recommended or impossible from stage III onwards as the disease has spread too
far to be effectively targeted, or the patient is too ill to consider them.
Currently there is a large range of chemotherapy agents available to clinicians for lung cancer
treatment. Guidelines for which compounds to use are complex, and as a result choices of
chemotherapy regimen can vary from patient to patient. Standard first line chemotherapy
for NSCLC involves a single third generation drug (docetaxel, gemcitabine, paclitaxel or
vinorelbine) in combination with a platinum drug, such as carboplatin or cisplatin (NICE,
2011b). The treatment may be changed to monotherapy depending on the patients’
tolerance of the combination treatment. For patients with EGFR mutation positive NSCLC,
then the tyrosine kinase inhibitors (TKIs) gefitinib and erlotinib are recommended for first
line treatment, with newer EGFR inhibitors reserved for relapse or de novo T790M mutation
(NICE, 2011b). For Patients with EGFR mutation negative NSCLC, pemetrexed in combination
with cisplatin is the recommended first line chemotherapy for adenocarcinomas. For SCLC
cisplatin or carboplatin are often given either as a monotherapy or in combination with
etoposide (Kalemkerian et al., 2013). The advent of immunotherapy with anti-PDL1 antibody
drugs is changing the outlook for lung cancer patients (Lee & Chow, 2014) and may even
38
and extent of side effects and the tumour response must be closely monitored, and
treatment adjusted accordingly if necessary.
1.2 INTRODUCTION TO COLORECTAL CANCER
Colorectal cancer (CRC) is the second most common form of cancer in women and third most
common cancer in men worldwide (El Zoghbi & Cummings, 2016), making CRC the third most
common cancer and the fourth most common cause of cancer death worldwide (Favoriti et
al., 2016). In the UK every year there are approximately 40,000 new cases (41,112 cases
2013, Cancer Research UK) and approximately 16,000 deaths (16,187 cases 2012, Cancer
Research UK). There are a number of lifestyle risk factors associated with developing CRC
including: high BMI, lack of physical activity, red/ processed meat consumption, alcohol
intake and smoking (Johnson et al., 2013). There is considerable variation in the rates of CRC
globally, with approximately 55% of cases occurring in the more economically developed
countries (Ferlay et al., 2015). This is mostly likely due to associated lifestyle factors.
Despite the high prevalence of CRC, it also one of the most preventable cancers due to the
fact it largely arises from benign lesions (either tubular adenomas or serrated polyps) which
later develop into cancers (Grady & Markowitz, 2015). It can take many years for benign
adenomas or polyps to become CRC, which provides a considerably larger diagnostic window
than many other types of cancer. Therefore one important challenge for CRC prevention is
to maximise awareness of symptoms so patients present themselves to their healthcare
39
so that fecal occult blood testing is the basis of increasingly successful screening programmes
for CRC (HQO, 2009).
The transformation of a benign polyp to colorectal cancer has been studied extensively. A
summary of the process is shown in figure 1.2.1, adapted from (Fearon & Vogelstein, 1990).
There are a number of genetic alterations that occur during the transformation of a benign
polyp into a cancerous lesion. The exact sequence and genes involved varies from case to
case, which highlights the need for genetic analysis of tumour DNA during clinical
management. Typically the original benign lesion is engulfed by the transformed tumour,
however in a small proportion of cases part of the original lesion remains, referred to as the
residual polyp of origin (RPO). A logical question in this situation is: are tumours that still
contain the original polyp (CRC RPO+) biologically, genetically or clinically different to
tumours where there is no residual polyp (CRC RPO-)? This raises the concern that current
models (based on CRC RPO- tumours) is not an accurate representation of benign to CRC
transformation. In a recent study by Druliner et al. (Druliner et al., 2016) 10 RPO+ colorectal
cancer samples (CRC RPO +) were obtained and analysed by whole genome sequencing
(WGS) and RNA sequencing, and compared to a panel of CRC RPO- tumours. Their analysis
revealed that CRC RPO+ tumours are indistinguishable from CRC RPO- tumours. This shows
40
Figure 1.2 Diagram of the major steps involved in benign to CRC transformation, adapted from (Fearon & Vogelstein, 1990). Horizontal arrows show disease progression, vertical arrows and text boxes show the genes typically involved with each stage of disease progression.
1.2.1 Diagnosis of Colorectal Cancer
The four main symptoms of colorectal cancer are abdominal pain, change in bowel habits,
loose stools and blood in stools. Upon presentation, investigation will consist of a number of
different techniques, including: colonoscopy, sigmoidoscopy with barium enema, CT
colonography, or flexible sigmoidoscopy with barium enema (NICE, 2011a). The investigative
method used depends on the health of the patient and location of the tumour. If a tumour
is identified by either colonoscopy or sigmoidoscopy this will be followed by biopsy for
histological classification and genetic analysis. Methods for staging the disease after
diagnosis include: contrast-enhanced CT of the chest, abdomen and pelvis; magnetic
41
1.2.2 Treatment of Colorectal cancer
For non-metastatic/ local disease, treatment options include chemotherapy (e.g.
capecitabine and oxaliplatin), radiotherapy, chemoradiotherapy and surgery (either
laparoscopic or open resection). In the event of colonic obstruction, other measures may
need to be employed such as applying colonic stents. The exact choice of treatment is
typically decided on a case by case basis by the local MDT.
For metastatic disease, treatment frequently involves combination chemotherapy such as
oxaliplatin and irinotecan in combination with fluoropyrimidines, or capecitabine and tegafur
with uracil (NICE, 2011a). Surgery is considered where possible. Biological agents are also
used to treat advanced CRC, including Bevacizumab (VEGF-A inhibitor) or Cetuximab (EGFR
inhibitor). Sometimes these agents are combined with chemotherapy agents like oxaliplatin.
Another consideration for metastatic disease are secondary tumours, which need to be
assessed my MRI or PET-CT and treated as decided by the local MDT.
1.3 GENETIC BASIS OF CRC AND NSCLC
Mutations in the EGFR-RAS pathway are common to both CRC and NSCLC, though they differ
42
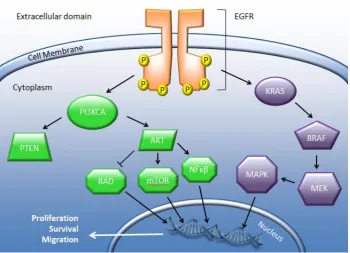
Figure 1.3 Summary of the EGFR and KRAS signalling pathway. Upon activation by its ligand, EGFR initiates a signalling cascade resulting in gene expression in the nucleus, driving the cell towards proliferation, survival and migration.
1.3.1 EGFR
Epidermal Growth Factor Receptor (EGFR) is a tyrosine-kinase receptor from the Human
Epidermal Growth Factor Receptor (HER) family of receptors. EGFR is sometimes
alternatively referred to as ErbB-1 or HER1. It is a cell surface receptor protein that is
constitutively activated by a range of ligands including EGF and TGFα. The HER family of
tyrosine-kinase receptors are involved in a number of cellular processes including
development, proliferation and survival; all of which are essential for normal cell function,
43
The other members of the HER family are HER2 (also called CD340, HER2/neu or ErbB2),
HER3 (ErbB3) and HER4 (ErbB4). HER2 is similar to EGFR (HER1) as it can heterodimerise with
any of the other HER family proteins. In contrast to other HER family proteins, HER2 has no
ligand, but heterodimerises with other HER proteins to form active complexes. Amplification
of the ERBB2 gene are found in 15-30% of breast cancers (Mitri et al., 2012). HER3 lacks signal
transduction capability in a homodimer, but forms active complexes with other HER proteins.
HER4 is a single-pass type I transmembrane protein, activated by heparin-binding EGF-like
growth factor, betacellulin and neuregulins (NCBI, 2017).
Upon ligand binding EGFR dimerises to form either a homodimer (with another EGFR
molecule) or a heterodimer with a related receptor from the HER family (HER2, HER3 or
HER4). After dimerisation EGFR autophosporylates tyrosine residues which cause the
activation of two main downstream signalling pathways: RAS/MAPK and PI3K/ AKT
(Koudelakova et al., 2013). These pathways lead to the cellular processes involved in
proliferation and survival (Arteaga, 2003). In normal tissue, these pathways would be
activated in the normal regulated manner i.e. cells responding to a biological stimulus. In
cancer however, EGFR has often been found to contain activation mutations or to have an
increased copy number. In NSCLC EGFR overexpression is found in over 80% of cases, and
EGFR copy number gain (CNG) or amplification is found in nearly 60% of them (Koudelakova
et al., 2013). Increased EGFR activation was previously considered a poor prognostic marker
(Hirsch et al., 2003), however a later meta-analysis did not confirm the prognostic
44
The most clinically useful aspect of determining the mutational status of EGFR in NSCLC is in
assessing how well a patient will respond to tyrosine-kinase inhibitors therapy. The key
activating mutations that occur in EGFR are exon 21 L858R and exon 19 deletions, which
account for approximately 90% of pathogenic mutations (Sholl et al., 2010). Other
pathogenic mutations are exon 20 insertions and the (also exon 20) T790M anti-EGFR
resistance mutation (Sharma et al., 2007). Being able to detect these specific activating and
resistance mutations give clinically actionable information for patient management.
Conversely in CRC, KRAS mutations have been found to confer resistance to anti-EGFR
therapy (Tan & Du, 2012).
1.3.2 KRAS
Kirsten Rat Sarcoma viral oncogene homolog (KRAS, also known as V-Ki-ras2 Kirsten rat
sarcoma viral oncogene homolog) is a gene located on human chromosome 12 and encodes
the KRAS protein (McGrath et al., 1983). The KRAS protein is a GTPase and thus performs a
major role in cell processes such as cell growth, apoptosis and differentiation (Shields et al.,
2000). KRAS acts as a molecular on/ off switch, in its GTP-bound form it is active, inducing
multiple signalling pathways, and in its GDP-bound form it is inactive. It forms an essential
step in many signal transduction pathways downstream of cytokines such as EGF, including
C-Raf (Li et al., 2000), PIK3CG (Rubio et al., 1999), MAPK (Vojtek & Der, 1998) and STAT
(Vojtek & Der, 1998). The RAS genes were first discovered during the 1960s through research
into cancer-causing retroviruses in animals. Experiments using mouse leukaemia viruses
45
using human cancer cell lines identified human homologs of the rat KRAS genes (Pulciani et
al., 1982).
The fact that KRAS was rapidly identified as an oncogene reflects its significant role in many
human cancers. Activating KRAS mutations are known to occur in many human malignancies,
including approximately 90% of pancreatic cancers, approximately 30% of lung cancers,
approximately 60% of thyroid, and approximately 43% colorectal carcinomas (Shackelford et
al., 2012). KRAS is downstream of EGFR, and once EGFR becomes activated GTP bound KRAS
will activate its wide range of downstream effectors. Mutations causing constitutive
activation of KRAS are all point mutations and occur in codons 12 and 13 of exon 2, codon 61
of exon 3, and 117 and 146 of exon 4 (Rajalingam et al., 2007; Cree, 2016b; Cree, 2016a;
Sorich et al., 2015). Constitutive activation of KRAS means that all its downstream signalling
pathways remain active, giving rise to uncontrolled cell growth and replication, resulting in
malignancy.
In NSCLC, KRAS mutation most commonly occurs in adenocarcinomas. As yet there has been
no clear relationship established between KRAS mutation and smoking history, unlike EGFR
mutations which tend to be more common in non-smokers. As KRAS is downstream of EGFR,
activating mutations in KRAS have been shown to result in resistance to anti-EGFR therapy
(Shackelford et al., 2012). No RAS mutation dependent therapeutics have yet entered
practice. Therefore KRAS testing in NSCLC is useful to ensure patients are being treated with
the most appropriate regimen and to avoid unnecessary ALK (Anaplastic Lymphoma Kinase)
46
detection of KRAS mutations would still be extremely valuable for early diagnosis and patient
management.
1.3.3 Other significant genes in the EGFR/ KRAS pathway
Neuroblastoma RAS viral oncogene homolog (NRAS), like KRAS, is a member of the RAS gene
family. The RAS family are group of GTPases that are involved in a number of pathways
regulating cell proliferation, differentiation and apoptosis (Prior & Hancock, 2012). All cells
contain three RAS isoforms: KRAS, NRAS and HRAS (Harvey Rat Sarcoma Virus). NRAS was
first discovered in 1982 by scientists led by Robin Weiss at the Institute of Cancer Research
(Marshall et al., 1982).
The three RAS isoforms share a high degree of sequence homology: 100% homology for a
majority of the sequence, with the C-terminal 23-24 amino acids making up the
hypervariable region (HVR). This HVR has been shown to be important for the RAS protein
membrane interactions and localisation within the cell (Prior & Hancock, 2012) and thus is
the most likely explanation for functional and localisation differences between the various
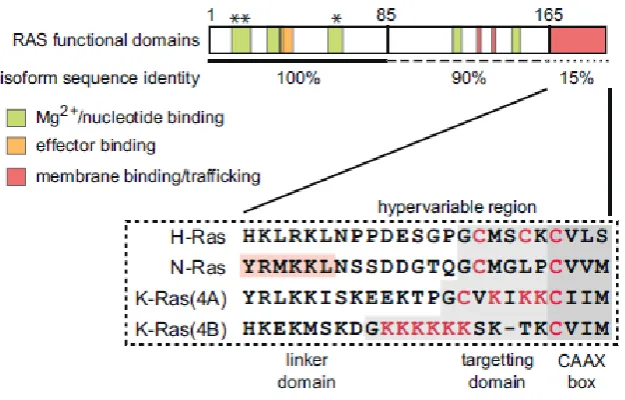
isoforms. Figure 1.3.3 shows a diagram of the RAS protein and the degree of homology
47
Figure 1.3.3 Diagram of RAS functional domains and differences between isoforms. HVR is post-translationally modified to enable membrane interactions and differential localisation. Asterisks indicate oncogenic mutation sites and codons 12, 13 and 61. Adapted from (Prior & Hancock, 2012).
In the context of cancer, the contribution of NRAS is analogous to the mechanism of KRAS
(described earlier). NRAS is most commonly found to be mutated in melanoma, where 20%
of cases carry activating mutations in NRAS (Milagre et al., 2010). It was the first oncogene
to be identified in melanoma in 1984 (Albino et al., 1984). By comparison, NRAS mutations
are generally found at low abundance in lung and colon cancers. This may be due to NRAS
being overexpressed in melanocytes compared to the other isoforms, and therefore it is
more susceptible to mutation in this tissue type. Clinically the presence of an activating NRAS
mutation is associated with a poorer prognosis (Devitt et al., 2011). Interestingly there is
some evidence that the presence of an NRAS mutation may have some correlation with a
better treatment response to high dose IL(interleukin)-2 compared to those with wild-type
NRAS (Fedorenko et al., 2013). At present there are no treatments that specifically target
NRAS, although are a number are in development. Current clinical trials are largely focused
48
phosphatidylinositol-3-kinase (PI3K), aiming to attenuate the upregulation caused by the
NRAS mutation (Russo et al., 2014).
The final gene which will be described in this section is BRAF, also known as proto-oncogene
B-Raf or v-Raf murine sarcoma viral oncogene homolog B. It is a member of the Raf family of
signal transduction protein kinases (NCBI, 2016) which are involved in directing cell growth.
The BRAF protein consists of 766 amino acids, separated into three domains which are
referred to as Conserved Regions (CR) 1-3. Each region is functionally different, with CR1,
CR2 and CR3 containing the Ras-GTP binding domain, serine-rich hinge region and protein
kinase domains respectively (Daum et al., 1994) (Cutler et al., 1998). BRAF mutations are the
most commonly identified in melanoma, accounting for approximately 50% of cases (Davies
et al., 2002).
Over 90% of cutaneous melanoma samples with BRAF mutations contain a substitution of
valine to glutamic acid at codon 600, p.V600E (Davies et al., 2002). The high frequency and
consistency of mutations in BRAF make it an attractive target for therapy. At present there
are two main inhibitors used for treating BRAF positive melanoma in clinical trials:
vemurafenib (Zelboraf) and dabrafenib (Tafinlar) (Wood & Luke, 2016). They were shown to
be effective at treating BRAF positive melanoma, although there are a number of side effects
associated with the toxicity. Another issue with these compounds is they often caused the
patients to develop squamous cell carcinomas of the skin (potentially due to paradoxical
hyper-activation of the MAPK pathway in wild-type cells), so combination therapy (an
anti-BRAF inhibitor combined with a MEK inhibitor) is likely to be further investigated as the
optimal treatment regimen (Carlos et al., 2015). Vemurafenib and dabrafenib are currently
49
As with EGFR and KRAS described earlier, NRAS and BRAF are very important targets for
characterising patient tumours and identifying the most appropriate treatment option.
Whilst NRAS and BRAF are not the primary focus of this investigation, detection of these
genes will be included at certain phases in order to demonstrate that devising accurate
molecular techniques can be easily expanded or customised to be appropriate for a wider
clinical context.
1.4 NICE GUIDELINES FOR EGFR TESTING IN NSCLC
The National Institute for Health and Care Excellence (NICE) is a UK based organisation that
works to create universal comprehensive guidelines and regulations for many aspects of
Medicine and Science, with an aim to maximise patient safety and therapeutic effectiveness.
Whilst it primarily provides guidance for UK government bodies, the National Health Service
and UK Pharmaceutical companies, it also has a large influence internationally. In the UK a
majority of healthcare practices design their best practice guidelines to NICE regulations
(https://www.nice.org.uk/).
NICE has produced comprehensive guidelines for treatment of lung cancer (described earlier)
and also for the use of EGFR mutation detection in NSCLC. Clinical trials have shown that lung
cancer patients who are positive for EGFR activation mutations respond better to tyrosine
kinase inhibitor therapy compared to treatment with standard chemotherapy (Hagiwara &
Kobayashi, 2013). Therefore it is logical that all patients with NSCLC be tested for EGFR
50
significant influence on clinical management choices made by their attending physician,
ultimately leading to an improved outcome from more appropriate therapy.
The procedure for testing for EGFR mutations in NSCLC in UK diagnostic laboratories is not
standardised, and there is some variation in the methods used. The methods for testing for
EGFR mutations can be divided into two key types: targeted mutant detection and mutation
screening. With targeted methods, only known mutations are analysed, whereas with
mutation screening all known and novel variants are screened for. Many laboratories use
both of these types of method for EGFR mutant detection. NICE has evaluated many tests
currently in diagnostic use in NHS laboratories. Each is summarised in sections 1.4.1 – 1.4.8.
1.4.1 Qiagen™ Therascreen EGFR RGQ PCR Kit
This is a real-time PCR assay that detects 29 EGFR mutations (for full list, see section 2.2.6.1).
The test first requires DNA to be extracted from FFPE samples using the QIAamp DNA FFPE
Tissue Kit, and then a control assay needs to be performed to quantify the total extracted
DNA. The Therascreen PCR can then be performed to detect EGFR mutants in the sample. To
detect the mutant, the Therascreen PCR uses two technologies: Amplification Refractory
Mutation System (ARMS) for specific amplification of the mutants; and Scorpions for
detection of the amplified regions. For diagrams of the Scorpion-ARMS technology, see