34
A Novel ANFIS based Algorithm for Fault Detection in
Power Transformers
Amrinder Kaur
Research Scholar
I.K.Gujral Punjab Technical
University, Kapurthala
Yadwinder Singh Brar,PhD
Departement of Electrical
Engineering, I.K.Gujral Punjab
Technical University,
Kapurthala
Leena G., PhD
Dept.of Electrical and
Electronics Engineering
Manav Rachan International
Institute of Research and
Studies
ABSTRACT
Power Transformers are important parts of the power distribution network, used to change voltages level for transmission between sub stations and electricity consumers. Power Transformers are prone to failure due to general ageing of parts, which can lead to high replacement costs. It not only interrupts the supply of electricity, but can cause explosion and potentially halting the power network. Dissolved Gas Analysis (DGA) is a reliable technique for detecting the presence of incipient fault conditions in oil immersed transformers in which the presence of certain key gases is monitored. In this paper a novel algorithm based on ANFIS (Adaptive Neural And Fuzzy Inference System) using different fuzzy membership function is proposed and it is validated on DGA data obtained from PSTCL (Punjab State Transmission Corporation Ltd.) located at Patiala & Ludhiana. The key gases considered are hydrogen, methane, ethane, ethylene, acetylene..
General Terms
Fuzzy Logic,ANFISKeywords
Power Transformer, DGA, ANFIS, Fault Diagnosis.
1.
INTRODUCTION
Mineral oils contain many different hydrocarbon molecules. They consist of essentially of saturated hydrocarbon called paraffin whose general molecular formula is Cn H2n+2 with n the range of 2 to 40. The mineral oil acts as a dielectric medium as well as a heat transfer agent. The decomposition of electrical insulating materials and related components inside the transformer generates gases within the transformer. The amount of these gases can be related to the type of electrical fault, and the rate of gas generation can indicate the severity of the fault. The type of the gases being generated by a particular unit can provide useful information in any preventive maintenance program. There are several techniques in detecting fault gases and DGA is recognized as the most informative method. This method is based on sampling of the oil to measure the concentration of the dissolved gases. There are several methods developed to do the interpretation of the fault type from the dissolved gases data. The gas ratios are evaluated by using different method such as Dornenberg method [4], Roger's Ratio Method [3], Key Gases Method [5, 6], and Duval Triangle Method [7] as well as the recently developed techniques such as neural network and fuzzy logic. All the above techniques depend upon the ratios of gases evolved during the testing of the power transformer. The conventional DGA schemes have the following limitations:
1. Gas ratios or methods defined by these schemes are mainlydeveloped based on human judgment. No systematicattempt has been made to actually ‗learn‘ from the measured DGA data.
2. There is still a high degree of inconsistency and ambiguitywhen applying these schemes, owing to incompleteness ofthe possible ratiocombinations and doubts on the validity of the defined ratio ranges.
3. These schemes are still unable to detect with high confidence multiple faults, which occur concurrently within the transformer.
4. These schemes are unable to detect new or unknown faultsowing to the lack of expert knowledge in them.
5. In order to apply these methods, first calculation of gas ratios and then code depending upon ratio are used to find the fault instead of direct reading of gas concentration. Though key gas ratio method [5, 6] is used to find fault in the transformer but it is not able to identify all the faults as obtained by other methods.
The application of Artificial Intelligence (AI) techniques has largely improved transformer condition monitoring and assessment in recent years [13]-[17]. Decision-making context for power transformer fault detection problems involves vague, imprecise or incomplete knowledge and information. The Artificial Intelligence techniques are replacing the human interface for Power Transformer Fault detection, giving rise to concepts of automated diagnosis. Many practical transformer operation problems can now be solved by AI-based condition monitoring and assessment systems. In this paper, a novel algorithm based upon ANFIS using different fuzzy membership function is proposed for predicting the fault based upon gas concentration. The paper is organized as follows Section-2 gave a brief description about ANFIS and its structure. Section-3 defines the problem statement. Section-4 gave the results and discussions and Section-5 explains conclusion.
2.
ANFIS
35 powerful tool for information representation and processing.
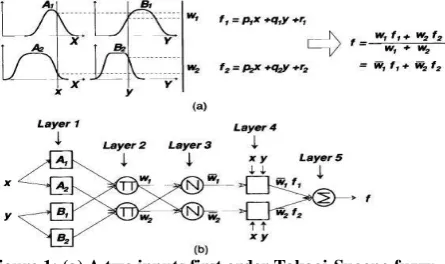
The power of fuzzy logic is most evident during the operation and inference stages of a process, deriving new results which then provide progressively more precise information about the actual condition of equipment. On the other hand Adaptive network is a superset of all kinds of feedforward neural networks with supervisory learning capability. An adaptive network, as the name implies is a network structure consisting of nodes and directional links through which nodes are connected. Moreover, parts or all of the nodes are adaptive, which implies that their outputs depend on the parameters corresponding to these nodes. An adaptive neuro-fuzzy inference system or adaptive network-based fuzzy inference system (ANFIS) is a kind of artificial neural network created on Takagi– Sugeno fuzzy inference system. The technique was developed in the early 1990s. Since it integrates both neural networks and fuzzy logic principles, it has potential to capture the benefits of both techniques in a single framework. Its inference system corresponds to a set of fuzzy IF–THEN rules that have learning capability to approximate nonlinear functions.Hence, ANFIS is considered to be a universal estimator to integrate the best features of Fuzzy Systems (FS) and Neural Networks (NN): II.a ANFIS Structure For simplicity, it is assumed that the fuzzy inference system under consideration has two inputs and one output. The rule base contains the fuzzy if-then rules of Takagi and Sugeno‘s type as follows: If x is A and y is B then z is f(x,y) where A and B are the fuzzy sets in the antecedents and z = f(x, y) is a crisp function in the consequent. Usually f(x, y) is a polynomial for the input variables x and y. But it can also be any other function that can approximately describe the output of the system within the fuzzy region as specified by the antecedent. When f(x,y) is a constant, a zero order Sugeno fuzzy model is formed which may be considered to be a special case of Mamdani fuzzy inference system [8] where each rule consequent is specified by a fuzzy singleton. If f(x,y) is taken to be a first order polynomial a first order Sugeno fuzzy model is formed. For a first order two rule Sugeno fuzzy inference system, the two rules may be stated as:
Rule 1: If x is A1 and y is B1 then f1 = p1x + q1y + r1 Rule 2: If x is A2 and y is B2 then f2 = p2x + q2y + r2 Here type-3 fuzzy inference system proposed by Takagi and Sugeno [8] is used. In this inference system the output of each rule is a linear combination of the input variables added by a constant term. The final output is the weighted average of each rule‘s output.
Figure 1: (a) A two inputs first order Takagi-Sugeno fuzzy model with two rules; (b) The equivalent ANFIS
architecture.
The individual layers of this ANFIS structure are described below:
Layer 1: Every node i in this layer is adaptive with a node function
𝑂𝑖1=μAi (x) (1)
where, x is the input to node i, Ai is the linguistic variable associated with this node function and μAi is the membership function of Ai . Usually μAi (x) is chosen as
μAi (x) = 1[1+(𝑥−𝑐𝑖𝑎𝑖)2]𝑏𝑖 (2) i = 1, 2
Where x is the input and {ai ,bi , ci} is the premise parameter set.
Layer 2: Each node in this layer is a fixed node which calculates the firing strength Wi of a rule. The output of each node is the product of all the incoming signals to it and is given by,
𝑂𝑖2=𝑊𝑖=μAi(x)×μBi(y ) (3) i = 1, 2
Layer 3: Every node in this layer is a fixed node. Each ith node calculates the ratio of the ith rule‘s firing strength to the sum of firing strengths of all the rules. The output from the ith node is the normalized firing strength given by,
𝑂𝑖3=𝑊𝑖𝑊1+𝑊2 (4) i = 1, 2
Layer 4: Every node in this layer is an adaptive node with a node function given by
𝑂𝑖4=𝑊𝑖𝑓𝑖=𝑊𝑖(𝑝𝑖𝑥+𝑞𝑖𝑦+𝑟𝑖) (5) i = 1, 2
Where Wi is the output of Layer 3 and {pi , qi , ri} is the consequent parameter set.
Layer 5: This layer comprises of only one fixed node that calculates the overall output as the summation of all incoming signals, i.e.
𝑂𝑖5=overall output=ΣWifiΣWi (6) i = 1, 2
Thus this is an adaptive network which is functionally equivalent to a type-3 fuzzy inference system. Figure 1 shows a 2-input, type 3 ANFIS.
3.
PROBLEM STATEMENT
[image:2.595.61.284.567.699.2]36
4.. RESULT & DISCUSSION
:Membe
r-ship
function
Equation
Curve
Triangu
lar
𝑓 𝑎, 𝑏, 𝑐, 𝑑 = 𝑚𝑎𝑥 min
𝑥 − 𝑎
𝑏 − 𝑎
,
𝑐 − 𝑥
𝑐 − 𝑏
, 0
,
Where parameter ‗a ‗and ‗c locate the feet of the triangle and parameter d
locate the peak of the triangle.
Trapezo
idal
𝑓 𝑥; 𝑎, 𝑏, 𝑐, 𝑑 = 𝑚𝑎𝑥 min
𝑥 − 𝑎
𝑏 − 𝑎
, 1,
𝑑 − 𝑥
𝑑 − 𝑐
, 0
Where parameter a and d locate the feet of the triangle and b & c are
shoulder of the function
Gaussia
n
𝑓 𝑥; 𝜎, 𝑐 = 𝑒
−(𝑥−𝑐)2 2𝜎2
Where parameter ‘c denotes distance from origin and
𝜎
denotes width of
curve . in case of Gaussian 2 membership function there are two curves
having values (
𝜎
1, c1 )And (
𝜎
2,c2 )where c1<c2.
GBell
𝑓 𝑥; 𝑎, 𝑏, 𝑐, 𝑑 =
1
1 +
𝑥 − 𝑐
𝑎
2𝑏Where b is always positive,c locates the center of curve and a shows the
width of the curve.
Sigmoi
dal
𝑓 𝑥; 𝑎, 𝑐 =
1
1 + 𝑒
−𝑎(𝑥−𝑐)This work elaborates on a tool that incorporates Artificial Intelligence methods for making a comprehensive analysis of dissolved gases in transformer oil. The primary motivation for the work is to provide a platform for analysis of dissolved gases to help in the early detection and diagnosis of transformer faults. The idea is to provide the user with a wide variety of options in analyzing a fuzzy situation which may arise because of different interpretations that shall be provided by different traditional analysis methods. This work is carried out with assistance from PSTCL (Punjab State Transmission Corporation Ltd.) in the form of required transformer analysis data.
Initially the system is trained using a data set which contains around 106 data inputs which has different types of gases evolved during faults. This data is essential in the generation
and training of the ANFIS from the basic fuzzy structure. ANFIS has around 243 rules derived from the basic fuzzy structure. The ANFIS model structure that is generated for the analysis is given below:
ANFIS info:
Number of nodes: 524
Number of linear parameters: 243
Number of nonlinear parameters: 60
Total number of parameters: 303
Number of training data pairs: 106
37
TABLE:1
Number of fuzzy rules: 243
Table:2 describe the equation and shapes of different membership function used in this paper Fig 2 to 9 shows the training error and testing error using different member ship functions.
Fig.2:Training error and testing error using triangular membership function
Fig3: Training error and testing error using trapezoidal membership function
38
Fig.5: Training error and testing error using Gauss MF
Fig.6: Training error and testing error using Sig MF
39
Fig.8: Result using Psig membership
Fig.9: Result using GBell Membership function Function membership Comparison Table 3:
S.No Membership function
Trimpmf Trapzmf Gbellmf Gaussmf Gauss2mf Sigmf Dsigmf Psigmf Training Error 0.520661 0.543274 0.530661 0.510882 0.560929 0.603841 0.56946 0.56946
Testing/Checking Error
12.3074 0.943491 7.22034 9.47727 6.10404 3.00496 3.27937 3.28228
From the Table 3, ―It is clear that error using Trapezoidal membership function is less as compared to other membership functions‖.
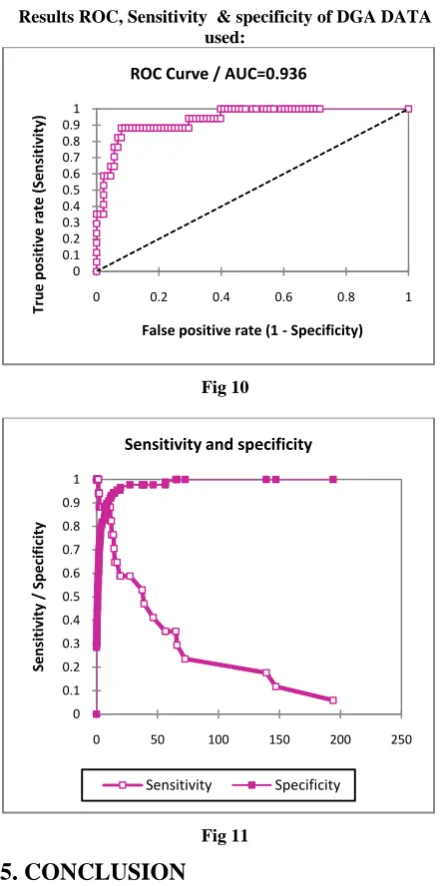
ROC (Receiver Operating Curve) Analysis of the test:
Further to validate the test data ROC curve of the data is plotted.[28]
The plot of sensitivity versus (1-specificity) across varying cut-offs generates a curve in the unit square called an ROC (Receiver Operating Curve) curve. The slope of an ROC curve at any point is equal to the ratio of the two density functions describing, respectively, the distribution of the separator variable in the Faulty and no-fault. The area under the curve (AUC) summarizes the entire location of the ROC curve rather than depending on a specific operating point). The AUC is an effective and combined measure of sensitivity and specificity that describes the inherent validity of diagnostic test.
However, no diagnostic test is perfect. If the diagnostic test indicates the presence of fault in a transformer who actually has no such fault, the test result is false positive (FP). Similarly, if the result of the diagnosis test suggests that the fault is absent for a transformer with fault for sure, the test result is false negative (FN). Both false positive and false negative indicate that the test results are opposite to the actual condition. Sensitivity, specificity and accuracy are described in terms of TP, TN, FN and FP. if the result of the diagnosis test suggests that the fault is absent for a transformer with fault for sure, the test result is false negative (FN). Both false positive and false negative indicate that the test results are opposite to the actual condition. Sensitivity, specificity and accuracy are described in terms of TP, TN, FN and FP.
40 Specificity = TN/ (TN + FP) = (Number of true negative
assessment)/(Number of all negative assessment)
Accuracy = (TN + TP)/(TN+TP+FN+FP) = (Number of correct assessments)/Number of all assessments)
Table 4: Accuracy classification by AUC for a diagnostic test[29,30]
AUC Range Classification 0.9 < AUC < 1.0 Excellent
0.8 < AUC < 0.9 Good 0.7 < AUC < 0.8 Worthless 0.6 < AUC < 0.7 Not good
[image:7.595.54.275.217.661.2]Results ROC, Sensitivity & specificity of DGA DATA used:
Fig 10
Fig 11
5. CONCLUSION
We can conclude that the proposed method is able to detect various fault in transformer based upon gas input instead of ratios. In ratio method the ratio of gases are formulated, then correlated to code and from the code again fault is identified. In this proposed method the gas inputs are used to find out faults and thus the intermediate three steps are avoided and hence lesser calculation as compared to ratios methods. Also the data is validated with ROC analysis from which the area under ROC Currve is .93 which comes under excellent range in any diagnosis test.
6.
REFERENCES
[1]
IEEE Guide for the Interpretation of Gases Generated in Oil-Immersed Transformers, IEEE Standard C57-104TM -2008,[2] Mineral Oil Impregnated Equipments in Service—Guide to the Interpretation of Dissolved and Free Gases Analysis, IEC Publication 60599, Mar. 1999.
[3] IEEE Guide for the Interpretation of Gases Generated in Oil-Immersed Transformers (2009), IEEE Standard C57.104,.
[4]Dornenburg E, Strittmatter W(1974). ―Monitoring oil-cooled transformers by gas analysis‖. , 61:238–247.
[5]IEEE guide for the Interpretation of Gases Generated in Oil-Immersed Transformers (1991), ANSI/IEEE std.C57.104,.
[6] J. J. Kelly(1980), ―Transformer fault diagnosis by Dissolved-Gas Analysis‖, IEEE Trans. Industry Applications, Vol. 16, No. 6, pp.777-782,.
[7] M. Duval and A. DePabla(2001), ―Interpretation of gas-in-oil analysis using new IEC Publication 60599 and IEC TC 10 Databases,‖ IEEE Electr.Insul.Mag., 7:31–41,.
[8]Jyh-Shing Roger Jang(1993), "ANFIS-Adaptive –network-based fuzzy inference system ", IEEE Trans. on Systems, Man and Cybernetics Vol. 23, No.3, pp 665-685. [9] M. Duval (2008), ―The duval triangle for load tap
changers, non-mineral oils and low temperature faults in transformers‖, IEEE Electr.Insul.Mag. 24 No. 6, pp. 22-29.
[10]Hasmat Malik, Surinder Singh, Mantosh Kr, R.K. Jarial,(2011) ― UV/VIS Response Based Fuzzy Logic for Health Assessment of Transformer Oil‖, Elsevier/Science Direct Procedia Engineering, 30: 932-939.
[11]Li-Jung Chen, Ta-PengTsao, Yu-Hsun Lin Dept. of Electr. Eng., Nat. Sun Yat-Sen Univ., Kaohsiung, Taiwan(2005), ―New diagnosis approach to epoxy resin transformer partial discharge using acoustic technology, ―IEEE Transactions on Power Delivery pp. 2501 – 2508
[12]Tapsi Nagpal , Yadwinder Singh Brar(2014),‖ Artificial neural network approaches for fault classification: comparison and performance‖, Neural Comput & Applic DOI 10.1007/s00521-014-1677-y
.[13] Ivan N . da Silva , Carlos G . Gonzales, Rogério A . Flauzino, Paulo G . da Silva Junior , Ricardo A . S. Fernandes, Erasmo S. Neto, Danilo H. Spatti and José A. C. Ulson(2012), ―Intelligent Systems for the Detection of Internal Faults in Power Transmission Transformers‖, ―Advances in Expert Systems,‖ Edited by PetricaVizureanu, ISBN 978-953-51-0888-7 ,Publisher: InTech,
[14] Mohammadi, E. ;Niroomand, M. ; Rezaeian, M. ; Amini, Z.(2009) , ―Partial discharge localization and classification using acoustic emission analysis in power transformer‖, Telecommunications Energy Conference,. INTELEC 2009.E-ISBN : 978-1-4244-2491-7 Print ISBN: 978-1-4244-2490-0
[15] Cristina CIULAVU, Elena HELEREA(2008)., ―Power Transformer Incipient Fault Monitering‖, Annals of the
0 0.1 0.2 0.3 0.4 0.5 0.6 0.7 0.8 0.9 1
0 0.2 0.4 0.6 0.8 1
Tru e positi ve rate (Sensitivi ty)
False positive rate (1 - Specificity) ROC Curve / AUC=0.936
0 0.1 0.2 0.3 0.4 0.5 0.6 0.7 0.8 0.9 1
0 50 100 150 200 250
Sensitivi
ty /
Speci
fic
ity
Sensitivity and specificity
41 University of Craiova, Electrical Engineering series, No.
32
[16]Hasmat Malik, Amit Kumar Yadav, Sukumar Mishra, TarkeshwarMehto(2013), ―Application of neuro-fuzzy scheme to investigate the winding insulation paper deterioration in oil-immersed power transformer‖, Electrical Power and Energy Systems 53,pp. 256–271, [17]Hongsheng Su(2007), ―An ANFIS-based Transformer
Insulation Fault Diagnosis Method Using Emotional Learning‖, Published in: • Proceeding ICNC '07 Proceedings of the Third International Conference on Natural Computation - Volume 01, pp. 74-78 ISBN:0-7695-2875-9
[18]Hasmat Malik, Tarkeshwar , R.K. Jarial (2011), ―An Expert System for Incipient Fault Diagnosis and Condition Assessment in Transformers‖, International Conference on Computational Intelligence and Communication Networks Pages 138-142, ISBN: 978-0-7695-4587-5
[19]Michel Duval IREQ, Canada, ― A Review of Faults Detectable by Gas-in-Oil Analysis in Transformers‖ [20]Huo-ChingSun ,Yann-Chang Huang,Chao-Ming Huang,
(2012)―A review of dissolved gas Analysis in transformer‖, Energy Procidia 14 pp. 1220 1225
[21]Huo-ChingSun, Yann-Chang Huang, Chao-Ming Huang,(2012) ― Fault Diagnosis of Power transformer Using Computational Intelligence: A Review‖, Energy Procidia14 (2012) 1226 -1231.
[22]Andrew K.S. Jardine ,Daming Lin, DraganBanjevic, (2006)― A review on machinery diagnostics and prognostics implementing condition-based maintenance‖,
Mechanical Systems and Signal Processing 20: 1483– 1510
[23]Verma P, Singh J, Sood YR (2012) The influence of service aging on transformer insulating oil parameters. IEEE Trans Dielectr ElectrInsul 19:421–426
[24]Bhalla D, Bansal RK, Gupta HO, Function analysis based rule extraction from artificial neural networks for transformer incipient fault diagnosis.Int J Electr Power Energy Syst 43:1196–1203
[25]Ozgonenel O, Kilic E, Khan MA, Rahman MA (2008) A new method for fault detection and identification of incipient faults in power transformers. Electric Power ComponSyst 36:1226–1244
[26]. Knapp GM, Jovadpour R, His-Pin Wang (2000) An ARTMAP neural network: based machine condition monitoring system. J QualMaint Eng6:86–105
[27] Yadaiah N, Ravi N(2011) , ‘Internal fault detection techniques forpower transformers‘. Application of Soft Computing, 11:5259–5269
[28] Karimollah Hajian-Tilaki(2013),‖ Receiver Operating Characteristic (ROC) Curve Analysis for Medical Diagnostic Test Evaluation‖ Caspian J Intern Med. Spring; 4(2): 627–635.
[29] Gardner MJ, Altman DG(1989). ―Calculating confidence intervals for proportions and their differences‖. In: Gardner MJ,Altman DG, eds. Statistics with confidence. London: BMJ Publishing Group,:28-33
[30]Wen Zhu, Nancy Zeng, Ning Wang(2010),‖ Sensitivity, Specificity, Accuracy, Associated Confidence Interval and ROC Analysis with Practical SAS® Implementations‖ NESUG