Twitter Sentiment Analysis using Rapid Miner Tool
Shilpa Singh Hanswal
Research Scholar The IIS University
Jaipur, India
Astha Pareek
Sr. Asst. Professor The IIS University
Jaipur, India
Amita Sharma
Sr. Asst. Professor The IIS University
Jaipur, India
ABSTRACT
Since last few years social networking and Micro-blogging sites have become a largest platform for sharing users’ personal feelings, marketing or social liking. Especially in product based company where success of a company depends on the opinion of different customers. These opinions can be use to analyze the user’s sentiments, feelings and assessment of product.
In this paper tweets about government schemes has been fetched from twitter with the help of scraper written in python language. Tweets are divided into two data sets, one is of 50 tweets length and another data set is of 200 tweets length. An experiment has been performed in Rapid Miner tool to find accuracy of sentiments polarity using Naive Bayes and k-NN techniques, also comparison between these techniques is observed to find out the best performing one.
Keywords
Sentiment analysis, Naïve Bayes, k-NN, Rapid Miner, Python, Twitter, polarity.
1.
INTRODUCTION
Data mining is a process of finding any particular data or information from large database. Sentiment analysis is also a one form of data mining where sentiments can be mined on the bases on positive and negative thoughts. Sentiment analysis technique has capability to review natural language and provide public opinion about any topic or product.
The basic components of opinion mining are as follows:
There are three levels of opinion mining. These levels are as follows:
Sentimental analysis is the type of language processer in which the feeling, likes or dislikes of user on any product or social issue are tracked. There are number of vendors who observed the reaction of users for their product through twitter. Now a day’s social networking site become more popular for observing the sentiments in different area as most of the humans share their feeling through social network site. From last decade, these reaction or opinion of different person has been used to find sentimental analysis and can be used in research development. Number of tools and techniques has been available in market for fetching and analysis these comments or tweets. These tweets can be positive, negative or neutral. There are two types of techniques used in opinion mining one is machine learning based techniques and second is Lexicon Based technique. In Lexicon, a sentiment dictionary is used with sentiment words for classification of sentiments. But in machine learning various machine learning algorithms like Naïve Bayes, Maximum Entropy, SVM, K-means etc are used for classification of sentiments. Machine learning algorithms play an important role in designing a tool. Various supervised and unsupervised machine learning algorithms can be used for finding the sentiment analysis. In this research, two techniques
•They are those persons that give opinion for
any specific topic.
Opinion
holder
•Object is entities on which opinion is expressed by user.
Object
•Opinion is sentiment,
• It is about classification of overall opinion presented in entire document as positive, negative
or neutral about a certain object.
Document level
• It is associated with two tasks. First one is to find the given sentence is subjective where subjective refers to opinionated or objective. The second task is refers to find the subjective sentence as positive,
negative or neutral.
Sentence level
• In feature level a summary report is produce on the bases of features extracted by commented object and then group the feature synonyms which
are extracted by the opinion of the object as positive or negative.
like NLTK, Weka, Rapid miner, GATE, Open NLP etc. In this paper Rapid miner tool has been used to analyse the sentiments collected from twitter on government campaign. Rapid miner is a open source software which encompasses data analysis, data integration and reporting in a single suit. It is very easy to use software with lots of features like cross validation, performance vector, split validation. This paper includes tweets on government schemes like Beti Bachao Beti Padhao, Digital India and Swachh Bharat Abhiyan these tweets are fetched from twitter with the help of scraper written in python language. Further organization of this paper is as follows: Section 2 expounded the previous work of different tools and techniques used in opinion mining. In section 3 analysis of twitter data using Rapid Miner tool. Two different types of data set are taken and comparison between Naïve Bayes and k-NN techniques to find out the polarity of tweets. Section 4 describes the result in which accuracy, precision and recall of Naïve Bayes and k-NN is compared. And finally conclusion and future work are discussed in Section 5.
2.
LITERATURE REVIEW
Vyas et al., (2018) performed an experiment on Rapid miner tool to derive sentiments from tweets. Author has used different algorithm to find accuracies and then compared to find the best performing one. 450 tweets on customer feedbacks have been taken from twitter. These customers feedback improves the business and increase the faith in their business. This data is splits into two parts that is, training and testing with the split ratio =.66 it means 2/3 of data is used for training and rest of the data is used for testing. SVM, decision tree and naive bayes techniques are used to find accuracy, precision and Recall. Accuracy of these three models has been observed with respect to different sample size of training dataset.
Charu Puri et al., (2017) has used the tripadviser.com to extract data in the form of online reviews given by 4000 user that is 4000 reviews has been taken, this data is extracted with the help of Scraper written in python language. She also introduced an opinion ensembling algorithm as ensemble method trained multiple learners on the provided data set to solve the same problem then combine them to form a single model. At last author studied the economic impact on tourism. For analyzing the study of economy impact a case study has been taken, this case study is about Sri Lanka Tsunami 2004 where effect of Tsunami is observed on the economy rate of tourism in Sri Lanka.
Mahajan et al.,(2016) focused on government data as author believed on “government’s success relies on effectively communicate their messages to citizens and build strong alliances with them by empowering their participation in the decision-making process.” The data for the research has been collected from the government website my-gov.in. This is an official website where common people have opportunity to put their comments on any government schemes. After data collection author segregated data by using specific keywords and then measured the polarity of these keywords. Data dictionary has been used to find the polarity of data.
public opinion about iphone 6 using twitter. Author used sentiword to find out numerical score between -1 to 1 where lower value shows negative sentiment and higher value shows positive sentiments. Author used Rapid Miner extension NamSor to find user’s gender. Finally data was presented graphically and several comparisons have been made to justify the accuracy of used methodology.
Python language can also be used in lexicon language for finding sentiment analysis. (Agarwal et al., 2016) analyzed and tested an algorithm in which news headlines can be classified as positive or negative sentiments using NLTK tool of python language. An experiment has been done by author on top 10 world news headlines of 3rd Dec 2015. In this experiment author has been calculated the positive or negative polarity of each headline manually as well as from experimental algorithm using Sentiwordnet. The result has been calculated for finding deviation from experimental result to manual result. If any error detected it was marked as E (error) otherwise marked C (Correct Result). Finally error percentage has been calculated. The above algorithm run for around 500 news headlines of 30 days and analyzed the deviation of experimented values from expected values of polarity. This experiment found average Deviation of 30 days news headlines was 2.7. For a huge data, this manual classification task can be erroneous and a tedious job and can deviate the results. For solving this problem one can classify them using SVM technique or apply some other machine learning task for the same.
So, from the above literature review it can be conclude that rapid miner tool can be used for finding the polarity of data. Sentiment analysis of twitter data can be determined using various tools and techniques. Python language can also be use to fetch data from twitter or any other websites. Sentiword can also be use for finding numerical score of positive or negative.
3.
ANALYSING TWEETS USING RAPID
MINER
3.1
Data source and Data set
To conduct the research the data was fetched from twitter. Two data sets have been taken, one is of 50 tweets and other is of 200 tweets. These data has been taken with the help of scraper written in python. These data sets have remarks on government schemes as number of people on twitter give feedback on government schemes. The data set has been prepared by classify the tweets into positive and negative remarks.
3.2 Methodology
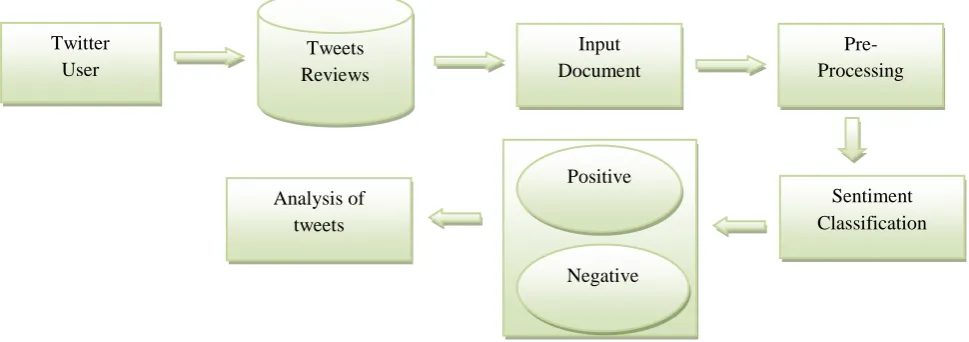
Fig 1: Shows the Sentiment analysis process
3.1.1 Naïve Bayes
A Naïve Bayes is a simple probabilistic classifier based on Bayes’ theorem. It can build a good model even with a small data set. It is simple to use and computationally inexpensive and is very useful for the case where dimensions of input are high also for a given class as positive or negative the words are conditionally independent of each other. Naïve Bayes classifier is an approach in which a classification of text (specific attribute) on the bases of appearance or absence of a class c in a given document d.
Where c belongs to the positive or negative class and d belongs to the document whose class is being predicted, also P(c) and P(d|c) obtained during training.
3.1.2 k-NN
This operator generates a k- Nearest Neighbor model, which is used for classification and regression. The k-Nearest Neighbor algorithm is based on the comparison of data setwith k training data sets which are the nearest neighbor of that dataset. In k-NN one can set the value of k and can observe the result produce.
Where yi is the ith case of the example sample and y is the result or one can say predicted outcome of the query point.
Problem Statement: To analyzing government scheme using k-NN and Naïve Bayes in Rapid Miner tool.
Classification Models used: k-NN and Naive Bayes.
Data was extracted from Twitter using python script. This data contains undesired words so preprocessing of data is required. Preprocessing of data involves five steps.
Tweets Reviews
Input Document
Pre- Processing
Sentiment Classification Positive
Negative Analysis of
tweets Twitter
Fig 2: Steps of Preprocessing of data
Now cross validation technique of rapid miner tool is used to train Naïve Bayes and k-NN separately. Data is given for training and testing using cross validation technique after that performance has been observed using performance model.
[image:4.595.102.494.286.504.2]Calculation of accuracy, precision and recall has been observed for both the techniques and comparison has been done. Below figures shows the performance of Naive Bayes and K-NN.
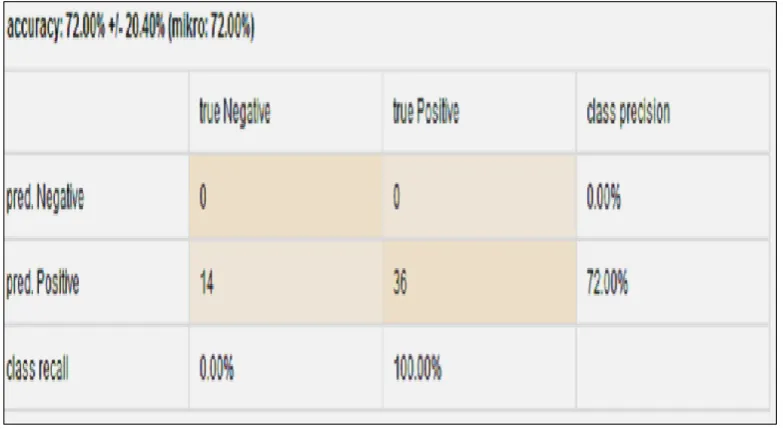
Fig 3: Confusion Matrix of accuracy of data using Naive Bayes
Figure 3 shows that the total number of data set is 50 i.e. 14+36 in which 14 tweets are negative and 36 tweets are positive. Above confusion matrix is used to define all the parameters. The row “predicted positive” tells about the data that were clustered as positive and “predicted negative” tells about the data that were classified as negative. True positive and true negative tells about the data that were actually labeled as positive and negative respectively. For example, in the above confusion matrix, 14 tweets which are actually negative are predicted as positive. Similarly, 36 tweets which are actually positive are predicted as positive. First cell shows 0 value that is true Negative value is zero it means that Nave Bayes has been failed to find the actual negative value. Again second cell shows thevalue 0 that is false negative value is 0 indicated that
Naïve Bayes predicted all the actual positive tweets as positive and no tweets has been wrongly predicted for positive values. Now third cell shows the value 14 that is false negative value in 14, it means that Naïve Bayes has been failed to predict the True negative tweets and all negative tweets were incorrectly identified. Lastly fourth cell gives true positive value. True positive value means the values which are actually positive predicted as positive and the value is 36. It indicates thatNaïve Bayes has been predicted all positive values as positive. It has been observed that the accuracy (which is the ratio of correctly predicted tweets and the total tweets) is 72%. Also Precision value is 72% which is the ratio of true positive and total positive. Lastly for recall value, it gives 100% which shows that Naïve bayes gives 100% value in finding positive tweets with no value in false negative.
Data Cleansing
words
Fig 4: Confusion Matrix of the accuracy of data using k-NN with k=10.
Figure 4 shows confusion matrix using k-NN method when value of k is 10 it has been observed that 10 tweets are actually negative are predicted as negative and 35 tweets which are actually positive but predicted as negative, 4 tweets are actually negative are predicted as negative lastly 1tweet are actually positive is predicted as positive. So, when value of k is 10 in k-NN algorithm, it is failed to find positive tweets as true positive value is only 1. But k-NN gives 10 value in true negative out of 14 total negative value and only 4 tweets are predicted incorrect. So it is observed that accuracy is 22% only when using k-NN method. In the same way precision value is 20% in positive prediction and 22.22% in negative prediction. Also recall value of k-NN is 71.43% for negative prediction and 2.78% for positive prediction.
The k-NN method has been observed for different values of k that is 1, 5, 10, 15, 20 and 25.
Now the overall comparison between Naïve Bayes and k-NN method, It has been observed that Naïve bayes and k-NN shows the same result when value of k is 25 in k-NN method but if value of k is less than 25 then k-NN shows less accuracy, precision and recall result as shown bellow.
[image:5.595.310.543.305.538.2]Figure 5 shows the accuracy in percentage of Naïve Bayes and k-NN method and this is observed that at one extend Naïve Bayes and k-NN give the same accuracy.
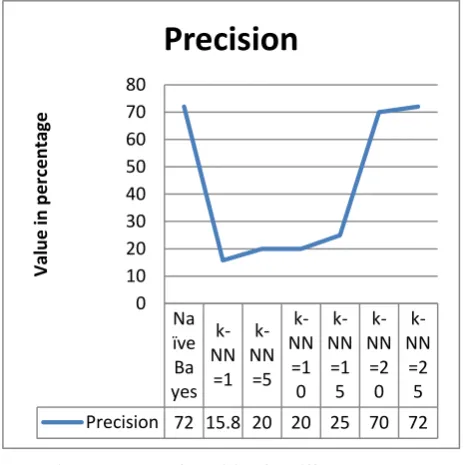
Fig 6: the value of precision for different models
Figure 6 shows the value of precision in percentage and it is observed that if the value of K in k-NN has been taken 25 then it will shows the same result as in Naïve Bayes.
Naï ve Ba yes k-NN =1 k-NN =5 k-NN =1 0 k-NN =1 5 k-NN =2 0 k-NN =2 5 0 10 20 30 40 50 60 70 80 Val u e in p e rc e n tage
Accuracy
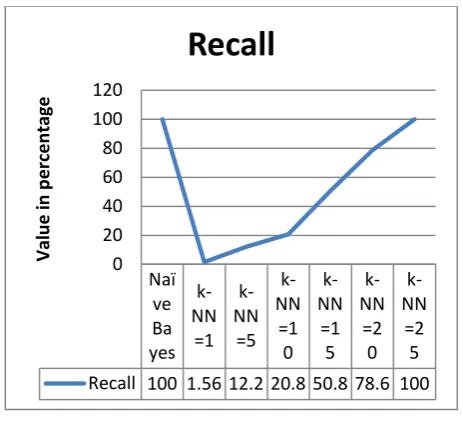
Na ïve Ba yes k-NN =1 k-NN =5 k-NN =1 0 k-NN =1 5 k-NN =2 0 k-NN =2 5 Precision 72 15.8 20 20 25 70 72 [image:5.595.53.291.504.724.2]Fig 7: The value of recall for different models
Figure 7 shows that both Naïve Bayes and k-NN when value of k=25 then give the same recall value.
Now if increase the size of data set that is sample size by 200 then it has been observed that both Naïve bayes and k-NN=5 gives the same accuracy, Recall and Precision result as shown in figure8.
[image:6.595.54.285.369.641.2]Fig 8 the accuracy of different model with data set size 200.
4.
RESULT
With the data set of 50 tweets, Naïve Bayes shows 72% accuracy, 72% precision and 100% recall. It is observed that Naïve Bayes performed better then k-NN method when value of k is less than 25 but, if the value of k is 25 or more both the methods gives same result. If data set is increased by 200 then both Naïve Bayes and k-NN with value 5 gives same accuracy, recall and precision values. But if the value of k is more then 5,
In this paper Naïve Bayes and k-NN methods has been compared and observed that both are performing same with positive values by giving 100% output but fail to find negative values. In future different data sets and methods can be taken to find out accuracy or comparison between different methods available. One can use nltk toolkit of python in place of rapid miner tool as nltk is rich source of inbuilt libraries. Also in this paper Naïve bayes and k-NN has been uesd but the experiment can be done with methods like SVM, Maximum Entropy etc. Instead of twitter data, Facebook data can be taken for the same.
6.
REFERENCES
[1] Agarwal, A., V. Sharma, G. Sikka and R. Dhir (2016). Opinion Mining of News Headlines using SentiWordNet. IEEE. 16, 978-1-5090-0669-4.
[2] Ananchai, S. Thammaboosadee and C. Haruechaiyasak (2014). A Lexiconizing Framework of Feature-based Opinion Mining in Tourism Industry. IEEE. 14, 978-1-4799-3724-0.
[3] BiswaRanjanSamal, A. K. Behera and M. Panda (2017). Performance Analysis of Supervised Machine Learning Techniques for Sentiment Analysis. IEEE. 978-1-5090-4929-5.
[4] Cristian, B., (2015). Using Opinion Mining Techniques in Tourism. ELSEVIER.23, 1666-1673.
[5] Deshpande, P., V. Shaga and S. Thorat (2017). REVIEW OF SENTIMENT ANALYSIS ON TWITTER DATA USING PYTHON. International Journal of Advanced Research in Computer Science.8, 0976-5697.
[6] Ding, Y., B. Li, Y. Zhao and C. Cheng (2017). Scoring Tourist Attractions Based on Sentiment Lexicon. IEEE.17, 978-1-4673-8979-2.
[7] Goel, A., J. Gautam and S. Kumar (2016). Real Time Sentiment Analysis of Tweets Using Naive Bayes. IEEE. 16, 978-1-5090-3257-0.
[8] Hridoy, S. A. A., M. T. Ekram, M. S. Islam, F. Ahmed and R. M. Rahman (2015). Localized twitter opinion mining using sentiment analysis. Springer.1186, 40165-015-0016-4.
[9] Kumar, B. S. and D. B. Reddy (2016). An Analysis on Opinion Mining: Techniques and Tools. Indian Journal of Research.5, 2250-1991.
[10]Linares, R., J. Herrera, A. Cuadros and L. Alfaro (2015). Prediction of Tourist Traffic to Peru by using Sentiment Analysis in Twitter Social Network. IEEE.15, 978-1-4673-9143-6.
[11]Liu, B. (2015). Sentiment Analysis, Mining Opinions, Sentiments, and Emotions, p 381, Cambridge University Press, Chicago.
[12]Mahajan, A., R. Divyavir, N. Kumar, C. Gade and L. A. Deshpande (2016). Analysing the Impact of Government Programmes. International Journal of Innovative Research in Computernand Communication Engineering. 4, 2320-9801.
[13]Manek, A. S., P D. Shenoy, M C. Mohan and Venugopal K R (2016). Aspect term extraction for sentiment analysis in large movie reviews using Gini Index feature selection method and SVM classifier. Springer. 10,
11280-015-Naï ve Ba yes k-NN =1 k-NN =5 k-NN =1 0 k-NN =1 5 k-NN =2 0 k-NN =2 5 Recall 100 1.56 12.2 20.8 50.8 78.6 100
0 20 40 60 80 100 120 Val u e in p e rc e n tage
Recall
[14]Mishra, N., (2015). Opinion mining Through Sentence Level Analysis, 124. Banasthali University, Rajasthan. [15]Munir, A. and S. Aftab (2017). Analyzing the Performance
of SVM for Polarity Detection with Different Datasets. Modern Education and Computer Science. 10, 29-36. [16]Puri C., Akhil, Gaurav, Kush and N. Kumar (2017).
Opinion Ensembling for Improving Economic Growth through Tourism. ELSEVIER. 122, 237-244.
[17]Tandoc E. C., P. Ferrucci and M. Duffy (2015). Facebook use, envy, and depression among college students:Is facebooking depressing?. ELSEVIER. 43, 139-146. [18]Vyas V. and V. Uma (2018). An Extensive study of