University of Warwick institutional repository: http://go.warwick.ac.uk/wrap
A Thesis Submitted for the Degree of PhD at the University of Warwick
http://go.warwick.ac.uk/wrap/55431
This thesis is made available online and is protected by original copyright.
Please scroll down to view the document itself.
A Multidimensional Analysis of
Post-Acquisition Performance:
The Case of Research and Development
in the Pharmaceutical Sector
Rupert Julian Booth
Thesis submitted for the degree of Doctor of Philosophy
in Business & Management Studies
University of Warwick, Coventry
Warwick Business School
Contents
Acknowledgments
xii
Declaration
xiii
Abstract
xiv
Glossary
xv
1
Introduction
1
1.1 Research Aim
1
1.2 Choice of Sector and Need for Research
3
1.3 Research Approach
4
1.4 Research Hypotheses
5
1.5 Technical Challenges and Contributions to Knowledge 7
1.5.1 Measurement of Intangibles 7
1.5.2 Longitudinal Nature of R&D Pipeline 7
1.5.3 Variety of Outputs 8
1.5.4 Types of Contributions to Knowledge 8
2 Overview of Pharmaceutical Sector
10
2.1 Introduction
10
2.2 R&D Processes
10
2.3 Market Structure and Acquisition Activity
13
3 Literature Review
16
3.1 Introduction
16
3.2 PAP
16
3.2.1 History 16
3.2.2 Meta-Analyses 17
3.2.3 Summary of Main Approaches 24
3.2.4 Motive and Synergy 26
3.2.5 Diversification Literature 27
3.3 RBV
29
3.3.1 Early Definition of the RBV 29
3.3.2 Qualification of Resources 30
3.3.3 Dynamic RBV 31
3.3.4 Critiques of the RBV 31
3.3.5 Recent Retrospective on the RBV 33
3.3.6 Summary of Key Issues for Performance Measurement 34
3.4 PMFs
35
3.4.1 Theoretical Benefit of Additional Information 35
3.4.2 Benefits of PMFs 36
3.4.3 The Balanced Scorecard and its Evolution 37
3.4.4 Choice of Measures 40
3.4.5 External Evaluation of Intellectual Capital 41
3.5 Use of the RBV to Measure Performance in
Pharmaceuticals
44
3.6 Relevant DEA Literature
48
3.7 Synthesis
50
4 Design of PMF
52
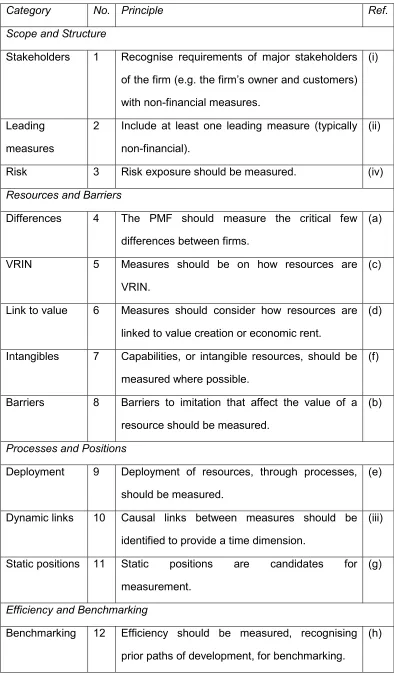
4.2 PMF Design Principles
52
4.3 Availability of Information
56
4.3.1 Practicality 56
4.3.2 Scope and Structure 56
4.3.3 Resources and Barriers 57
4.3.4 Processes and Positions 59
4.3.5 Efficiency 60
4.4 Application of Design Principles to the Pharmaceutical
Sector
61
4.4.1 Demonstration of Use 61
4.4.2 Scope and Structure 61
4.4.3 Resources and Barriers 63
4.4.4 Processes and Positions 64
4.4.5 Efficiency 65
4.5 Proposed Pharmaceutical PMF
66
4.5.1 Outcome of Design Principles 66
4.5.2 Use of Negative Indicators 68
4.5.3 Choice of Financial Measures 68
4.6 Focus on R&D and Adaptation to DEA
69
4.7 Conclusion
71
5 Research Methodology
72
5.1 Introduction
72
5.2 Efficiency and Productivity Analysis Approaches
72
5.3 Summary of DEA Model
74
5.3.1 Orientation of Model 74
5.4 Longitudinal Dimension
76
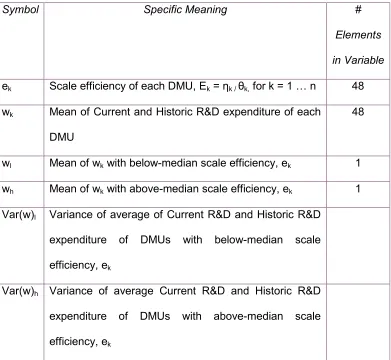
5.5 Definition of Notation
77
5.5.1 MCT 77
5.5.2 Normalisation Factor 78
5.5.3 Algebraic Notation for Efficiency Analysis 79
5.5.4 Form of DEA Equations 81
5.5.5 Algebraic Notation for Examination of Returns to Scale 82 5.5.6 Algebraic Notation for Classification of Acquisition History 83 5.5.7 Algebraic Notation for Statistical Testing 84
5.6 DEA
85
5.7 CCR Model
86
5.8 BCC Model
87
5.9 Output Weight Restrictions
88
5.10 Input Weight Restrictions
89
5.11 Returns to Scale
89
5.12 Design and Population of Acquisition
Typology
90
5.12.1 Identification of Acquisitions 90
5.12.2 Classification of Acquisitions 92
5.12.3 Identification of Cross-border and Cross-sector Acquisitions 92 5.12.4 Linkage to Major Pharmaceutical Companies 94
5.13 Analysis of M&A History
95
5.14 Statistical Test Approach
96
5.15 Incomplete Data
99
6 Data and Descriptive Statistics
100
6.2 Available Input Data for the DEA Models
101
6.3 Available Output Data for the DEA Models
101
6.4 Comparing CRS and VRS Efficiency Scores
102
6.5 DEA Model Results: Comparing Input Assumptions 102
6.6 Financial Efficiency Data
103
6.7 Acquisition and NDV Data
103
6.8 Association of M&A and Technical Efficiency
103
6.9 Association of M&A and Financial Efficiency
104
6.10 Descriptive Statistics of the DEA Model Outputs
104
6.11 Descriptive Statistics of the R&D Process
106
6.12 Descriptive Statistics of M&A
109
6.13 Summary
112
7 Hypothesis Testing
113
7.1 Scope of Hypothesis Testing
113
7.1.1 Classical Hypothesis Testing Model 113 7.1.2 Set 1, Hypothesis 1: Returns to Scale 115 7.1.3 Set 2, Hypotheses 2, 3 & 4: Firm Acquisition History
and Technical Efficiency 116
7.1.4 Set 3, Hypotheses 5, 6 & 7: Deal History
and Financial Efficiency 117
7.1.5 Set 4, Hypotheses 8, 9 & 10: Acquisition History
and Sectoral Efficiency 118
7.1.6 Set 5, Hypotheses 11, 12, 13 & 14: Acquisition History
and Sales over Assets 120
7.2 Returns to Scale (H1)
121
7.3 M&A and Technical Efficiency (H2, H3, H4)
122
7.3.1 Hypothesis 2 122
7.3.3 Hypothesis 4 124
7.3.4 Summary of the Set 125
7.4 M&A and Financial Efficiency (H5, H6, H7)
126
7.4.1 Hypothesis 5 126
7.4.2 Hypothesis 6 127
7.4.3 Hypothesis 7 128
7.4.4 Summary of the Set 129
7.5 Sector Effects and Technical Efficiency (H8, H9, H10) 130
7.5.1 Hypothesis 8 130
7.5.2 Hypothesis 9 130
7.5.3 Hypothesis 10 131
7.5.4 Summary of the Set 132
7.6 M&A and Financial Metrics (H11, H12, H13, H14)
132
7.6.1 Hypothesis 11 132
7.6.2 Hypothesis 12 133
7.6.3 Hypotheses 13 & 14 133
7.6.4 Summary of the Set 135
7.7 Summary of Findings
135
7.7.1 Collation of Findings 135
7.7.2 Check for Consistency 136
8 Discussion of Results
139
8.1 Range of Findings
139
8.2 Returns to Scale of R&D
140
8.3 The Association of Technical Efficiency with M&A
8.4 The Association of Financial Efficiency with M&A
History
142
8.5 The Sectoral Consequences of M&A
143
8.6 Relationship between SOA and M&A
144
8.7 Synthesis of Findings
145
9 Contributions
149
9.1 Overview
149
9.2 Contributions to the Acquisition Literature
150
9.2.1 Reduction of Uncertainty 151
9.2.2 Differences in Measured Performance 151
9.2.3 Diversification 153
9.3 Contributions to the Performance Literature
153
9.4 Contributions to the DEA Literature
154
9.5 Empirical Contributions
154
9.5.1 Returns to Scale 154
9.5.2 Power Laws in M&A 155
9.5.3 Financial Metrics in M&A 156
9.6 Directions of Future Research
157
A. R&D Data
182
A.1 Introduction
182
A.2 Historical R&D Data
182
A.3 Historical Sales Data
185
A.4 Current R&D & Composite R&D Data
188
A.5 Conclusion
193
B. Staff Data
194
B.1 Introduction
194
B.2 Staff Data
194
C. Power Laws
198
C.1 Introduction
198
C.2 Definition of a Power Law
198
C.3 Alternative Distributions
199
C.4 Relevance to this Thesis
200
D. DEA Model Data
201
E.
Acquisition Data
242
E.1 Introduction
242
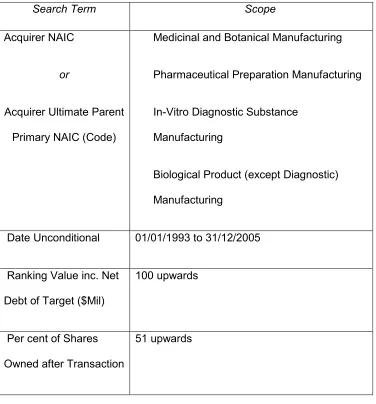
E.2 Search Criteria
242
E.3 Annual Analysis
244
List of Tables
3.1 Choice of Measures in Acquisition Meta-Analysis 1983–2006 ... 19
3.2 Contributions of the Major RBV Authors to Performance Measurement.... 34
3.3 Summary of Balanced Scorecard Concepts ... 39
3.4 Parameters and Metrics Cited in DeCarolis & Deeds (1999) ... 45
3.5 Outcomes of Hypotheses Testing in DeCarolis & Deeds (1999) ... 46
3.6 Parameters and Metrics in DeCarolis (2003) ... 47
3.7 Outcomes of Hypotheses from DeCarolis (2003) ... 48
4.1 Design Principles ... 53
4.2 Proposed Pharmaceutical PMF ... 66
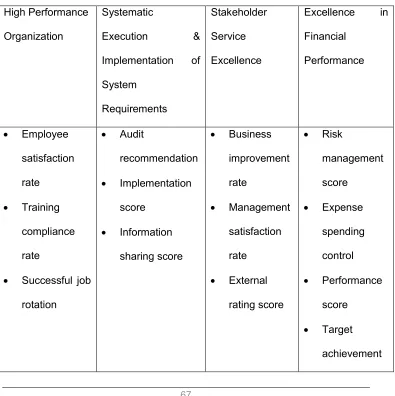
4.3 Scorecard for Pharmaceutical Company ... 67
5.1 Time and Costs of R&D Development ... 76
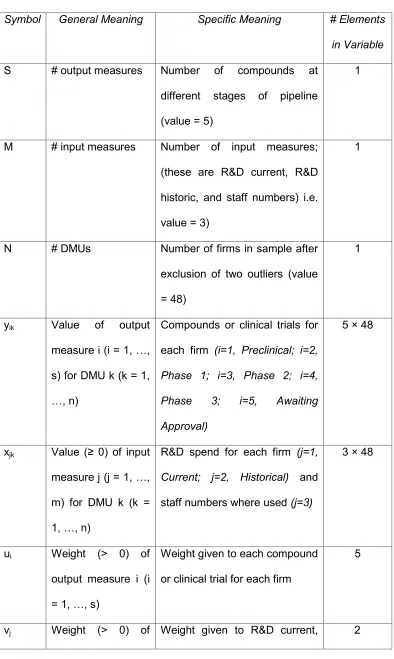
5.2 Algebraic Notation for DEA Models ... 80
5.3 Algebraic Notation for Examining Returns to Scale ... 82
5.4 Algebraic Notation for Classification of Acquisition History ... 83
5.5 Algebraic Notation for Hypothesis Testing ... 85
5.6 Selection Criteria ... 91
5.7 Key Terms for Acquisition Typology ... 96
6.1 Descriptive Statistics of Ratio of Trials to Compounds ... 105
6.2ttest on Ratios of Trials to Compounds in Successive Phases ... 105
6.3 Summary of Association of Acquisition History with Technical Efficiency ... 112
6.4 Summary of Association of Acquisition History with Financial Efficiency ... 112
7.1 Results of Tests on Hypothesis H1a ... 121
7.2 Results of Tests on Hypothesis H2a ... 122
7.3 Results of Tests on Hypothesis H3a ... 124
7.4 Results of Tests on Hypothesis H4a ... 125
7.5 Results of Tests on Hypothesis H5a ... 127
7.6 Results of Tests on Hypothesis H6a ... 128
7.7 Results of Tests on Hypothesis H7a ... 129
7.8 Results of Tests on Hypothesis H8a ... 130
7.10 Results of Tests on Hypothesis H10a ... 131
7.11Results of Tests on Hypothesis H11a ... 132
7.12 Results of Tests on Hypothesis H12a ... 133
7.13 Results of Tests on Hypothesis H13a ... 134
7.14 Results of Tests on Hypothesis H14a ... 134
7.15 Rejected Null Hypotheses... 135
7.16 Boderline Alternative Hypotheses ... 137
A.1 Historical R&D Data in $million Actual ... 182
A.2 Historical Revenue Data in $million Actual ... 185
A.3 Current & Composite R&D Data in $million Actual... 190
B.1 Staff Numbers ... 194
D.1 DEA Model Inputs ... 201
D.2 DEA Model Compounds (Comp.) Output Data ... 205
D.3 DEA Model Clinical Trials Output Data ... 208
D.4 DEA Efficiency Scores for Compounds as Outputs ... 211
D.5 DEA Efficiency Scores for Trials as Outputs ... 214
D.6 DEA Efficiency Scores for VRS for Alternative Input Assumptions ... 217
D.7 ROS, ROA and SOA ... 220
D.8 SDV, Cost of Sales and NDV Data for Firms ... 223
D.9 NDV and Pure Technical Efficiency (Base Model) ... 226
D.10 NDV and Pure Technical Efficiency (Staff Input) ... 228
D.11 SDV and Pure Technical Efficiency (Base Model) ... 230
D.12 Association of NDV and ROS ... 233
D.13 Association of NDV and ROA ... 236
D.14 Association of Acquisition History and SOA ... 239
E.1 Database Search Criteria ... 243
E.2 Date Analysis ... 245
E.3 Detailed Merger Data ... 247
List of Figures
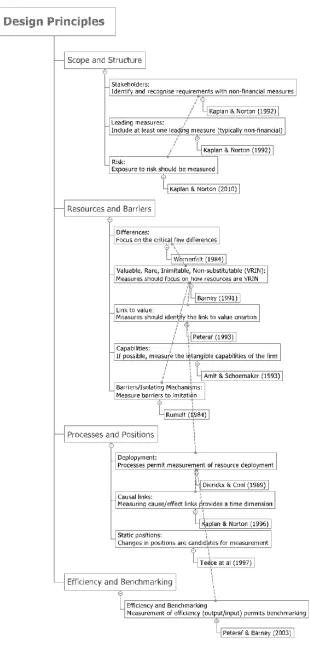
4.1 Summary of Design Principles ... 556.1 Graph of Scale Efficiency Versus Mean R&D (Compounds as Output) .. 107
6.2 Graph of Scale Efficiency Versus Mean R&D (Trials as Output) ... 107
6.3 Distribution of R&D Expenditure of Above- and Below-Median Efficiency 108 6.4 Frequency of M&A Deals by Value ... 109
Acknowledgements
I would like to thank my supervisors Dr Duncan Angwin and Dr Mette Asmild
for their assistance and encouragement and to acknowledge the example of
Declaration
I declare that the content of this thesis is entirely my own work and has not
Abstract
This thesis provides an additional perspective of the Merger Paradox, namely that mergers and acquisitions (M&A) continue to be transacted when historically their results seem to be disappointing overall.
The thesis shows that when a theoretically sound basis (related to the Resource Based View and expressed as twelve design principles) is used to design a performance measurement framework, then there is no association between a firm's post-acquisition performance and the scale of a firm's previous acquisitions; the thesis then shows, by contrast, that there is a positive association between firms with an above-average level of past acquisitions (by value) and higher financial performance. This divergence provides both a motive and an ability to continue to undertake M&A, despite a lack of association of acquisitions with longer-term operational performance and very strong evidence of diseconomy of scale in the most crucial business process, for the case examined, which is the research and development (R&D) process in the research-based pharmaceutical sector. Additionally, the thesis examines the relative merits of Return on Sales and Return on Assets as financial metrics of performance, and establishes statistically significant differences in the measurement of performance by these two metrics.
The thesis also establishes a contrast between the findings at the level of the firm and at the level of the sector, namely acquisitions considered in aggregate are associated with gains at the sector level, even though this association was not observed when acquisition was considered at the level of the acquiring firm.
Glossary
ADME Absorption, Distribution, Metabolism and Excretion
BCC Banker, Charnes and Cooper
CCR Charnes, Cooper and Rhodes
CRS Constant Returns to Scale
DEA Data Envelopment Analysis
DMU Decision Making Unit
DRS Decreasing Returns to Scale
IC Intellectual Capital
ICT Information and Communications Technology
IND Investigational New Drug
IRS Increasing Returns to Scale
KPI Key Performance Indicator
M&A Mergers and Acquisitions
MCT Measure of Central Tendency
Merger Paradox M&As continue to be transacted when historically their
results seem to be disappointing overall
NAIC North American Industry Code
NDV Normalised Deal Value
p-value The probability, computed assuming that the null
hypothesis is true, of observing a value of a test statistic
that is at least as contradictory to the null hypothesis as
the value actually computed from the sample data
(adapted from Bowerman et al., 2011: 359)
PAP Post-Acquisition Performance
PMF Performance Measurement Framework
R&D Research & Development
R&D (Average) Average Research & Development expenditure for a firm
from 2001 to 2006
R&D (Current) Research & Development expenditure for a firm in 2006
R&D (Historic) Average Research & Development expenditure for a firm
from 2001 to 2005
RBV Resource Based View
ROA Return on Assets
ROE Return on Equity
ROS Return on Sales
SDV Sum of Deal Value
US$ United States dollar. Official currency of the United
States of America and several other countries
VRIN Valuable to the company, Rare, Imperfectly imitable and
Non-substitutable
1 Introduction
1.1 Research Aim
Angwin (2007) posits a fundamental question for research into mergers and
acquisitions (M&A), which is often termed the ‘Merger Paradox’, namely why
M&A continue to be transacted when historically their results seem to be
disappointing overall. That paper goes on to suggest that there are many
objectives for M&A and one should not judge a transaction to be a failure on
the basis of a particular measure of performance. This thesis examines the
Merger Paradox from the stance of measurement rather than from the motive
itself (although the two are related), and seeks to demonstrate that differences
in the measures used to determine post-acquisition performance (PAP) could
explain the continuing popularity of M&A despite M&A not being associated
with improved long-term performance in crucial business processes.
The literature review for this thesis has identified PAP literature dating back to
1968 and from the very start the issue of multiple stakeholders and dubious
PAP was fully recognised. Over 40 years of research later, across several
disciplines, Zollo & Meier (2008) noted the absence of a convergence of
findings even within disciplines and identified the use of 12 types of measures
of PAP. Despite the variety of measures, in a recent investigation using
multiple criteria, Papadakis & Thanos (2010) noted disappointing outcomes in
over half of cases, which then leads to the Merger Paradox of why acquisitions
remain popular when, in most cases, they seem to be unsuccessful.
It is against this background of voluminous, diverse but pessimistic literature
that this thesis adds new contributions by initially focusing on the principles of
taking heed of Venkatraman & Grant (1986) who observe that in strategic
management the principle of measurement of a construct is often ignored in
favour of content development. In essence, PAP itself can never be
considered directly, but only through proxies for PAP expressed in a chosen
measure. Given this, the selection of any measure requires a theoretical basis.
The Resource Based View (RBV) of a firm is used here as the theoretical
basis for measure selection. Currently, RBV is a long-established approach to
strategic management. The Journal of Management in September 2011 dedicated a special issue to reviewing resource based theory to
commemorate its previous special issue that introduced the theory 20 years
earlier; in the most recent special issue, Barney et al. (2011) considered it had
reached maturity and was capable of further development to satisfy its critics.
The focus of the RBV is on the linkage of competitive advantage to the
differences between firms in the same market, as opposed to the factors
affecting profitability in the market as a whole (the focus of the Industrial
Organisation approach to strategy). The focus of RBV on relating the
competitive advantage of a firm to its special factors (some of which will be
measurable) has made its literature a natural basis from which to develop a
systematic means to identify a set of performance measures that can be
related to long-term performance. In the thesis, a performance measure is
used to assess the comparative efficiency of key processes of firms in a
particular sector and it is used as a measure of relative non-financial
performance. This performance measure is then associated with the
acquisition history of the firms and used to test a series of hypotheses for
mergers in aggregate as well as cross-sector and cross-border mergers. In
order to shed new light on the Merger Paradox, the outcome of the analysis is
Finally, the effect of M&A on sector performance and whether particular
alternative financial measures provide a consistent view on PAP are
examined.
1.2 Choice of Sector and Need for Research
The research-based pharmaceutical sector offers several advantages for this
research:
– The resources of a firm, in the RBV sense that includes both inputs and
outputs of the research and development (R&D) process, are clearly
defined because products cannot be developed without formal regulation
and identification, nor can they be sold without marketing approval.
– The R&D process is generic across the whole industry (because of
regulatory constraints) and this gives rise to a comparable process that
allows efficiency to be measured.
– Data on the industry are widely available.
These characteristics do not apply to all research-based industries, for
example the Information and Communications Technology (ICT) sector has
diverse R&D processes.
Furthermore, the research-based pharmaceutical sector offers compelling
public policy reasons to undertake research: rising healthcare costs are a
feature of the economies of the developed world and the ethical
pharmaceutical sector is both a cause of, and a potential solution to, these
costs; yet there is concern that it is facing a productivity crisis, for example
Cockburn (2006), and a rising cost per new compound, for example DiMasi et
1.3 Research Approach
Firstly, because the focus of the research is on how the assessment of PAP
depends on the choice of measure, it is necessary to first develop a
systematic and rigorous way to select performance measures; as indicated in
Section 1.1, this is based upon the RBV. The selection process leads to a
vector of measures that can be used to measure R&D efficiency.
Secondly, having defined a vector of measures, a number of Data
Envelopment Analysis (DEA) models were built with the selected measures to
measure comparative efficiency of the R&D process between firms, in order to
establish relative performance; in order to do this it was necessary to test for
returns to scale, after populating the models with data on the inputs and
outputs to the process. The different models had different selections of inputs
that gave rise to different assessments of efficiency.
Thirdly, data on acquisitions of the major pharmaceutical firms were collected
and the deals were also classified according to whether the acquisition
involved diversification into different nations or sectors. The data on M&A
values were summated for each of the firms and also normalised by dividing
by the cost of sales of the firm to relate the deals to the size of the firm.
Fourthly, this acquisition history of the firms was associated with their
efficiency as measured by DEA and used to test three merger-related
hypotheses relating to: acquisitions in total, acquisitions of new product
resources, and acquisitions of new market resources. This was done for more
than one DEA model and the differences in outcomes were related to typical
Fifthly, the financial efficiency of the firms was measured by Return on Sales
(ROS) and Return on Assets (ROA), for the same firms and this was used to
test the same three hypotheses. This was then compared with the outcomes
of the hypothesis tests using the DEA methods and this led to a further
explanation of the Merger Paradox.
Sixthly, the acquisition statistics on mergers of the firm were analysed without
the application of a normalisation factor to examine the effect of mergers on
efficiency at the sectoral level; this was done in order to compare the outcome
with financial methods of analysis in which differences are observed for the
PAP of the shareholders acquiring the firm alone and the shareholders of the
acquiring and acquired firm together.
Seventhly, the statistic Sales over Assets (SOA) was tested in order to
understand if the acquisition process had an effect on common financial
metrics that could be used to measure PAP and an effect was detected.
Some of these steps required hypothesis testing. The research hypotheses
are described in the next section (1.4). The research hypotheses were
developed after consideration of the literature on PAP and will be related to
the literature in the final chapters of the thesis.
1.4 Research Hypotheses
The hypotheses are based on testing the difference in a measure of central
tendency (MCT) between two samples, using both a parametric and a
non-parametric test. All the hypotheses follow a conventional format, whereby the
null hypothesis represents the case of no difference between the means of
two samples; the alternative hypothesis is therefore that there is a difference
is tested to establish a statistically significant difference between the means of
the two samples.
In the case of the first set of hypotheses, there is a single null hypothesis that
scale does not vary with size: constant returns to scale (CRS) exist for a
process. The alternative hypothesis is that there are variable returns to scale
(VRS) and this is tested by examining whether statistically significant
differences in size exist between two groups comprising firms with
above-median and below-above-median efficiency scores.
The second set of hypotheses (a set of three) examines technical efficiency.
The null hypothesis is taken to represent the situation that a history of M&A
transactions, normalised for the size of the firm, is not associated with a
change in efficiency. The alternative hypothesis is that efficiency does change
as a result of M&A and as the objective is to test the Merger Paradox, the
statistical test is one-sided: M&A is associated with lower technical efficiency.
A similar test is undertaken for a third set of three hypotheses that examines
financial efficiency (as measured by both ROS and ROA), except that the
direction of the alternative hypothesis is that M&A is associated with higher
ROS and ROA that would provide a financial motive, or at least a qualifying
factor, for the deal.
A fourth set of three hypotheses considers the association of acquisitions in
total, without normalisation for the size of the firm, with technical efficiency.
These hypotheses follow a similar format to those in the second set.
Finally there is a fifth set hypotheses that examines different financial metrics.
The null hypothesis is that SOA is unchanged, and the alternative hypothesis
become recognised in the M&A process. A fourth hypothesis is added to this
set, a non-directional hypothesis, to clarify one of the findings.
There are therefore 14 hypotheses in all.
1.5 Technical Challenges and Contributions to Knowledge
1.5.1 Measurement of Intangibles
The difficulty in quantifying intangibles has posed various challenges to this
research. One example of an intangible factor is the nature of the output of the
R&D process, however, the sector was chosen so a regulatory process
circumvented the difficulty of recognising the worth of an output. A further
aspect relates to the attempts to measure diversification, for example M&A
deals have been categorised in order to examine the effects of diversification,
however in order to do so there needs to be a measure of relatedness. A
measure of relatedness was achieved by identifying whether the acquired
company was located in the same country or had the same industrial
classification as the acquiring company; nonetheless it is recognised that
these simple classifications do not account for a more nuanced situation.
1.5.2 Longitudinal Nature of R&D Pipeline
The use of DEA to measure the comparative efficiency of the pharmaceutical
R&D pipeline between firms in the M&A context is novel1. One possible reason
is because of the difficulties presented by the longitudinal nature of the
pharmaceutical R&D pipeline, whereby outputs in the current time period
depend on inputs in the previous time periods. This research has sought to
address this problem by collecting input data that cover the majority of the
duration of the multiphase R&D pipeline and which exceeds the duration of
any single phase of the multiphase pipeline.
1.5.3 Variety of Outputs
Earlier literature on measurement of R&D efficiency has used a wide variety of
examples of potential outputs from the R&D process, including revenue,
patents and New Drug Applications (NDAs). This variety of outputs has
contributed to the diversity of findings.
The advantage of DEA is that multiple outputs can be considered, so that an
arbitrary choice between potentially valid output parameters does not have to
be made. The selection of the multiple output parameters is undertaken using
the 12 Design Principles (the model design is discussed further in
Section 4.2).
1.5.4 Types of Contributions to Knowledge
The research has produced the following contributions:
Two theoretical contributions by offering:
o additional insight into the Merger Paradox, based on the
divergence of outcomes when PAP is measured in different
ways;
o a theoretically based approach to the selection of multiple
performance measures.
A methodological contribution by introducing a novel means of
assessment of PAP, combining a longitudinal view of M&A history and
the longitudinal nature of the R&D pipeline and the multiple outputs of
the R&D process).
Three empirical contributions regarding:
o scale factors for the R&D pharmaceutical pipeline;
o the statistical distribution of M&A in the pharmaceutical sector;
o differences in measurement of PAP exhibited when ROA and
ROS are used as measures of financial efficiency.
To these can be added a confirmation of a further aspect of the Merger
Paradox, namely that although M&A does not seem to be associated with
higher performance to the acquiring firm, M&A value in total is associated with
more efficient firms (possible reasons for this are elaborated upon later in the
2 Overview of Pharmaceutical Sector
2.1 Introduction
This chapter provides an overview of the research-based pharmaceutical
sector, highlighting the unique characteristics of the R&D process and relating
them to the research methodology.
The R&D process, which is common to all research-based firms in the sector
due to the regulatory environment, is defined. The market structure of the
sector that existed at the time of the analysis (2006 and the preceding decade)
is then summarised. Finally, a review of the merger activity follows, including
expert industry opinion on the motivations of the mergers and their
consequences to the sector and the firms involved, as recorded in published
reports accessed from the University databases.
2.2 R&D Processes
The pharmaceutical R&D process is unusually well-defined and recorded. This
is because of the need to be confident of the safety of future compounds by
undertaking tests on the human population. This has a dual advantage for this
research in that well-defined R&D processes allow measurement of
comparative efficiency and the metrics used in the measurement are publicly
available.
Sweeny (2002: 4) provides a full summary of the pipeline:
– studies to explore the pharmacological activity and therapeutic potential of compounds.
– Preclinical Testing: Toxicology and Safety Testing – tests to determine the potential risk a compound poses to humans and the environment involve use of animals, tissue cultures or other test systems; Pharmaceutical Dosage Formulation and Stability – the process of turning an active compound into a form and strength suitable for human use.
– Regulatory Review: Application to regulatory authority to use compound in human testing. In the USA the compound is then called an Investigational New Drug (IND).
– Phase I Clinical Trials. Testing of a new compound in 20–80 healthy human volunteers to determine tolerance, pharmacological effects, and absorption, distribution, metabolism and excretion (ADME) patterns.
– Phase II Clinical Trials. Trials in 100–300 patients with the targeted condition to determine effectiveness in treating disease or medical condition and short-term risks.
– Phase III Clinical Trials. Trials on 1000–5000 patients to determine clinical benefit and incidence of adverse reactions.
– Process Development for Manufacturing and Quality Control. Engineering and manufacturing design activities to establish capacity to produce in large volumes and to ensure stability, uniformity and overall quality.
– Regulatory Review: NDA. Application for approval to market a new drug. In the USA this is called a NDA.
– Phase IV. Post-marketing trials to identify undetected adverse effects and long-term morbidity and mortality profile.
This process is universally called the ‘pipeline’ and compounds move through
the pipeline in stages. Measurement of a drug in the pipeline can occur at the
following stages: Preclinical, Phase 1, Phase II, Phase III and Awaiting
Approval (i.e. the Phase III trial has been successively completed but
Marketing Authorisation for the NDA has yet to be given).
In practice the pipeline resembles a funnel, with many compounds entering
the start and fewer emerging because the remainder fail to clear the hurdles of
clinical trials. The management of the pipeline is a ‘race against time’. The
patents on which the compound are originally based generally have a 30 year
life, after which any company can produce the drugs on which the patent is
based, in other words it becomes ‘generic’ in the lexicon of the industry. The
longer a compound stays in the pipeline the shorter the exclusive
manufacturing and marketing period; this leads to a considerable loss of
income.
These time factors can lead to variations in approaches to management of
clinical trials. A trial is focused on the use of a compound for a particular
‘indication’: treatment of a condition. Some companies choose to proceed with
trials for as many indications as possible in the hope of gaining multiple
marketing approvals early in the patent lifetime. However, this is also an
expensive strategy because clinical trials are expensive; an alternative
The timing and technology of the clinical trial part of the pipeline has tended to
remain relatively static, with the increase in terms of the reporting
requirements being offset by advances in ICT. However the preclinical stages
of the pipeline have benefited from major technological changes on two fronts:
– product technology, moving from traditional ‘small molecule’ chemical
compounds to biotechnology, where the compounds are large molecules,
derived from biological processes;
– process technology, which has allowed increased productivity in the
screening of potential drug candidates prior to clinical trials.
The latter change has implications, discussed later, for the relevance of
examining R&D inputs to the process in the low productivity era.
2.3 Market Structure and Acquisition Activity
Two industry surveys, Sykes (1999) published near the start of the period of
examination of M&A activity within this thesis and Hamilton (2005) published
near the end, summarise the main issues facing the industry in this period.
Sykes (1999) specifically considers merger waves in the industry, correctly
identifying the start of the third wave which is the focus of this study. M&A
activity frequently follows waves as noted by Schoenberg & Reeves (1999)
who proposed five factors that may affect acquisition activity: industry
profitability, industry growth, industry concentration, capital intensity and
industry deregulation; such factors have been observed in the pharmaceutical
sector, as discussed below. The first M&A wave occurred in 1988–89 and led to the consolidation of a number of middling companies into top-tier firms. The
second M&A wave focused on ‘mergers of equals’ or horizontal mergers
drivers of M&A activity were apparent: improved R&D, improved sales and
marketing cost reduction, and the desire to preserve independence.
Companies were also identified as having different views on M&A, classified
as merger-bent, merger-averse and merger-resistant, the last group preferring
co-licensing deals to full-blown acquisition. As Sykes (1999) was going to
press, the third wave commenced, with mergers involving Astra and Zeneca,
Sanofi, and Aventis. Hamilton’s (2005) study was written at the end of this
merger wave that left the industry in a challenged state: “the pharmaceutical industry continues to experience problems in all aspects of its business”. R&D productivity had declined and some major drugs had been withdrawn from the
market following safety concerns. At that time, the major opportunities were
seen to be the emerging markets of China and India, and growing ageing and
obese populations across the globe. The importance of linking the R&D
strategy to commercial priorities was also emphasised, rather than focusing on
exploiting new development technologies as had occurred previously.
2.4 Key Metrics
The performance of the pharmaceutical industry is measured by financial
metrics similar to those used in other sectors; however, there is one particular
metric that is given universal prominence in the sector, namely R&D
expenditure as a proportion of revenue. For example Pharmaceutical
Research and Manufacturers of America (2010) cites the statistic on its
opening ‘Key Facts’ page, and the synopsis of the sector provided by the
Association of the British Pharmaceutical Industry (2010) remarks: “Research and development lies at the heart of the pharmaceutical industry. It invests 30 per cent of its sales in research…” and then goes on to tabulate R&D as a proportion of sales over time for the sector and to compare the statistic
At the firm level, the metric R&D as a percentage of sales is frequently used to
rank companies by their long-term potential, on the presumption that higher
R&D expenditure leads to greater prospects of future success at the
3 Literature Review
3.1 Introduction
The literature review for this research encompasses:
– the PAP literature from 1968 onwards, including DEA-related literature;
– the RBV, which is the theoretical basis for the selection of performance
measures;
– multidimensional measurement, especially as regards the measurement
of intangibles;
– the application of the RBV in the pharmaceutical sector;
– the small subset of the large DEA literature that considers M&A, R&D or
the pharmaceutical sector.
On analysing the literature it becomes apparent that many topics themselves
are multidisciplinary. M&A in general and PAP in particular have been
considered differently by different academic disciplines; performance
management itself is multidisciplinary, as made clear by an extensive literature
review in Neely et al. (1995). Given this, the literature review concludes with a
synthesis of the various strands of literature as they relate to this thesis.
3.2 PAP
3.2.1 History
The academic literature on PAP has been accumulating for the past four
decades. Weston & Mansinghka (1971) were one of the first to publish on the
This paper and the references set the tone for the subsequent decades. The
paper found that in a sample of 63 firms, active acquirers had lower
profitability than a random sample. Of the prior papers, Reid (1968) found
active acquirers scored higher on criteria related to managers’ interests than
owners’ interests. Smith & Schreiner (1969) found that investment companies
were better at portfolio management than corporate acquirers. Lorie & Halpern
(1970) examined if ‘deception of investors’ in the acquired firm took place but
found the concerns to be unfounded with above-index returns to shareholders
of the acquired firm. Therefore from very early on in the M&A literature the
issues of multiple stakeholders and dubious PAP, at least for the acquiring
firm as distinct from the acquired, were fully recognised.
3.2.2 Meta-Analyses
It is now recognised that PAP is an intellectual construct subject to a variety of
interpretations, and for the past decade there has been an emerging sense of
the need for integration of the literature seeking to unite at least some of the
several theoretical perspectives. Larsson & Finkelstein (1999) seek to do this
by using a structural equation model to assess how synergy realisation is
affected by combination potential, organisation integration and employee
resistance. Nonetheless they recognise that the synergy realisation measure
is less objective than financial or accounting measures. This search for an
integrative approach has also encompassed performance measures
specifically: Zollo & Meier (2008) examined some but not all aspects of this
construct (the ‘Performs for whom?’ question was not posed) when they
undertook a meta-analysis of 87 academic articles on M&A. These papers
have been subject to further analysis as discussed later. This meta-analysis
revealed three broad academic disciplines: strategic management, corporate
used 12 different types of performance measures. The largest group (41%) of
the total used a short-term window financial event-study approach, a method
that typically relies on stock market measures, as do the long-term window
studies (18%) that are finding increasing application in finance journals. The
next most frequent type of measure is the accounting measure (29%), which is
found in the strategic management and organizational behaviour journals,
whose analysis term is a matter of choice but comprises one or more years.
Other approaches attempt a more general assessment of acquisition
performance, including subjective surveys and panels (14%); none of the
remaining approaches total more than 7% of the total. Three broad categories
of measures are therefore observed: finance (short- or long-term window,
59%), accounting (variable term, 29%) and subjective surveys (14%).
Zollo & Meier (2008) add further dimensions to their meta-analysis; firstly they
consider the time dimension by using a two-way taxonomy of short and long
term, acknowledging that acquisitions may be a response to immediate
incentives but whose long-term effect is uncertain. In a second dimension,
Zollo & Meier (2008) also propose a three-level taxonomy: firstly, tasks
involved in the acquisition, secondly the acquisition itself and thirdly the
longer-term performance of the acquiring firm. Considering this three-by-two
classification of measures, Zollo & Meier (2008) then provide plausible
scenarios where the measures of performance may diverge: they establish
that different measures may measure different aspects of the PAP construct
and can be expected to diverge under certain circumstances.
Many of the 87 papers considered multiple measures and 13 examined
accounting performance and one other parameter, as this thesis does;
however, in no case were both accounting and operational efficiency
preference for multiple measures in the literature is an indirect endorsement of
the benefits of multidimensional performance measurement and later in this
review specific literature that confirms the benefit is identified.
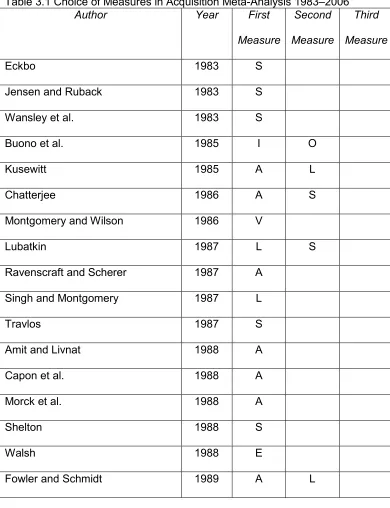
Table 3.1 provides a chronological analysis of the Zollo & Meier (2008) papers
(this analysis was not presented in the original paper) and displays the types
[image:37.595.137.527.252.760.2]of measures used, with some papers considering up to three measures.
Table 3.1 Choice of Measures in Acquisition Meta-Analysis 1983–2006
Author Year First
Measure
Second Measure
Third Measure
Eckbo 1983 S
Jensen and Ruback 1983 S
Wansley et al. 1983 S
Buono et al. 1985 I O
Kusewitt 1985 A L
Chatterjee 1986 A S
Montgomery and Wilson 1986 V
Lubatkin 1987 L S
Ravenscraft and Scherer 1987 A
Singh and Montgomery 1987 L
Travlos 1987 S
Amit and Livnat 1988 A
Capon et al. 1988 A
Morck et al. 1988 A
Shelton 1988 S
Walsh 1988 E
Walsh 1989 E
Datta and Grant 1990 O
Hunt 1990 I O
Lahey and Conn 1990 L
Seth 1990b S
Chatterjee 1991 S
Datta 1991 I O
Franks et al. 1991 S
Harris and Ravenscraft 1991 S
Harrison et al. 1991 A
Hitt et al. 1991 V
Schweiger and Denisi 1991 E
Slusky and Caves 1991 S
Chatterjee 1992 L
Chatterjee et al. 1992 S
Shanley and Correa 1992 I O
Travlos and Waegelein 1992 S
Agrawal et al. 1992 L
Cannella and Hambrick 1993 O A
Hambrick and Cannella 1993 E
Hoskisson et al. 1993 A L
Bruton et al. 1994 O
Clark and Ofek 1994 A L
Markides and Ittner 1994 S
Pennings et al. 1994 V
Berger and Ofek 1995 S
Chang 1996 A
Hitt et al. 1996 A V
Vermeulen and Barkema 1996 V
Weber 1996 I A
Anand and Singh 1997 A
Barber and Lyon 1997 L S
Covin et al. 1997 E
Hayward and Hambrick 1997 S
Holl and Kyriazis 1997 S
Krishnan et al. 1997 A
Kroll et al. 1997 S
Loughran and Vijh 1997 L
Lubatkin et al. 1997 L S
Ramaswamy 1997 A
Hitt et al. 1998 A V
Morosini et al. 1998 A
Bresman et al. 1999 I K
Capron 1999 I O
Haleblian and Finkelstein 1999 S
Larsson and Finkelstein 1999 I O
Thakor 1999 Y
Palich et al. 2000 A L S
Walker 2000 S
Ahuja and Katila 2001 N
Bergh 2001 V
Krug and Hegarty 2001 E
Capron and Pistre 2002 S
Hayward 2002 O S
Heron and Lie 2002 A
Seth et al. 2002 S
Carow et al. 2004 L S
DeLong and DeYoung 2004 A S
Feea and Thomas 2004 A S
Moeller et al. 2004 S
Pangarkar 2004 S
Zollo and Singh 2004 A
Harrison et al. 2005 L S
Shahrur 2005 S
Zollo and Reuer 2005 A L
Homburg and Bucerius 2006 O
Puranam et al. 2006 O
Kapoor and Lim 2007 N
Key to columns 3, 4 and 5:
I = Integration process performance; O = Overall acquisition performance; E =
Employee retention; A = Accounting performance; L = Long-term financial
performance; S = Short-term financial performance; V = Acquisition survival; N
= Innovation performance; K = Knowledge transfer; Y = Systems conversion;
M = Variation in market share.
Table 3.1 shows some trends in scholarship in the examination of PAP. For
the first five years, there are 2.2 papers per year and an average of 1.36
year but with an average of 1.2 measures per paper (i.e. adopting a
one-dimensional view of merger performance). In the past ten years we see a
steady 1.4 measures per paper and an average output of 3.2 papers per year.
Over time therefore the intensity of research has slightly declined but there
has been a greater effort to obtain a multiparameter view.
Another recent meta-analysis of performance measures in PAP is Papadakis
& Thanos (2010), which extended work by Schoenberg (2006) and generally
confirmed its results, showing merger success rates below 50%. Schoenberg
(2006) found no correlation between accounting measures, financial returns
and managers’ subjective assessments, whereas Papadakis & Thanos (2010)
found a correlation between accounting-based measures and managers’
subjective assessments. However, the possibility that the latter (received in a
single semi-structured interview) may have been influenced by the former was
not discussed in the paper. That paper considers case studies explicitly,
although these can be considered a variation on a survey of subjective
assessments, with a sample size of one, with the justification that each merger
is so unique that any attempt at categorisation of findings into measures would
risk distortion.
Another recent meta-analysis by King et al. (2004) considered whether the
acquisition was by a conglomerate, whether it was related by sector, method
of payment and prior experience; it also established the relative popularity of
accounting measures: 29 studies using ROA, 14 using Return on Equity
(ROE) and 9 using ROS. This confirms the preference of ROA to ROE as a
measure of capital efficiency because it does not depend upon the capital
structure of the firm. The relative merits of ROA and ROS as a measure of
Having established that there are four approaches to the measurement of PAP
(or three, if a case study is regarded as a subjective survey with a sample size
of one) and there is little or no correlation between them, it only becomes
possible to choose between them by considering the purpose for which the
measures are being applied. For this thesis, one objective is to examine the
Merger Paradox, namely why M&A continue to be transacted when historically
their results seem to be disappointing overall. The major references and the
strengths and weakness of each method are summarised below so that
judgement can be subsequently made on the most appropriate method for
examination of the Merger Paradox.
3.2.3 Summary of Main Approaches
The theoretical foundation for financial performance is provided by Fama et
al.’s (1969) definition of the event study and Fama’s (1970) definition of the
efficient capital market hypothesis. Forty years later the validity of the
hypothesis is still much discussed, however it has since become the
cornerstone of modern corporate finance theory. The ‘strong’ version of the
hypothesis states that prices reflect all information on a company, whether the
information is public or not. If the hypothesis is true, then the ‘abnormal gains’
of share prices following a merger announcement can be considered the best
possible judgment on its future performance, as expressed as the best
estimation of the value created by that merger. The advantage of the method
is that data are publicly available and the sample sizes are large. Several
studies have suggested that mergers ‘create value’, for example
Jensen & Ruback (1983), Seth (1990b) and Singh & Montgomery (1987).
However, other studies indicate that it is the shareholders of the acquired
companies who have the most consistent gains, for example
Montgomery (1987) and Sirower (1997). There are however two difficulties
with the approach. The first is that the efficient capital markets hypothesis is
still a hypothesis, especially in its strong form (the weak form states only that
prices reflect public information). The second is more fundamental, namely
whether a gain in wealth by the shareholders by the acquired firm (the only
consistent observation) represents a genuine creation of economic value or is
simply a case of overpayment, which will subsequently burden the merged
firm. This raises the multistakeholder question of ‘performance for whom?’
Regarding accounting measures, these also use publicly available data and
large sample sizes are available, and it is possible to monitor performance
over an extended period of time. The use of accounting measures does,
however, have its critics, for example it ignores risks, it treats the cost of equity
and debt finance differently and the measures are historical but not forward
looking, as noted by Montgomery & Wilson (1986). Notwithstanding these
shortcomings, accounting measures are used by managers for decision
making on the future of the firm, including decisions on acquisitions, and by
financial analysts to inform forecasts that affect share prices.
The use of surveys, whether of expert panels or managers, faces the generic
strengths and weaknesses of this approach. Perhaps the greatest strength is
that it is possible to account in the survey for the original motives of the merger
against which to assess success or failure, and Angwin (2007) stresses the
importance of motive in explanation of merger decision making. Set against
this is the potential for subjectivity and selectivity in survey design and tactical
responses to survey questions. The case study reflects an extreme example of
a survey, able to take account of the unique nuances of each acquisition and
generalisation. Examples of this research approach include Haspeslagh &
Jemison (1991), Marks & Mirvis (1998) and Shanley & Correa (1992).
From the preceding discussion on the strengths and weaknesses of
measurement methods and the earlier discussion on meta-analyses of studies
in assessing PAP and the Merger Paradox, two important themes emerge.
The first is to understand what those who initiated the merger expected from it
and the second is the need to understand what happened over a significant
period of time.
3.2.4 Motive and Synergy
Brouthers et al. (1998) established that the top three motives for M&A were to
‘pursue market power’, ‘increase profitability’ and ‘marketing economies of
scale’ in that order. These three motives have guided the design of this
research. Firstly, the reference to ‘profitability’ suggests that accounting
measures are paramount in managers’ minds, and analysis of accounting
performance has been used to illuminate further the Merger Paradox
(significantly ‘profitability’ rather than ‘shareholder value’ was mentioned in the
top three motives, possibly because the latter is seen as being influenced by
exogenous factors); in this thesis, profitability has been measured by both
ROA and ROS. Secondly, regarding ‘market power’ and ‘marketing’, in the
pharmaceutical sector this is tightly coupled with the R&D process because
authorisation for particular markets or applications of compounds can only be
obtained through successful completion of the clinical trial process. Therefore
in this thesis, efficiency of the R&D process has been selected for examination
of the PAP.
Furthermore ‘market power’ is synonymous with ‘collusive synergy’, one of
synergy) and the RBV provides a theoretical base for the examination of
synergies. Overall, synergies should be positive for an acquisition to proceed
and Penrose (1959) (the earliest RBV-related paper) noted the initial
presumption should be that synergies are negative unless there is a special
reason otherwise. However, Rumelt (1984) notes the presence of synergies
where companies diversify into areas where there are common factors.
However, the potential for synergy may not always be realised, and Angwin &
Vaara (2005) suggest there is an appreciation of the need to examine the
degree of integration or connectivity with the firm.
Notwithstanding the multiple motives that are possible for a deal, Ambrosini et
al. (2010) have found that acquirers that opted for a single value creation
strategy, for example consolidation of costs or leverage of resources across a
larger firm, experience higher PAP than those which pursue multiple
strategies. In the pharmaceutical sector this has been confirmed byHiggins &
Rodriguez (2006) who noted positive financial returns to companies that
sought to outsource R&D through the use of M&A to acquire technological
resources.
3.2.5 Diversification Literature
The diversification literature considered synergies in more detail. Chatterjee
(1986) concluded in the Abstract: “collusive synergy is, on average, associated with the highest value. Further, the resources behind financial synergy tend to create more value than the resources behind operational synergy”.
This observation is highly pertinent to the comparison between the financial
efficiency (ROA and ROS) scores, which include all three synergies, and the
Examining the diversification literature more generally, there is a strong
similarity with the acquisition literature. A lengthy period of research, mostly
based on cross-sectional studies, has given rise to conflicting results that are
now the subject of meta-analyses noting the evolution of the research. For
example Martin & Sayrak (2003) note there was initially a view that there was
a discount associated with diversification, there then followed a phase where it
was accepted that a discount existed but that it could be accounted for by
other factors, with the final conclusion that there may actually be a premium
associated with diversification but there is a problem with ‘noisy proxies’ used
to measure diversification, that is the principles for the measurement of
diversification are being queried.
Some authors suggest that relatedness improves performance: Kitching
(1967), Elgers & Clark (1980), Kusewitt (1985), Singh & Montgomery (1987),
Shelton (1988) and Healy et al. (1997). However, as remarked previously, in
some cases the ‘gains’ have included gains to target shareholders and this
may simply reflect overpayment. Therefore there seems to be a consensus
that some relatedness may be beneficial to the extraction of synergy, even
though the earlier view that diversification lowered value is now being
questioned.
Regarding cross-border diversification specifically, Seth et al. (2000) estimated
total gains to be 7.6% of pre-acquisition value (i.e. including gains to target
shareholders), which is comparable with the Bradley et al. (1988) figure for
domestic acquisitions (i.e. there is no special advantage for cross-border
acquisition) and indeed less than that observed in Eun et al. (1996), although
3.3 RBV
3.3.1 Early Definition of the RBV
Although Penrose (1959) and Rumelt (1984) are now considered to be part of
the RBV literature, the modern variant of the RBV was launched by Wernerfelt
(1984) who defined resources as any factor that was a strength or weakness
of a firm. Some examples are given of attractive resources: Machine Capacity,
Customer Loyalty, Production Experience and Technological Leads. These
particular examples have the characteristics of assets and refer to both
tangible and intangible assets; these parameters are potentially measurable.
Rumelt (1984) highlighted the need to consider ‘isolating mechanisms’ that
hinder the imitation of resources and cites ten factors: Causal ambiguity,
Specialised assets, Switching and search costs, Consumer and producer
learning, Team embodied skills, Unique resources, Special information,
Patents and trademarks, Reputation and image, and Legal restrictions on
entry.
Isolating mechanisms complicate the task of the external evaluator: it is not
sufficient to identify and measure a resource, or even to compare this
measurement with that of another organisation (e.g. as occurs in competitor
benchmarking), but one has to anticipate the potential for imitation.
The RBV was interpreted for practitioners by Prahalad and Hamel (1990) who
proposed the concept of a ‘core competency’: defined as an entity that
provides access to a wide variety of markets, and `makes a significant
contribution to perceived customer benefits and is difficult for a competitor to
3.3.2 Qualification of Resources
In the mature phase of the RBV, the perspective moved beyond proposing
candidates for resources to establishing that resources had to have particular
qualities if they were deliver competitive advantage. Barney (1991) proposed
four essential characteristics of resources: Valuable to the company, Rare,
Imperfectly imitable and Non-substitutable (VRIN). These qualities can be
used to screen potential candidates for their relevance to performance
measurement.
Peteraf (1993) provided an alternative set of qualifying factors for resources
when she cited the ‘four cornerstones’ to the RBV:
the heterogeneity of firms, noting that unique resources allow firms to
earn economic rent as opposed to break even;
ex-post limits to competition that limit competition for rents once
resources have been acquired;
imperfect mobility of resources, in terms of their trade;
ex-ante limits to competition, namely that there is limited competition
for resources prior to their acquisition, so as to avoid the potential
profits from being competed away by bidding for the resource.
These economically orientated factors are especially relevant to the selection
of measures because they translate the qualitative concept of competitive
advantage into a quantitative concept of economic rents. This is also highly
relevant to the pharmaceutical industry that can be viewed as earning an
economic rent on intellectual property, namely patented and approved
3.3.3 Dynamic RBV
In the evolution of the RBV it was becoming recognised that having a stock of
resources may be necessary for competitive advantage but it was not
sufficient because resources needed to be deployed: there must be a
corresponding flow, or use, of the resources for some purpose, as Dierickx
and Cool (1989) noted. Amit and Schoemaker (1993) provided a linkage
between the emerging RBV and the earlier Industrial Organisation perspective
framework, and introduced the concepts of ‘capabilities’ that were defined as
the capacity to deploy resources.
The introduction of the concepts of stocks and flows into the RBV is of direct
relevance to performance measurement. One can measure both a stock and a
flow but care must be taken in mixing the two when building a model to
evaluate efficiency.
Teece et al. (1997) highlighted the role of routines and skills in the firm in
regards to the effective deployment of resources, although these factors may
pose a particular challenge to measurement, especially for an external
evaluator.
3.3.4 Critiques of the RBV
There have been a number of critiques of the RBV, for example Foss (1997)
and Williamson (1999), and also a dialogue between Priem & Butler (2001a,
b) and Barney (2001), regarding the Barney (1991) paper. The criticisms
include: the RBV is tautological (instead of explaining how resources lead to
competitive advantage, it assumes the point) and this makes it difficult to
verify, and the RBV does not link resources to value nor does it consider the
This thesis addresses this weakness directly. Beginning with the observation
that for a company to be in the top 50 by turnover, it must de facto be competitive, it then derives the resources that contribute to this success and
uses this as a basis for a performance measurement framework (PMF).
A reassessment of the RBV was also provided by Foss & Knudsen (2003) that
considered the papers of Barney (1991) and Peteraf (1993) as the core
foundations of the RBV, providing the strategic management and economic
bases respectively. However, these two bases were not entirely consistent,
furthermore there were only two necessary conditions for sustainable
competitive advantage: uncertainty and immobility. Peteraf & Barney (2003)
replied, stating in the abstract that: “Unless Resource Based Theory is understood as a resource-level and efficiency orientated tool its contribution cannot be understood fully” and suggest a narrower definition of competitive advantage that focused on intra-industry advantage. This reply is entirely in
sympathy with the approach taken in this paper, where the focus is on
resource-level measurement to assist in the quantification of performance
relative to competition within a single industry.
In conclusion this research accepts the limits to RBV proposed by its founders:
its focus on intra-industry efficiency analysis. In addition, this research seeks
to develop a new perspective for RBV: establishing the causality of resource
possession and competitive advantage. This research is also supported by the
finding in Crook et al. (2008) of a positive association of measures and
performance when those measures are selected by the criteria laid out in the
RBV.
More recently, Kraaijenbrink et al. 2010 identified eight criticisms of which
concepts that resource and value required a more detailed definition and there
was a narrow view taken of competitive advantage.
3.3.5 Recent Retrospective on the RBV
As noted previously, the Journal of Management in September 2011 dedicated a special issue to reviewing resource based theory to
commemorate its previous special issue that introduced the theory 20 years
earlier; in the most recent special issue, Barney et al. (2011) considered it had
reached maturity and was capable of further development to satisfy its critics.
The topic of measurement was also specifically addressed by Molloy et al.
(2011) who examined empirical tests of the RBV and found a lack of
theoretical justification for the selection of the measures chosen, noting in the
opening paragraph:
Resource-based theory (RBT) indicates that intangible resources, or intangibles, underlie value creation (Penrose, 1959). A paradox of RBT is that these very resources that underlie value creation elude examination (Barney, 2001). Indeed, since intangibles are immaterial, scholars cannot easily isolate, observe, or measure them (Lev, 2007). How then are scholars to advance RBT through empirical research that examines intangibles?
Molloy et al. (2011) propose a multidisciplinary assessment process that
draws on the strengths of both economics and psychology. This thesis adopts
an alternative approach of identifying factors relevant to competitive