Capital Structure Determinants: An
Inter-industry analysis For Dutch Firms
Author: Job Groen
University of Twente P.O. Box 217, 7500AE Enschede
The Netherlands
ABSTRACT
This paper will reflect on several propositions that are made in respect to the
capital structure choice of firms. This paper has been motivated by the
importance of the capital structure choice to firms as well as the apparent lack of
evidence for Dutch firms that link theory to practice. The study aims to identify
the most important determinants of capital structure within Dutch firms. It will
also assess if there is an inter-industry variation. Mixed results with respect to
the theory are reported. The results indicate that the capital structure in Dutch
firms demonstrate mixed characteristics of both pecking order theory as well as
some traits of the trade-off theory. Profitability appears to be negatively related
to leverage as well as, Non debt tax shields and business risk. Profitability and
size appear to be positively related to leverage. Finally there appears to be an
industry variation among the industries that are identified.
Supervisors:
Prof. Dr. Rezaul Kabir; Dr. Samy Essa; Dr. Xiaohong Huang;
Henry van Beusichem, MSc & Dr. Peter-Jan Engelen
Keywords
Capital structure, Netherlands , Industry, Pecking order, Trade-Off theory, Determinants, Dutch firms, Leverage
Permission to make digital or hard copies of all or part of this work for personal or classroom use is granted without fee provided that copies are not made or distributed for profit or commercial advantage and that copies bear this notice and the full citation on the first page. To copy otherwise, or republish, to post on servers or to redistribute to lists, requires prior specific permission and/or a fee.
7th IBA Bachelor Thesis Conference, July 1st, 2016, Enschede, The Netherlands.
1
1.
INTRODUCTION
Firms are financed by means of resources and a firm does so via a range of instruments: via debt, equity or hybrid structures. A setting which is often referred to as the Capital structure puzzle by (Myers, 1984) The capital structure choice is one of the most important decisions that firm management are to face in the light of strategic management and allocation of resources. Identifying an optimal leverage will minimise firm costs and hence maximise firm revenue (Zeitun & Tian, 2007). Capital instruments have different properties and theory posits that these provide a firm with different means to balance costs and benefits in order to maximise firm value. Variation of corporate capital structure is often explained through mediating determinants. A range of theoretical frameworks have been developed and significant progress has been made since the fundamental paper on capital irrelevance from (Modigliani & Miller, 1958) from now abbreviated as M&M. In this prominent paper M&M state that debt and equity are fairly similar and hence perfect substitutes for one another. However various eminent theories demonstrate different findings and no uniform solution has yet been given that solves the capital structure puzzle. Literature has identified a vast potential of determinants of capital structure however fairly few general principles have become evident (Harris & Raviv, 1991) Following the paper of M&M several theories were introduced all with the endeavour of trying to solve the capital structure puzzle and amend the assumptions previously made. Two broadly defined theories that extend the knowledge on this subject are the Trade off theory (TOT) and the Pecking order theory (POT).
In the light of the M&M debate the Trade-off theory was introduced opting that a firm will balance the tax advantage against the various leverage related costs and will set a target debt ratio. (Litzenberger & Kraus, 1973) argued that the this optimal leverage ratio reflects a trade-off between the tax benefits of debt and the deadweight costs of bankruptcy. Contrary to this view stands the Pecking order theory stating that a firm prefers internal finance over external financing and firms demonstrate a preferred order of issuing capital i.e. internal finance over debt in which equity would only be issued as a last resort. The POT argues that a firm does not demonstrate a well defined target debt ratio as opposed to the Trade off theory. A firm is able to issue either internal or external equity; and according to (Myers, 1984) “each firm's observed debt ratio reflects its cumulative requirements for external finance” meaning that a firm will issue the safest security first rather than adhering to a pre-defined mix. This preferred order is mainly driven by information asymmetries between the principal and its inherent costs in the form of under-investment and overpricing.
The question that literature tries to grasp is why some firms tend to issue debt and hence have a deviating leverage as compared to other firms that use internal funds or issue equity instead. Theory on capital structure tries to reflect and relate firm characteristics to a certain amount of leverage and derive how capital structure is to be explained by these characteristics. Relaxation of the perfect capital market assumption by MM and the recognition of market imperfections led to the introduction of capital structure determinants (Michaelas, et al., 1999) the so called drivers of capital structure that could potentially explain the variation in debt ratios across firms (Titman & Wessels, 1988) As said it are these attributes that determine the costs and benefits associated with debt and equity (Titman & Wessels, 1988) It are also these attributes that this study will assess in order to derive to what extent these attributes have influence on
capital structure in Dutch firms. This paper will assess the Capital structure of Dutch firms and reflect whether and to what extent the theory is relevant for the capital structure of firm in the Netherlands. This study will also examine if there is an industry variation in order to extent knowledge on this subject for Dutch firms in particular.
2.
LITERATURE REVIEW
The following section will provides an overview of the prominent literature on capital structure. It will discuss the various perspectives and underlying rationale of the theories.
2.1
Modigliani &Miller
Fundamentals of the Modern theory of capital structure were provided by the well known authors (Modigliani & Miller, 1958) arguing for the irrelevance of capital structure under pre-defined conditions that is in a market without taxes, bankruptcy costs and agency related costs. In their paper they question the costs of capital and the relevance of capital structure for firms (Modigliani & Miller, 1958) from now on referred to as M&M. M&M argue that in a world without uncertainty i.e. a market without taxes, bankruptcy costs, systematic information and no information asymmetry the difference between debt and equity is largely reduced to one of terminology. Meaning there is no justified reason for managers to acquire debt over equity or vice versa since this will not affect firm value under the predefined conditions. This proposition implies that the debt-equity capital mix does not influence the value of the firm as it solely changes a firms internal cash flows. From here it follows that there is no optimal debt equity ratio since market value of a firm is independent of its capital structure. A vast number of theories have explicated the relevance of capital structure to firms subsequent to the theory of M&M . This paper will elaborate on these in the forthcoming sections.
2.2
Trade off theory
The static trade off theory was a jointly formed answer to the largely debated MM theory that assumed a perfect world, a statement that can be dismissed right away since these conditions are largely unrealistic. The trade off theory argues that firms will have an optimal debt ratio that is determined by the trade off between the leverage related costs and benefits of issuing debt. This implies that a firm will balance bankruptcy costs against the beneficial tax gains of debt giving rise to an optimal capital threshold that a firm will gradually move towards (Myers, 1984). This effort of continuous trade-offs will result in maximisation of firm value. (Miller, 1977) shows that when the effective corporate tax rate is higher than the personal tax rate on interest the benefits of tax will offset the costs and a firm can achieve a positive net tax advantage and debt would become favourable under these conditions. It implies that the tax rate faced by investors reduces the tax benefit of debt and hence reduces the incentive to issue debt (Miller, 1977) The trade off theory has produced several of theoretical extensions among which the agency based and tax based theories.
2.2.1
Tax based model
can argue that the tax based approach presents the optimal leverage as a financing mix that balances the tax advantage of debt and the bankruptcy costs of debt (Myers & Shyam-Sunder, 1999) This implies that the debt ratio is an inherent result of the optimisation of the capital structure of a firm.
2.2.2
Agency based model
The agency theory of capital structure has been advanced in the light of the trade off theory and it also comes in extension of the trade off theory. It results from the statement that the tax based theory argues that in absence of tax subsidies firms will not issue debt if bankruptcy costs are positive, which gives us in fact an incomplete theory (Jensen & Meckling, 1976) The agency theory assumes various leverage related costs that could potentially be reduced or mitigated by issuing debt. It extends the asymmetric information model by addressing the relevance of agency related costs. These costs stem from the divergence of interest due to separation of ownership. Often is this occurs between one person or the shareholder (referred to as the principal) and the other person, manager, engaged within the agency relationship (referred to as the agent) (Jensen & Meckling, 1976) The involved costs are inherent to this relationship and accumulated through monitoring costs, bonding cost and reduced welfare that is a residual loss as a result of suboptimal decisions.
(Jensen, 1986) argues that debt can serve as an effective substitute for equity and is able to reduce the agency costs of free cash flows. Debt reduces the amount of free cash flow available to managers and prevents manager from making suboptimal investment decisions accordingly. Suboptimal investments may increase default probability and in case of default, debt holders may get a claim on the firm’s assets after bringing the firm to court. This particular problem resulting inherent to managerial discretion is often referred to as the overinvestment problem.
Also if a firms is to pay out dividends on equity, when it has a net cash surplus, it is penalized by the stock market by signalling overvaluation of the firm which results in dropping stock prices. Debt can effectively substitute dividends and pay out future cash flows by ensuring that the firms pay out interest and principle payments (Jensen, 1986) Debt can reduce the discretion of managers by bonding them to a promise of repayment hence reducing the agency costs i.e. debt fulfils a disciplining role something that equity fails to do. As leverage has benefits it also carries costs in the form of bankruptcy costs. The agency approach also stresses the optimal debt equity ratio as it also recognizes the point where marginal costs just offset the marginal benefits.
Another agency problems could occur between debt- holders and shareholders. This agency conflict results from the transfer of wealth from the former to the latter. These problems imply that debt holders will claim a higher risk premium as a cover for potential losses as they are aware of this wealth expropriation by shareholders (Dijk & Jong, 2007) As a result the burden to issue debt is increased that is inherent to a reduced leverage.
2.3
Pecking order
The pecking order theory was largely developed under (Myers, 1984) but previous work had already shed light on the preferred order of finance by firms. The theory has been broadly defined and stresses the firms reliance on internal funds rather than seeking external funds to finance their future investments. (Myers & Majluf, 1984) discuss the concept of information asymmetry and elaborate on how this model explains the tendency of firms to rely on internal funds rather than seeking external finance. (Myers & Shyam-Sunder, 1999) argue there is no well defined optimal debt ratio, and provide us with the
statement that “firm debt ratios are driven by the need for external funds, not by any attempt to reach an optimal capital structure” (p.221) In other words this means that the debt equity ratio is solely a cumulative outcome of previous financing decisions to fix an imbalance of internal cash flows rather than an trade off approach to reach an optimal structure.
Myers and Majluf propose a model based on asymmetric information and assume firms behave perfectly rational and will act to the interest of the passive, incumbent stockholders. Myers and Majluf argue that firms have preferred order of financing and consider three potential sources of funding that are, retained earnings or slack, debt and finally equity preferred in respective order. This implies that equity is the least preferred form of financing behind debt and retained earnings. (Myers & Majluf, 1984) provide us with the statement that in equilibrium firms may pass upon valuable investment opportunities by refusing to issue stock due to price discounts enforced by the market. That means if a firm is to issue equity it will send a over-optimistic signal to the market and potential investors. By issuing equity a firm might convey that it is overvalued resulting in a correction by the stock market i.e. dropping stock prices.
This implies that if a firm would issue equity a conflict between old stockholders and new investors would arise due to dilution of shares. Therefore a firm might forego external financing in the form of equity. Similarly this means that in situation where firm would in fact need to issue external funds that is in case of limited or inadequate slack it would prefer low risk bonds over stock. This is due to the fact that the information asymmetry now relates to the risk that debt carries rather than the information asymmetry over firm value. In other words the difference between debt and equity rests on the risk premium they both held, due to the fact that debt has minor adverse selection costs and equity has higher adverse selection costs, debt is favoured over equity (Frank & Goyal, 2003)
From these arguments it follows that slack in the form of retained earnings, spare debt or cash surplus can prove value to a firm by allowing it to completely avoid external financing.
2.4
Industry characteristics
3 conservative attitude from banks (Chen & Jiang, 2001). (Jong, 1999) confirms this view by stating “that the market for corporate control is virtually absent due to highly effective takeover defences, and the presence of relationships between banks and firms that might serve as disciplinary devices” (p. 57). These conditions might have a significant influence on the relationship of the determinants to firm leverage. Also this study will check if there is an industry variation as (Bowen, et al., 1982) argues that firms within a industry are more similar and these firms tend to retain an relative leverage to one another. It is argued that firms exhibit the tendency to move towards an industry mean and thus tend to be more similar in terms of their leverage. (Jong, et al., 2006) articulated that a firm’s industry might serve simply as a reference point from which firms derive their capital structure decisions. Following these arguments this paper will analyse inter-industry differences and assess whether these are supported in case of Dutch firms.
3.
STATEMENT ON HYPOTHESISES
Empirical studies and literature have suggested a range of possible firm specific determinants of capital structure that could influence the debt equity mix. These determinants are theoretical concepts often defined by several proxies. These proxies are accounting factors that reflect these concepts and allow for measurement of the determinant. This study will include determinants that are commonly used as explanatory variables. Theory has identified a vast potential of determinants but according to (Harris & Raviv, 1991) “These studies generally agree that leverage increases with fixed assets, non debt tax shields, growth opportunities, and firm size and decreases with volatility, advertising expenditures, research and development expenditures, bankruptcy probability, profitability and uniqueness of the product” (p . 334)
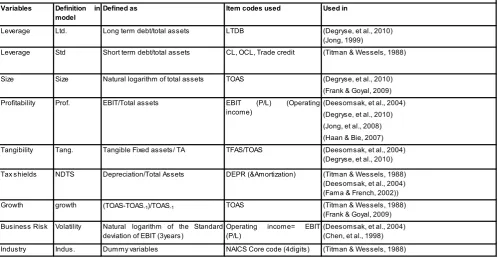
We will now reflect on the explanatory variables used in this paper from Dutch firm perspective. We will construct several hypotheses on these particular determinants and we will also define the accounting metric used to reflect the attributes. A summary of the definitions and metrics will be displayed in table 1.
(Insert table 1. here
1)
3.1
Size
Both the static trade off theory as well as the pecking order theory hypothesise a positive relationship between the size of the firm and the leverage ratio. The static trade off theory suggests that larger firms have a lower risk of financial distress due to the fact that larger firms tend to be more diversified in their investment projects (Chen, et al., 1998) and hence find it easier to acquire debt financing. Also (Warner & Gruber, 1977) shows that bankruptcy costs are significantly smaller for firms of considerable size. Size can thus be seen as an inverse proxy of the probability of default (Zingales & Rajan, 1995) Accordingly as the costs of debts decrease we expect leverage to increase i.e. larger firms will issue more debt due to the diminishing costs.
Also as the pecking order theory suggest larger firms tend issue more debt due to the fact that large firms tend to have fewer information asymmetries and hence be less aversive toward external funding in the form of debt. Increased diversification and less earning volatile mitigates asymmetric information problems (Degryse, et al., 2012)
H1: There is a positive influence of size on the leverage of a firm
1Provided in the appendix
3.2
Profitability
There is no uniform consensus on the effect that profitability will have on the leverage of firms. The static trade off theory predicts that profitable firm will issue more debt and hence debt would be positively related to profitability. A higher debt ratio would result from the fact that bankruptcy costs of firms are lower and interest tax shield become more valuable as tax rates are progressive (Frank & Goyal, 2005) Higher profitability is inherent to a higher effective tax rate hence there is an increased benefit from tax reductions. Also as (Hinloopen & Haan, 2003) note firms with ample financial slack will likely faces lower financial distress hence increase their optimal debt ratio. Also under the agency perspective more debt is likely to be allocated since the debt obligation reduces the amount of free cash flow and prevents managers from making suboptimal investment decisions (Jensen, 1986) A negative relationship is suggested by the pecking order theory (Myers & Majluf, 1984) It suggest that that profitable firm will have more retained earnings in the form of slack and will not issue debt to fund investments. Ample internal funds will limit the incentive of a firm to issue external funds. Although there are conflicting theoretical predications we expect a negative relationship between leverage and profitability.
H2: There is a negative influence of profitability on the leverage of a firm
3.3
Tangibility
Tangibility refers to extend which a firms possesses physical assets. The ownership over physical assets can provide a valuable collateral in order to raise secured debt (Chen, et al., 1998) These tangible assets also suffer from smaller value losses if a firm is subject to financial distress and hence reduce costs of distress (Frank & Goyal, 2005) From an agency perspective tangible assets reduce the agency costs by preventing asset substitution that is a form of wealth expropriation. (Jensen & Meckling, 1976) Meaning secured debt mitigates potential substitution of high risk assets for low risk assets, resulting is a lower risk premium charged by debt holders (Johnson & Stulz, 1985) The pecking order theory stresses the effect of asymmetric information on the leverage ratio. Increased tangibility reduces the this information asymmetry between managers and investors on firm value hence this suggest a positive relationship between tangibility and leverage. Hence we expect tangibility to be positively related to firm leverage
H3: There is a positive relationship between tangibility and leverage of a firm
3.4
Growth
Again different predictions can be made on the hypothesis of growth with respect to leverage, quite some uncertainty exists around this explanatory variable.
that is derived from the increased need for debt finance in firms that achieve high growth. This capital need can only by met by issuing debt if internal funds are not sufficient (Myers & Majluf, 1984) Equity will not be issued since it will result in under pricing of the shares and hence impair a net loss to existing shareholders (Raviv & Harris, 1990)
Shareholder power is limited within Dutch firms which results in a fair amount of discretion for firm managers. This would imply high agency costs. But due to the disciplinary role of banks that especially in the Netherlands play a big role we expect growth to be positively related to debt.
H4: There is a positive influence of growth on the leverage of a firm
3.5
Earning Volatility
The business risk of a firm or the earning volatility refer to the variation in income and the inherent risk involved. Increased earnings volatility will result in a higher costs of financial distress due to a higher probability of default if a firm cannot meet is debt obligations. This will in turn result in a lower incentive to issue debt. Business risk could be seen as a proxy for financial distress and hence probability of default on any debts. Therefore higher leverage is inherent to a higher risk and consequently firms with higher volatility tend to issue fewer debt. (Titman & Wessels, 1988) The pecking order theory also expects a negative relationship between earning volatility and Leverage due to the fact that debt holders will charge a higher risk premium due to earnings volatility and uncertain earnings. H5: There is a negative influence of earnings volatility on leverage
3.6
Non debt tax shields
Under the trade off theory tax advantages are the main driver for issuing debt. Tax shields such as depreciation can also be used to reduce the corporate tax liability. It follows that with the increase of non debts tax shields the benefit of tax reduces (Deesomsak, et al., 2004) Also (DeAngelo & Masulis, 1980) show that the extent to which corporate non debt tax shield substitutes for debt varies across firms implying that the debt leverage decision is an unique optimum for a firm. Providing evidence for the Trade of theory stressing the existence of an optimal target leverage.
H6: There is a negative influence of NDTS on the leverage
3.7
Industry
As mentioned earlier there could be variation between industries. (Titman & Wessels, 1988) suggest that the extent of specialization could influence the amount of debt a firm would take on. Less debt should be taken on in industries characterized by high costs of liquidation. (Kim, et al., 1984) find that leverage ratios are strongly related to industry classifications. And as (Bowen, et al., 1982) postulates industry differences exist and firms have the tendency to move towards an industry median. It also could indicate that the industry reflects a set of otherwise omitted variables (Goyal & Frank, 2009) The TOT opts that firms will have an target leverage that they gradually move towards and hence post that industry effects should be observed.
H7: The firms specific coefficients are not equal across the four industries.
4.
DATASET AND METHODOLOGY
4.1
Method of analysis
In this research the firm specific determinants of leverage are explored. It are these determinants that will provide insight in the choices firms make in order to define its capital structure.
The impact of the firm specific variables on the leverage of Dutch firms will be determined. Industries dummies will be used as control variables in order to test for variance between industries. In this section will briefly explain how the model and variables are specified. The panel data is expected to fit a linear model hence a cross sectional ordinary least square regression (OLS) will be conducted with the determinants as a function of the independent variable, leverage. This method is used among in (Yazici, et al., 2013) (Deesomsak, et al., 2004) (Zingales & Rajan, 1995) This analysis will allow one to assess if and to what extent the dependent variables are influenced by independent variables. In the regression model the independent variables will be lagged one year behind the dependent variables in order to isolate the effects and prevent potential reverse causality (Deesomsak, et al., 2004) but also (Titman & Wessels, 1988) This lag also serves as a check for the independence of observations.
The following chapters will provide the analysis leading to our conclusions. A summary of the variables will be given by means of descriptive statistics that will give an overview of the independent variables used in this study. Subsequently a bivariate analysis of the independent variables will be conducted in order to provide insight in the relationship between the independent variables. Finally an OLS regression will be conducted that allows us to check our hypotheses on the data.
4.2
Measurement of the variables
4.2.1
Dependent variables
As mentioned the leverage ratio is taken as the dependent variable in this analysis. Two measures for the dependent variable leverage are used: Short term leverage and long term leverage as (Titman & Wessels, 1988) argue that they may have different properties. For short term debt no pre-defined criteria was appropriate therefore short term debt is constructed as debts due within one year and is derived from the balance sheet as ‘current liabilities’ minus ‘other current liabilities’ & ‘current trade liabilities’ This means trade credits are excluded. Long term debt is defined as outstanding debt to be paid after one year. Both measures are divided by the total assets of the firm. The independent variables are derived from literature and will be specified below. For all specified variables book values will be used as book values refer to assets that are already in place and do not account for assets not yet in place. (Myers, 1977) And it are these premises that managers base their investment decisions on i.e. debt is supported by the assets currently in place rather than future growth. The definitions long term debt and Ltd. will be used interchangeably as well as short term debt and Std.
4.2.2
Independent variables
Profitability is defined as the operating income to the total assets (Yazici, et al., 2013) (Fama & French, 2002) (Deesomsak, et al., 2004) (Titman & Wessels, 1988)
Tangibility is defined as the ratio of tangible assets scaled to total assets (Yazici, et al., 2013)
Size is defined as the natural algorithm of total assets (Yazici, et al., 2013) (Titman & Wessels, 1988) natural logarithm is used in order to scale the assets proportionally to other firms. And control for linearity &normality.
Growth is defined as defined as the percentage change in total. Assets (Degryse, et al., 2012)
5 scale the income proportionally to other firms. And also control for linearity and normality. This is consistent with the approach of (Chen & Jiang, 2001) that show this leads to an improvement in the robustness of the parameter estimates.
Non debt tax shields is calculated as the annual depreciation & amortization weighted to the total assets (Titman & Wessels, 1988) (Fama & French, 2002) Also Industry dummies are included in the analysis that will control for any differences related to a firms industry (Titman & Wessels, 1988)
Firms will be assigned to an industry according to the NAICS 2012 reference model. Primary codes are used to assign firms to their corresponding industry.
I. Codes ranging from 1000 to 2200 are defined as mining (MINE 1 and all others are 0)
II. Codes ranging from 2200-2400 defined as agriculture and construction and are combined into a variable (CON 1 and all others are 0)
III. Codes ranging from 3100-3400 Manufacturing firms combined into a variable (MANU 1 and all other 0) IV. Codes ranging from 4200-5000 are Transportation,
wholesale and retail and are combined (WHOLE 1 and all other 0)
V. Codes ranging from 5100 are service firms, information services and other (SERV 1 and all others are 0)
As mentioned utilities, financial companies and Public administrations are excluded from dataset and hence also from the industry variables. The industry variable service will be used as a reference variable and is therefore excluded from the regression equation.
Our model is specified as:
Where
= The vector of the explanatory variables, the dependent variable,
leverage at time j of firm i expressed as the short term debt (Std.) ratio or the long term debt ratio (Ltd.)
=Coefficients for the independent variable
i=1,....,N and i= firm and n=number of firms t=1,...,J and j=Period of time in years and t=the year
= Error term
4.3
Data and sample
The study will collect data on from Orbis, an extensive database of international firms and corporations. The database contains over 200 million records and allows one to specify criteria to conduct a detailed analysis of the capital structure of firms. This paper will assess the financial accounts of firms over a period of 4 years ranging from 2010 until 2013. Since the independent variables are lagged one year behind the dependent variables are collected from a time period of 2011 till 2014. This period is chosen since it would provide the study with the most decent amount of observations. These accounts are retrieved through the database and standardized for our needs. This study will make use of unbalanced panel data i.e. data retrieved over a certain period of time across several entities, in our case firms, without exclusion of firms with missing values.
The sample will include all listed as well as formerly listed firms in the Netherlands, financial firms are excluded from the
sample as well as utilities since financial institutions face regulatory capital requirements and hence may have a different capital structures (Degryse, et al., 2012) Also non-operative firms and firms without continuous records will be removed from the sample. The final dataset contains unbalanced data meaning that some firms may report missing values and hence appear fewer times in the observations. Ultimately the datasets encompasses 186 firms. The dataset requires non missing values for either Short term debt or Long term debt, if not the firm is excluded from the dataset. Firms with incomplete accounting data for the independent variables are not completely removed from the data sample since this would significantly lower our sample size and hence reduce our reliability to a great extent. Removing firms with incomplete data could induce a survivorship bias (Goyal & Frank, 2009) Using unbalanced data is a more recent approach. Initially this would result in 732 firm year observations. However the data is controlled for outliers by following the outlier labelling rule (Tukey, et al., 1986) with a revised constant of 2.2 for a more optimal threshold (Hoaglin & Iglewicz, 1987) This rule provides cut-off points as to which a observation is flagged as extreme and excluded from the analyse accordingly. As a result the sample size is scaled down to 469 observations.
Several filters have been applied in order to create our database of firms:
Only firms that are currently public and formerly listed in the Netherlands are included in the sample
Only firms with available accounts in the sampling period are included
Financial firms and utility firms are excluded
Non operative firms will be excluded from the sample as well as firms with an unknown situation
Firms are segmented according to industry characteristics using the NAICS2 classification.
Firm should have a value for either Std. or Ltd . variable
5.
RESULTS AND DISCUSSION
5.1
Regression assumptions
The forthcoming sections will provide a summary of the statistics, a bivariate correlation matrix and subsequently provide a report on the regression analysis. In order to justify the linear model used in the regression several assumptions are tested. In order to examine the normality of the distribution the histograms and the residuals are visually analysed. The p-p plots show a normal distribution as the residuals fit the diagonal line fairly close. The histograms however are somewhat skewed but do not provide great disturbance since the reported values for skewness are between -1 and +1 and considered acceptable also the values for the kurtosis remain close to 1. No outliers are observed in the box plot and histogram. Finally the histogram shows a fairly normal distribution.
Theory supports the notion of linearity in the case of our independent variables. Nonetheless linearity between the response variables and the predictors is checked by plotting the variables against each other and fitting a linear regression line in the scatter plot. The linearity assumption is met since the variables are evenly distributed along the line.
extent for the other variables. This indicates mild form of heteroscedasticity. Consequently this might bias the result to a limited extent and should be conservative in making assumptions.
5.2
Descriptive statistics
A summary of the statistics is presented in table 2. In order to give an overview of the distribution of the variables employed in this research. It should be noted the variable short term debt is subject to a lot of missing data. Also the independent variable depreciation has a relatively low number valid cases. As displayed in the table the overall difference between the mean and median shows the data is fairly even distributed around the mean indicating an equal spread and no severe outliers.
The data show no severe outliers both on the scatter plots of the standardized residuals as well as on the histograms. The descriptive statistics show a mean of 0.060 for the Std. ratio and a mean of 0.192 for the Ltd. ratio. The dependent variable Ltd is fairly in line with earlier findings off (Chen & Jiang, 2001) that find a value of 0,189 for long term debt and a value of 0.106 for short term debt. However the short term debt is relatively smaller compared to the finding of (Chen & Jiang) They also find a value of -0,963 for earning volatility whereas our study finds a value of -0,48. The negative sign is due to the logarithmic transformation of the variable and therefore not strange.
In another respective study (Chen, et al., 1998) find a value of 0.082 for profitability, 0.63 for tangibility and 13,34 for size whereas our study reports values of 0.057, 0.23 and 13.32 respectively. In a subsequent study of the (Jong, 2002) he finds a value of 0.132 on long term debt, 0.026 on NDTS and 0.556
on tangible assets, whereas our study report: 0.192, 0.041 and 0.23 respectively. These differences might be due to the sampling period and the fact they only account for listed firms and did not include formerly listed firms.
5.3
Bivariate statistics
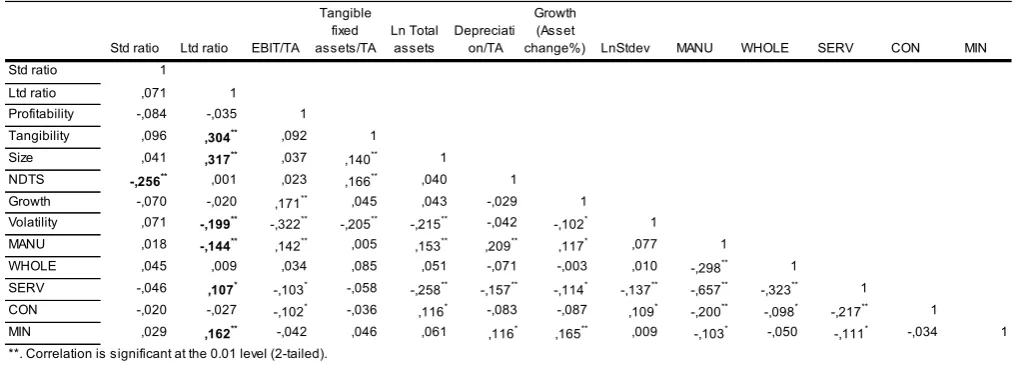
The bivariate analysis reports on the correlation between the variables used in the regression. Table 3. presents the statistics. A Pearson statistic is used to report on the correlations between the independent variables; firm Size, Profitability, Business risk, Tangibility, NDTS, Growth and both dependent variables, short term leverage and long term leverage.
When analyzing the correlations among the variables a few things become evident. Significant correlations can be found between short term debt and depreciation. This correlation is found to be negative which supports our expectation that business risk is negatively related to leverage. However no significant correlations are found among the other variables with respect to short term debt. When observing the other dependent variable, the long term debt ratio, it is noted that there is a significant correlation between tangible fixed assets and long term debt. The correlation shows a positive sign which is in line with our expectation. It should follow that a higher ratio of tangible asset initiates a higher amount of long term debt. Also a significant positive correlation is observed between the proxy variable total assets and long term debt. This positive correlation supports the expectation that there is a positive relationship between the size of the firm in question and the long term debt a firm takes on.
Finally a significant negative correlation is observed between the log standard deviation of income and the long term debt ratio. This finding also is in consensus with the expectation that a higher business risk is related to a lower long term debt ratio. If the dummy variables for the industries are investigated a few interesting things become evident. The manufacturing industry shows a significant negative correlation with the long term debt ratio. Indicating that manufacturing firms tend to be lower levered with respect to long term debt. Subsequently a significant positive correlation is observed between the service industries and the long term debt ratio. Indicating that firms in this industry are associated with more debt. Also a significant positive correlation is found between the mining industry and the long term debt of a firm. Indicating that the mining industry is higher levered with respect to long term debt. These industry correlations are largely consistent with the expectations
Valid Missing
[image:7.595.54.287.229.349.2]Std ratio 269 200 0,06071 0,03957 Ltd ratio 451 18 0,19201 0,16340 Profitability 458 11 0,05753 0,05559 Tangibility 467 2 0,23011 0,18122 Size 469 0 13,32649 13,29377 NDTS 327 142 0,04184 0,03776 Growth (Asset change%) 469 0 0,01466 0,01088 Volatility 410 59 -0,48059 -0,41244
Table 2. Descriptive statistics
N
Mean Median
Std ratio Ltd ratio EBIT/TA
Tangible fixed assets/TA
Ln Total assets
Depreciati on/TA
Growth (Asset
change%) LnStdev MANU WHOLE SERV CON MIN
Std ratio 1
Ltd ratio ,071 1
Profitability -,084 -,035 1
Tangibility ,096 ,304** ,092 1
Size ,041 ,317** ,037 ,140** 1
NDTS -,256** ,001 ,023 ,166** ,040 1
Growth (%change)
-,070 -,020 ,171** ,045 ,043 -,029 1
Volatility ,071 -,199** -,322** -,205** -,215** -,042 -,102* 1
MANU ,018 -,144** ,142** ,005 ,153** ,209** ,117* ,077 1
WHOLE ,045 ,009 ,034 ,085 ,051 -,071 -,003 ,010 -,298** 1
SERV -,046 ,107* -,103* -,058 -,258** -,157** -,114* -,137** -,657** -,323** 1
CON -,020 -,027 -,102* -,036 ,116* -,083 -,087 ,109* -,200** -,098* -,217** 1
MIN ,029 ,162** -,042 ,046 ,061 ,116* ,165** ,009 -,103* -,050 -,111* -,034 1
**. Correlation is significant at the 0.01 level (2-tailed). *. Correlation is significant at the 0.05 level (2-tailed).
[image:7.595.44.556.572.756.2]7 formulated earlier and are promising for the OLS regressions. However no correlations are to be found significant between-both dependent variables and the variables Profitability, Growth and neither the two dummy variable for the industries construction (CON) and wholesale (WHOLE).
Also several other significant correlations are observed among multiple independent variables. For instance among business risk and asset tangibility, firm size, and operating income. However these correlations are not causing a problem of multicollinearity. The variables are checked by assessing the requested variance inflation factors (VIF) and their tolerance threshold. No correlation over 0,7 is observed and all the values indicated a value lower than 2.2 and a tolerance higher than 0,2 The values are checked for both dependent variables and no worrisome variables are observed.
5.4
Multivariate OLS
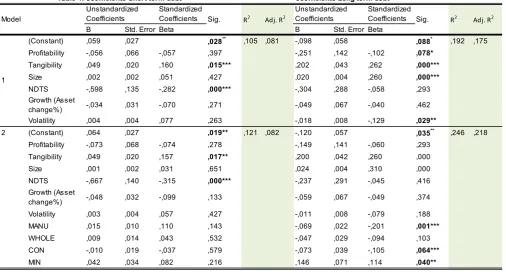
The results of the OLS regressions are presented in table 4. The regression displays two different models for each regression. In the first part of the model only the independent proxy variables are regressed on the dependent variables. In the second part of the model the industry variables are also introduced in the regression. Two regressions are conducted, one for the Ltd. variable and one for the Std. variable. As both short term debt as long term debt represent a form of leverage both findings will be reported in the light of the independent variable. This will allow us to summarize the findings in a comprehensive way and comment on the findings for each variable. Also a regression analysis with yearly selection criteria was conducted for the years 2010-2013. However this analysis did not yield eligible results and are therefore not further analysed. As can be seen from the table below both models display statistically significant predictive quality. The regression on long term debt accounts for 19.2% of the variance and 24.6% if the industry variables are included in the model. The Std. reports a value of 10,5% and 12,1%. The inclusion of industry variables does not
improve the model for short term debt to a great extent as can be seen from the adjusted R2 For long term debt however the
descriptive power is increased as can be seen from the increase of 17.5% to 21.8%.
Starting with the relationship of profitability to a firms leverage. A negative relationship of profitability on the leverage of a firm was hypothesised. A significant relationship at a 10% significance level can be found between the long term debt ratio and the profitability of a firm. The unstandardised coefficient report a value of -0.251 indicating that a unit change in profitability will result in a unit decrease of 0.251 in leverage. However the coefficient of short term debt is not significant indicating that the short term debt is not influenced by the profitability of a firm. This finding supports evidence on the pecking order for Dutch firms that assumes leverage to decrease as a result ample of internal funds. This finding is largely consistent with the finding of (Jong, et al., 2007) that find a coefficient of negative 0.295 approximating our observation. Subsequently the regression on long term debt finds a significant positive relationship between the tangibility of a firm and the long term debt issued. This is in consensus with the significant relationship found between short term debt and tangibility. Both coefficients show a positive relationship with tangibility although the long term debt has relatively more impact as it report a coefficient of 0.202 versus a coefficient of 0.049. With these findings we fail to reject the null hypothesis on tangibility stating that there is a positive relationship between tangibility and firm leverage. This findings is in line with (Jong, et al., 2007) that also find a significant positive relationship between tangibility and leverage.
Moreover a significant positive relationship is found between the total assets of a firm and the long term leverage of a firm. As the total assets reflect the size of a firm the positive finding would translate into a relationship where the size of a firm would results in an increased amount of long term debt issued.
Standardized Coefficients
Standardized Coefficients
B Std. Error Beta B Std. Error Beta
(Constant) ,059 ,027 ,028** ,105 ,081 -,098 ,058 ,088* ,192 ,175 Profitability -,056 ,066 -,057 ,397 -,251 ,142 -,102 ,078*
Tangibility ,049 ,020 ,160 ,015*** ,202 ,043 ,262 ,000***
Size ,002 ,002 ,051 ,427 ,020 ,004 ,260 ,000***
NDTS -,598 ,135 -,282 ,000*** -,304 ,288 -,058 ,293 Growth (Asset
change%) -,034 ,031 -,070 ,271 -,049 ,067 -,040 ,462 Volatility ,004 ,004 ,077 ,263 -,018 ,008 -,129 ,029**
2 (Constant) ,064 ,027 ,019** ,121 ,082 -,120 ,057 ,035** ,246 ,218
Profitability -,073 ,068 -,074 ,278 -,149 ,141 -,060 ,293 Tangibility ,049 ,020 ,157 ,017** ,200 ,042 ,260 ,000
Size ,001 ,002 ,031 ,651 ,024 ,004 ,310 ,000
NDTS -,667 ,140 -,315 ,000*** -,237 ,291 -,045 ,416 Growth (Asset
change%) -,048 ,032 -,099 ,133 -,059 ,067 -,049 ,374 Volatility ,003 ,004 ,057 ,427 -,011 ,008 -,079 ,188
MANU ,015 ,010 ,110 ,143 -,069 ,022 -,201 ,001***
WHOLE ,009 ,014 ,043 ,532 -,047 ,029 -,094 ,103
CON -,010 ,019 -,037 ,579 -,073 ,039 -,105 ,064***
MIN ,042 ,034 ,082 ,216 ,146 ,071 ,114 ,040**
*** Correlation is significant at a 1% level
R2 Adj. R2 R2 Adj. R2
b. Dependent Variable: Long term debt (Ltd) ratio a. Dependent Variable: Short term debt (Std) ratio
[image:8.595.47.554.471.743.2]**Correlation is significant at a 5% level * Correlation is significant at a 10% level 1
Table 4. Coefficients Short term debta Coefficients Long term debtb
Model
Unstandardized
Coefficients Sig.
Unstandardized
This findings also is in line with (Jong, et al., 2007) that also find a positive significant coefficient of 0,013, between size and leverage which has largely the same magnitude as our finding. Furthermore a significant relationship is found between the proxy for business risk and the dependent variable Ltd. The relationship is found to be significantly negative, implying that a higher degree of business risk. i.e. earning volatility would result in a reduced amount of long term debt. This is in line with the hypothesis stating that the earning volatility has a negative effect on the leverage of a firm. This argument is also consistent with the findings of (Jong, et al., 2008) that find a negative coefficient for the variable risk.
A final interesting finding is the significant coefficient on the coefficient of non-debt tax shield (NDTS) A negative coefficient is observed for the relationship between NDTS and short term debt. This implies that a the presence of Non-debts tax shields would result in a lower short term debt ratio as can be seen by the sign of the coefficient. This finding strokes with the expectation that was hypothesised earlier stating that non-debts tax shields have a negative influence on leverage of a firm. This finding provides evidence for the existence of a optimal capital structure as the TOT suggests. We will return on this later. This observation is in line with (Chen & Jiang, 2001)that also find a negative relationship between NDTS and the leverage of a firm.
What is left to be addressed are the industry variables. If we observed the Std. industry coefficient no evidence is found to support our hypothesis. There does not appear to be a significant inter-industry difference with respect to short term leverage. No firm significantly deviates from the reference industry. Subsequently the variance between industries on the Ltd ratio is compared. The observed coefficients for the industry variables, Whole, Construction, Mining and manufacturing are -0,47, -.073, 0,146 and -0.069 respectively. However the coefficient of Wholesale is not significant. From these coefficients it can be derived that the wholesale industry is not significantly different relative to the reference industry, in this case the Service industry. However if the other significant coefficients are observed it becomes evident that, construction and manufacturing industries are levered to a fewer extent or to say the service industry is levered to a greater extent compared to these respective industries. Also it becomes evidident that the Mining industry is levered to a greater extent relative to the Service industry as becomes apparent by the positive coefficient.
Concluding there are significant relationships found between Ltd and profitability, tangibility, total assets and volatility and between Std. and non debt tax shield. Also there appears to be an industry variation as three of the four industries report a significant different coefficient with respect to the reference industry. However it should also be noted that there are no significant observations found between Ltd &depreciation and growth. Also no significant relationships are to be found between Short term debt. & profitability, Size, Growth and Business risk.
6.
DISCUSSION
As the regression result show there are various interesting findings to be discussed .The regression shows that profitability is negatively related towards the long term debt of a firm. With this findings we fail to reject the hypothesis that profitability increases the leverage of a firm. This finding could arguably provide evidence in favour of the pecking order theory stating that a firm with more internal funds will reduce its leverage. The trade off theory would opt that a more profitable firm would increase debts as tax shields become more valuable.
Tangibility appears to have a positive influence on both the long term debt as well as the short term debt. However this finding does not allow us to advance a theory since both theories provide arguments in favour or our hypothesis. The same can be said for the relationship of size towards firm leverage. This relationship is also found to be positively related to the long term debt of a firm however also both theories provide evidence in favour of this finding. Due to these findings we fail to reject H1. and H2. and can allowably say the leverage of a firm increases with the both the tangibility as well as size of the firm.
Volatility or business risk is found to be inversely related to long term debt of a firm. Due to this we also fail to reject hypothesis H5. It shows that Earning volatility is inversely related to a firms long term debt but not to its short term debt. An argument could be that on the long term financial distress is a greater costs due higher fixed interest charges. Whereas Std. is often subject to floating rates.
The negative relationship between short term debt and NDTS implies that and increase in non debt shields would reduce the amount of Std. issued. Higher depreciation is associated with a lower yield of tax shields from debt and hence the leverage is decreased. A substitution effect could occur resulting from the fact that Ndts. Also reduce the corporate tax burden. This supports the notion of the trade off theory opting that that there is a trade off made between the relative advantage of tax deduction and the costs associated with debt. This findings provides support in favour of the Trade off theory.
Finally as already mentioned there appears to be an inter-industry variance as is indicated by the findings of the regression. Three of the four industries appear to be significantly different with respect to the reference industry. This finding provides evidence in favour of the trade off theory opting there is an industry mean and firms tend to converge towards this mean.
Overall contradicting results have been posted with respect to the trade off theory and the pecking order theory. Two findings are in favour of the TOT and one finding is in line with the Pecking order. However as several findings are not unanimous further research is desirable. (Chen & Jiang, 2001) also find similar evidence in favour of the trade off theory and cast doubts behind the pecking order rationale. As argued by the pecking order theory, growth, profitability and earnings volatility should all be negatively related to a firms leverage. However as this paper finds no evidence in favour of growth towards leverage and finds mixed results in favour of the Trade off theory the pecking order argument can be largely dismissed. This finding is largely similar with the conclusion of (Chen & Jiang, 2001) That also find an inverse relation between Ndts. and leverage and also no negative relationship between leverage and growth. On they argue that on these premises of these mixed results “the asymmetric information argument is more rejected than accepted” (p.21)
9
7.
FUTURE RESEARCH AND
LIMITATIONS
There is a great potential for future research in the field. Working on this paper increased awareness for the fact that a variety of different measurements models can be used to explain capital structure. Also since proxy variables only reflect the concept of capital structure to a certain extent a more elaborate set of proxy variables would increase the content validity of the research hence increase the quality of the model. A future study could also provide a more comprehensive view of the theory behind capital structure. Several theories such as the, Signalling theory, market interaction theory could explain variances between firms and increase the explanatory power of the model. However such a analysis goes beyond the scope of this paper due to time constraints.
Further research in the variance between- and within-industries might be justified on the bases of our findings. As this paper does not carefully addresses intra-industry differences this might provide an opportunity for future research. It would be interesting to see what industry factors inference with the leverage of firms.
Another interesting aspect would be to go in-depth and investigate by means of a survey what motives managers have when deciding on its capital structure i.e. how a corporate financing policy is established. This would enable us to go beyond the proxy variables specified by theory
8.
CONCLUDING
So far this study has tried to advance insight into the capital structure of Dutch firms. That data of 186 firms have been gathered and subject to analysis. Both pecking order assumptions as well as trade off theory assumptions have been carefully set out in order to give a comprehensive understanding of the concepts.
The aim of this research was to provide an in depth look into the capital structure of Dutch firms while at the same time assessing whether and to what extent industry differences might also be apparent. The paper reports mixed findings with respect to theory. The capital structure of Dutch firm might be subject to different properties of both the trade off theory as well as the pecking order. This implies we failed to reach a compete consensus with respect to the literature. This may point to weaknesses in the theory from a Dutch firm perspective. However further research would be necessary. Industry difference became apparent and provide evidence for a target leverage. Nonetheless the paper provided valuable insights into the rationale of capital policies of Dutch firms.
9.
ACKNOWLEDGEMENT
Hereby I would like to thank my supervisors for their availability and support. Moreover I would like to thank the finance department for their support and presence. Finally also my great appreciation to the IBA teaching staff for their years of guidance and support.
10.
REFERENCES
Bondt, G. J., 1998. Financial Structure: Theories and stylised facts for six eu countries. De Economist, 146(2), pp. 271-301. Bowen, R. M., Lane, D. A. & Huber, J. C. C., 1982. Evidence on the Existence and Determinants of Inter-Industry Differences in Leverage. Financial Management, 11(4), pp. 10-20.
Chen, L. H. & Jiang, G. J., 2001. The Determinants of Dutch Capital Structure Choice. Working Paper, p. 27.
Chen, L. H., Lensink, R. & Sterken, E., 1998. The Determinants of Capital Structure: Evidence form Dutch Panel Data. Working paper, Faculty of business and Economics and Finance, University of Groningen.
DeAngelo, H. & Masulis, R. W., 1980. Optimal Capital Structure Under Corporate and Personal Taxation. Journal of Financial Economics, 8(1), pp. 3-29.
Deesomsak, R., Paudyal, K. & Pescetto, G., 2004. The determinants of capital structure: evidence from the Asia pacific region. Journal of Multinational Financial Management, pp. 387-405.
Deesomsak, R., Paudyal, K. & Pescetto, G., 2004. The determinants of capital structure: evidence from the Asia pacific region. Journal of Multinational Financial Management, 14(4-5), pp. 387-405.
Degryse, H., Kappert, P. & Goeij, P. d., 2012. The impact of firm and industry characteristics on small firms’ capital structure. Small Business Economics, Issue 38, pp. 431-447. Dijk, V. R. & Jong, A. D., 2007. Determinants of Leverage and Agency Problems: A Regression Approach with Survey Data. The European Journal of Finance, 13(6), pp. 565-593.
Fama, E. F. & French, K. R., 2002. Testing Trade-Off and Pecking Order Predictions about Dividends and Debt. The Review of Financial Studies, 15(1), pp. 1-33.
Frank, M. Z. & Goyal, V. K., 2003. Testing the pecking order theory of capital structure. Journal of Financial Economics, Issue 67, pp. 217-248.
Frank, M. Z. & Goyal, V. K., 2005. Preliminary version, Tradeoff and Pecking Order Theories of Debt. In: Handbook of Corporate Finance: Emperical Corporate Finance. s.l.:s.n. Goyal, V. K. & Frank, M. Z., 2009. Capital Structure Decisions: Which factors Are Reliably Important?. Financial Management, 28(1), pp. 1-37.
Haan, L. d. & Bie, T. d., 2007. Market Timing And Capital Structure: Evidence For Dutch Firms. De Economist, 115(2), pp. 183-206.
Harris, M. & Raviv, A., 1991. The Theory of Capital Structure. The Journal of Finance, 46(1), pp. 297-355.
Hinloopen, J. & Haan, L. d., 2003. Preference hierarchies for internal finance, bank loans, bond and share issues: evidence for Dutch firms. Journal of Empirical Finance, 10(5), pp. 661-681. Hoaglin, D. C. & Iglewicz, B., 1987. Fine-Tuning Some Resistant Rules for Outlier Labeling. Journal of the American Statistical Association, 82(400), pp. 1147-1149.
Jensen, M. C., 1986. Agency Costs of Free Cash Flow, Corporate Finance, and Takeovers. The American Economic Review, 76(2), pp. 323-329.
Jensen, M. C. & Meckling, W. H., 1976. Theory of the Firm: Managerial Behavior, Agency Costs and Ownership Structure. Journal of Financial Economics, 3(4), pp. 305-360.
Johnson, H. & Stulz, R. M., 1985. An analysis of secured debt. Journal of Financial Economics, Volume 14, pp. 501-521. Jong, A. d., 2002. The Disciplining Role of Leverage in Dutch Firms. European Finance Review, 6(1), pp. 31-62.
Jong, A. d., Nguyen, T. T. & Kabir, R., 2008. Capital structure around the world: The roles of firm- and country-specific determinants. Journal of Banking& Finance, pp. 1954-1969. Jong, d. A., 1999. An empirical analysis of capital structure decisions in Dutch firms, Tilburg: CentER, Center for Economic Research.
Kim, E. H., Jarrell, G. A. & Bradley, M., 1984. On the Existence of an Optimal Capital Structure: Theory and Evidence. The Journal of Finance, 39(3), pp. 857-878.
Litzenberger, R. H. & Kraus, A., 1973. A State Preference Model Of Optimal Financial Leverage. The Journal Of Finance, 28(4), pp. 911-922.
Michaelas, N., Chittenden, F. & Poutziouris, P., 1999. Financial Policy and Capital Structure Choice in U.K. SMEs: Empirical Evidence from Company Panel Data. Small Business Economics, 12(2), pp. 113-130.
Miller, H. M., 1977. Debt and Taxes. The Journal of Finance, 32(2), pp. 261-275.
Modigliani, F. & Miller, M. H., 1958. The Cost of Capital, Corporation Finance and the Theory of Investment. The American Economic Review, 48(3), pp. 261-297.
Myers, S. C., 1977. Determinants of Corporate Borrowing. Journal of Financial Economics, 5(2), pp. 147-175.
Myers, S. C., 1984. The Capital Structure Puzzle. The Journal of Finance, 39(3), pp. 574-592.
Myers, S. C. & Majluf, N. S., 1984. Corporate Financing Decisions When Firms Have Information That Investors Do Not Have. Journal of Financial Economics, 13(2), pp. 187-221. Myers, S. C. & Shyam-Sunder, L., 1999. Testing static tradeoff against pecking order models of capital structure. Journal of Financial Economics, 51(2), pp. 219-244.
Osborne, J. & Waters, E., 2002. Four assumptions of multiple regression that researchers should always test.. Practical Assessment, Research & Evaluation, 8(2).
Raviv, A. & Harris, M., 1990. Capital Structure and the Informational Role of Debt. The Journal of Finance, 45(2), pp. 321-349.
Titman, S. & Wessels, R., 1988. The Determinants of Capital Structure Choice. The Journal of Finance, 43(1), pp. 1-19. Tukey, J. W., Iglewicz, B., Hoaglin, D. C. & Tukey, J. W., 1986. Performance of Some Resistant Rules for Outlier Labeling. Journal of the American Statistical Association, 81(396), pp. 991-999.
Warner, J. B. & Gruber, M. J., 1977. Bankruptcy Costs: Some Evidence. The Journal of Finance, 32(2), pp. 337-347.
Yazici, N., Ege, İ. & Bayrakdaroğlu, A., 2013. A Panel Data Analysis of Capital Structure Determinants: Empirical Results from Turkish Capital Market. International Journal of Economics and Finance, 5(4), pp. 131-140.
Zeitun, R. & Tian, G. G., 2007. Capital Structure and Corporate Performance. The Australasian Accounting Business & Finance Journal, 1(4), pp. 40-61.
11
11.
APPENDIX
Table 1.
Variables Definition in model
Defined as Item codes used Used in
Leverage Ltd. Long term debt/total assets LTDB (Degryse, et al., 2010) (Jong, 1999)
Leverage Std Short term debt/total assets CL, OCL, Trade credit (Titman & Wessels, 1988)
(Degryse, et al., 2010) (Frank & Goyal, 2009) (Deesomsak, et al., 2004) (Degryse, et al., 2010) (Jong, et al., 2008) (Haan & Bie, 2007)
Tangibility Tang. Tangible Fixed assets/ TA TFAS/TOAS (Deesomsak, et al., 2004) (Degryse, et al., 2010)
(Titman & Wessels, 1988) (Deesomsak, et al., 2004)
(Fama & French, 2002))
Growth growth (TOAS-TOAS-1)/TOAS-1 TOAS (Titman & Wessels, 1988)
(Frank & Goyal, 2009) Business Risk Volatility Natural logarithm of the Standard
deviation of EBIT (3years)
Operating income= EBIT (P/L)
(Deesomsak, et al., 2004) (Chen, et al., 1998)
[image:12.595.57.556.116.374.2]Industry Indus. Dummy variables NAICS Core code (4digits) (Titman & Wessels, 1988) Tax shields NDTS Depreciation/Total Assets DEPR (&Amortization)
Table 1. Review of Empirical studies and the summary of proxy variables
Size Size Natural logarithm of total assets TOAS