ORIGINAL RESEARCH
HEAD & NECK
Evaluating Instantaneous Perfusion Responses of Parotid
Glands to Gustatory Stimulation Using
High-Temporal-Resolution Echo-Planar Diffusion-Weighted Imaging
X T.-W. Chiu, XY.-J. Liu, XH.-C. Chang, XY.-H. Lee, XJ.-C. Lee, XK. Hsu, X C.-W. Wang, XJ.-M. Yang, XH.-H. Hsu, and XC.-J. Juan
ABSTRACT
BACKGROUND AND PURPOSE: Parotid glands secrete and empty saliva into the oral cavity rapidly after gustatory stimulation. However, the role of the temporal resolution of DWI in investigating parotid gland function remains uncertain. Our aim was to design a high-temporal-resolution echo-planar DWI pulse sequence and to evaluate the instantaneous MR perfusion responses of the parotid glands to gustatory stimulation.
MATERIALS AND METHODS:This prospective study enrolled 21 healthy volunteers (M/F⫽2:1; mean age, 45.2⫾12.9 years). All partici-pants underwent echo-planar DWI (total scan time, 304 seconds; temporal resolution, 4 s/scan) on a 1.5T MR imaging scanner. T2WI (b⫽ 0 s/mm2) and DWI (b⫽200 s/mm2) were qualitatively assessed. Signal intensity of the parotid glands on T2WI, DWI, and ADC was
quantitatively analyzed. One-way ANOVA with post hoc group comparisons with Bonferroni correction was used for statistical analysis. P⬍.05 was statistically significant.
RESULTS:Almost perfect interobserver agreement was achieved ( ⱖ0.656). The parotid glands had magnetic susceptibility artifacts in 14.3% (3 of 21) of volunteers during swallowing on DWI but were free from perceptible artifacts at the baseline and at the end of scans on all images. Increased ADC and reduced signal intensity of the parotid glands on T2WI and DWI occurred immediately after oral adminis-tration of lemon juice. Maximal signal change of ADC (24.8%⫾10.8%) was significantly higher than that of T2WI (⫺10.1%⫾5.2%,P⬍.001). The recovery ratio of ADC (100.71%⫾42.34%) was also significantly higher than that of T2WI (22.36%⫾15.54%,P⬍.001).
CONCLUSIONS: Instantaneous parotid perfusion responses to gustatory stimulation can be quantified by ADC by using high-temporal-resolution echo-planar DWI.
ABBREVIATIONS:MSC⫽maximal signal change; RR⫽recovery ratio
Q
uantification of normal salivary gland function is of para-mount clinical importance because it is the foundation of accurately evaluating disease-related salivary gland functional im-pairment. Salivary gland function can be estimated by severalmethods such as saliva collection,1laboratory measurement of the
chemical and biochemical components,2 scintigraphy,3
single-photon emission CT,4and positron-emission tomography.5MR
imaging is superior to saliva collection and laboratory and bio-logic studies by providing morphobio-logic and functional informa-tion of the parotid glands simultaneously and specifically for in-dividual salivary glands. On the other hand, MR imaging is also superior to scintigraphy, SPECT, and PET because of its high spatial resolution and radiation-free nature.
In recent decades, DWI has been increasingly applied to probe salivary gland function in addition to evaluating tumors,6-11
con-nective tissue disorders,12Sjo¨gren syndrome,13,14and
postradio-therapy change15-19of the parotid glands. However, 2 mutually
opposed trends of parotid apparent diffusion coefficient changes after gustatory stimulation have been observed in different study groups, even in healthy volunteers. While some researchers dem-onstrated an increase of parotid ADC after gustatory stimula-tion,14,16,20-23others showed a decrease of parotid ADC after this Received November 16, 2015; accepted after revision April 3, 2016.
From the Departments of Radiology (T.-W.C., C.-W.W., H.-H.H., C.-J.J.) and Den-tistry (K.H.), National Defense Medical Center, Taipei, Taiwan; Department of Med-icine (T.-W.C.), Taipei Medical University, Taipei, Taiwan; Department of Automatic Control Engineering (Y.-J.L., Y.-H.L.), Feng Chia University, Taichung, Taiwan; De-partment of Diagnostic Radiology (H.-C.C.), The University of Hong Kong, Hong Kong; Department of Otolaryngology-Head and Neck Surgery (J.-C.L.), Tri-Service General Hospital, National Defense Medical Center, Taipei, Taiwan; Department of Biological Science and Technology (J.-C.L., J.-M.Y.), Institute of Bioinformatics and Systems Biology, National Chiao Tung University, Hsinchu, Taiwan; and Depart-ment of Radiology (C.-W.W., H.-H.H., C.-J.J.), Tri-Service General Hospital, Taipei, Taiwan.
Please address correspondence to Chun-Jung Juan, MD, PhD, Section of Radiology, School of Medicine, National Defense Medical Center, Section of Neuroradiology, Department of Radiology, Tri-Service General Hospital, 325, Section 2, Cheng-Kong Rd, Neihu, Taipei, Taiwan, Republic of China; e-mail: [email protected]
stimulation.15,24Such discrepancy has been partially attributed to
the different types and dosages of the stimulators.16Nevertheless,
the discrepancy of diffusional responses to gustatory stimulation in the aforementioned DWI studies has raised concern for whether the normal salivary gland function has been evaluated appropriately with DWI.
The role of the temporal resolution of DWI, which might po-tentially influence researchers in interpreting parotid gland func-tion, has not been documented to date, to our knowledge. Via parasympathetic innervation, salivary glands secrete and empty saliva into the oral cavity rapidly after gustatory stimulation. Cur-rent DWI studies might have limitations in catching the instanta-neous responses of the parotid glands due to insufficient temporal resolution. We hypothesized that the parotid glands respond to the oral administration of lemon juice on the order of seconds. The aim of our study was to design a high-temporal-resolution echo-planar pulse sequence for DWI and to quantify the instan-taneous MR perfusion responses of the parotid glands to gusta-tory stimulation.
MATERIALS AND METHODS
This prospective study was approved by the institutional review board at Tri-Service General Hospital. Written informed consent was obtained.
Subjects
This study initially enrolled 22 healthy volunteers who were free from tumor, inflammation, autoimmune disease, operations, and radiation therapy involving any parotid gland. One subject was excluded due to severe imaging distortion related to a fixed me-tallic dental brace. Finally, 21 healthy volunteers were enrolled, including 14 men and 7 women (mean age, 45.2⫾12.9 years). Saliva production of each volunteer was quantified 1 hour before DWI by using the Saxon test.1
MR Imaging Protocol
All MR images were performed on a 1.5T whole-body scanner (Signa HDx; GE Healthcare, Milwaukee, Wisconsin) by using an 8NV head and neck array coil. Three-plane orthogonal gradient-echo images were acquired for anatomic localization. Single-shot echo-planar DWI (TR/TE/NEX, 2000/53.3 ms/1) with fat satura-tion was performed on axial planes with diffusion-probing gradi-ents (b⫽0 and 200 s/mm2) applied on each of 3 orthogonal direc-tions alternatively. We intentionally chose a b-value of 200 s/mm2 for 3 reasons: First, a b-value higher than 200 s/mm2has been shown to be perfusion-insensitive in ADC measurements.25,26
Accordingly, choosing a b-value of 200 s/mm2allows better eval-uation of perfusion-sensitive changes of the parotid glands than by using a b-value of 300 s/mm2or higher. Second, apparent bulk motion artifacts have been demonstrated in dynamic scans on DWI with a high b-value of 1000 s/mm2in the parotid glands.27
On the contrary, DWI with a low b-value of 200 s/mm2has a higher signal-to-noise ratio28and is theoretically less susceptible
to bulk motion artifacts than with higher b-values. Third, al-though it has been documented that b-values lower than 200 s/mm2are critical to obtain perfusion-sensitive information from DWI, there is no consensus on the magnitude of b-values that
should be applied.29We chose a b-value of 200 s/mm2rather than 100 s/mm2to reduce potential contamination of signal loss from the faster flow of small arteries or veins. Other MR imaging pa-rameters included an FOV of 240⫻240 mm, matrix size of 256⫻ 256, echo-train length of 76, bandwidth of 1953 Hz/pixel, and section thickness of 5 mm. Each DWI examination contained 152 excitations. Each excitation obtained 14 sections covering from the cerebellum to the submandibular glands. The total scan time was 5 minutes 4 seconds.
MR Imaging Acquisition
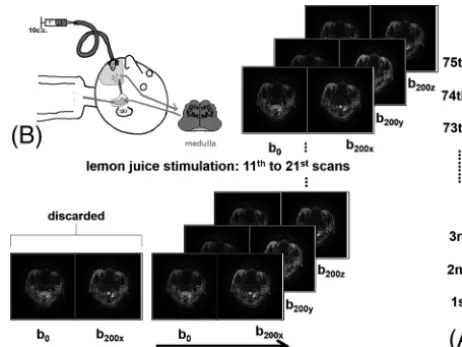
T2WI (b⫽0 s/mm2) and DWI (b⫽200 s/mm2) were acquired alternatively. The first 2 excitations were discarded. The direction of the diffusion gradients was changed periodically in the order of the x, y, and z axes, allowing acquisition of a series of T2WI-DWIx-T2WI-DWIy-T2WI-DWIzscans for the rest of the 150 ex-citations as illustrated inFig 1A. Accordingly, 75 dynamic scans were used for analysis with each dynamic scan containing a T2WI and a DWI. The temporal resolution was 4 seconds per scan.
Gustatory Stimulation by Lemon Juice
As shown inFig 1B, 10 mL of commercial lemon juice was admin-istrated via a connecting tube into the oral cavity at the 11th dy-namic scan. Each subject was instructed to swallow the lemon juice at the 21st scan. The duration of lemon juice stasis in the oral cavity was 40 seconds.
Qualitative Assessment of Imaging Quality
All MR imaging data were processed by software developed in-house (T.-W.C., Y.-H.L., and C.-J.J.) by using Matlab (Math-Works, Natick, Massachusetts). Magnetic susceptibility artifacts on T2WI and DWI were qualitatively and independently evalu-ated by 2 neuroradiologists (C.-J.J. and C.-W.W. with⬎10 and 3 years’ experience in head and neck MR imaging interpretation, respectively) by using a 4-point grading score system (0, severe magnetic susceptibility artifacts: distortion and signal loss that
FIG 1. Demonstration of data acquisition and arrangement of DWI.A, The first 2 images were discarded. T2-weighted images (b0) and
diffu-sion-weighted images (b200) were arranged alternatively for 75
[image:2.594.300.531.46.219.2]involved the entire image; 1, moderate magnetic susceptibility artifacts: distortion and signal loss involving the parotid glands; 2, mild magnetic susceptibility artifacts: distortion and signal loss involving the oral cavity, nasal cavity, oropharynx, maxillary si-nuses, or masticator spaces but sparing the parotid glands; and 3, no magnetic susceptibility artifacts). Qualitative analysis was per-formed on T2WI and DWI at baseline, during swallowing, and at the end of dynamic scans, respectively.
Imaging Processing and Quantitative Data Analysis
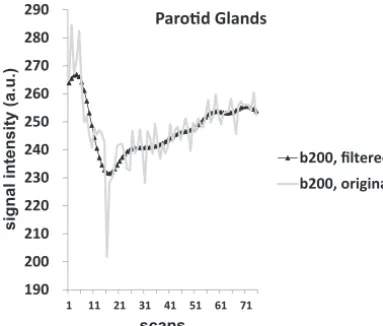
Quantitative analysis was performed on 3 contiguous sections covering the largest areas of the parotid glands, respectively. Polygonal ROIs were drawn within the bilateral parotid glands on the T2WIs, respectively, avoiding the partial volume effects from visible vessels and adjacent tissues. These ROIs were then auto-matically copied to the DWI for concurrent measurement of sig-nal intensity. Time sigsig-nal data of T2WI and DWI were treated by a fifth-order Butterworth low-pass filter with a cutoff frequency of 0.025Hz (Fig 2) to eliminate high-frequency noise that occurred during the dynamic scans.
ADC was calculated on the basis of the following equation:
1) ADC⫽ln共S200⫺⫺S0兲
b ,
whereS200andS0were signal intensities of images with b-values of 200 s/mm2and 0 s/mm2, respectively. Signal intensity–time curves for T2WI, DWI, and ADC maps were plotted. In addition, signal intensity–time curves were further normalized according to equation 2:
2) SCn⫽
共SIi⫺SI0兲
SI0 ,
whereSCnwas the normalized signal change,SIiwas the signal intensity at the ith scan, andSI0was the baseline signal intensity averaged from the first 9 (first to ninth) scans. Salivary parame-ters, including maximal signal change (MSC), time to peak, and recovery ratio (RR), were further derived from the normalized signal change–time curves, respectively, to characterize the
indi-vidual parotid responses to gustatory stimulation. MSC was de-fined as the maximal normalized signal change, TTP referred to the time interval from the start of dynamic scans to the time of MSC, and RR was calculated according to equation 3:
3) RR⫽共MSC⫺SCend兲
MSC ,
whereSCendrefers to the normalized signal change averaged from the last 9 (67th to 75th) scans.
Statistical Analysis
Statistical analysis was performed by using SPSS software (SPSS 20.0; IBM, Armonk, New York) and MedCalc for Windows (MedCalc Software, Mariakerke, Belgium). Interobserver reliabil-ity for imaging distortion was evaluated by linear-weighted sta-tistics. The normality of baseline signal intensity and salivary pa-rameters was analyzed by Kolmogorov-Smirnov tests. A paired Studentttest was used for comparisons between the left and right parotid glands. Salivary parameters were analyzed by 1-way ANOVA; and post hoc group comparisons, with a Bonferroni correction. APvalue⬍.05 was statistically significant.
RESULTS
The saliva collected within 2 minutes was 5.78⫾2.61 g (mean⫾ standard deviation). Results of qualitative analysis of T2WI and DWI were summarized in theTable. Linear-weightedanalysis revealed substantial agreement between the 2 raters with avalue of 0.656 on all T2WIs and almost perfect agreement, with a value ranging from 0.842 (during swallowing) to 1 (at baseline and at the end of dynamic scans) on DWI. The parotid glands were free from perceptible artifacts at the baseline or at the end of scans on both T2WI and DWI (Fig 3). However, the parotid glands had magnetic susceptibility artifacts on DWI during swal-lowing in 14.3% (3 of 21) of volunteers who had metallic dental implants (Fig 4).
The left parotid glands did not differ from the right parotid glands in baseline signal intensity on either T2WI (P⫽.148) or DWI (P⫽.227). Therefore, data of both parotid glands of each subject were averaged to represent each individual in further anal-ysis. Averaged signal intensity–time curves of the parotid glands on T2WI, DWI, and ADC were plotted inFig 5. On both T2WI and DWI, the signal intensity decreased immediately after oral administration of lemon juice and kept declining during the gus-tatory stimulation. After swallowing, the signal intensity began to
190 200 210 220 230 240 250 260 270 280 290
1 11 21 31 41 51 61 71 Parod Glands
b200, filtered
b200, original
FIG 2. Signal intensity–time curves before and after fifth-order But-terworth low-pass filtering on DWI (b200). High-frequency noises (gray peaks) are apparently reduced, while the trend of time-series data in response to gustatory stimulation is preserved. a.u. indicates arbitrary unit.
Magnetic susceptibility artifact scores of T2WI and DWI
MSA Score
At the Baseline During Swallowing At the End Rater 1 Rater 2 Rater 1 Rater 2 Rater 1 Rater 2 T2WI (b0)
0 0 0 0 0 0 0
1 0 1 0 1 0 1
2 20 19 20 19 20 19
3 1 1 1 1 1 1
DWI (b200)
0 0 0 0 0 0 0
1 0 0 3 2 0 0
2 20 20 17 18 20 20
3 1 1 1 1 1 1
[image:3.594.73.265.48.211.2]increase slowly on DWI but further dropped without perceptible recovery on T2WI (Fig 5A). On the contrary, the ADC increased abruptly during the lemon juice stimulation, reached the peak at swallowing, and then declined to the baseline level at the end of scans (Fig 5B).
Figure 6 demonstrates the normalized signal change–time curves of the parotid glands. The normalized signal change–time curves of the parotid glands on T2WI (Fig 6A), DWI (Fig 6B), and ADC (Fig 6C) revealed trends similar to signal intensity–time curves, respectively. One-way ANOVA showed significant differ-ences in all salivary parameters, including MSC, TTP, and RR among T2WI, DWI, and ADC, respectively (all,Pⱕ.001). The results of post hoc analysis with Bonferroni correction of salivary parameters are described below. The MSC of ADC (24.8%⫾ 10.8%) was significantly higher than that of T2WI (⫺10.1%⫾ 5.2%;P⬍.001) and DWI (⫺14.2%⫾5.5%;P⬍.001). The MSC of T2WI did not differ from that of DWI (P⫽.437). TTP was
significantly higher in T2WI (47.0⫾17.3 scans) than in DWI (31.0⫾16.4 scans;P⬍.001) and ADC (21.6⫾11.1 scans;P⫽
.004). There was no difference in TTP between DWI and ADC (P⫽.132). The RR of ADC (100.71%⫾42.34%) was significantly higher than in T2WI (22.36%⫾15.54%;P⬍.001) and DWI (42.3%⫾21.7%;P⬍.001). There was no difference in RR be-tween the T2WI and DWI (P⫽.143).
DISCUSSION
Temporal resolution is an important factor in analyzing immedi-ate responses of the parotid glands to gustatory stimulation. Such immediate responses have not been emphasized in prior re-search,14-16,20-24in which DWI was performed without
concur-rent gustatory stimulation and the temporal resolution of DWI was rather low, ranging from 74 seconds per scan21to 162 seconds
per scan.16Discrepant observations of parotid responses to the
gustatory stimulation in prior research (ie, decreased ADC after gustatory stimulation in some studies15,24but increased ADC in
others14,16,20-23) might be partly affected by the time gap between
the gustatory stimulation and the poststimulation DWI and the low temporal resolution of DWI. Both factors limit DWI in de-tecting the maximal change of parotid ADC after gustatory stimulation.
In this prospective study, we successfully demonstrated the instantaneous responses of the parotid glands to gustatory stim-ulation by using echo-planar DWI at a high temporal resolution of 4 seconds. The overall signal intensity of the parotid glands on T2WI and DWI was altered at the start of stimulation, as was the parotid ADC. Our results support the hypothesis that the re-sponse of the parotid glands to gustatory stimulation occurs in seconds after oral intake of lemon juice.
On T2WI, the rapid reduction of signal intensity of the parotid glands might indirectly reflect an immediate reduction of saliva in the parotid glands after gustatory stimulation. Our result is con-sistent with the observations of quantitative salivary gland scinti-graphic studies with a temporal resolution of 15 seconds per scan.30The immediate reduction of parotid radioactivity and
accumulation of oral radioactivity following stimulation30,31
supports saliva being emptied from the parotid glands imme-diately after the stimulation. After swallowing, the parotid glands showed persistent low signal intensity without recovery in averaged signal intensity–time curves and showed an RR of 22.36%, derived from individual signal intensity–time curves. Our results suggest that the refill of the water component of the parotid gland is a process longer than 3 minutes after removing the stimulator.
Because the signal intensity of vascular flow is attenuated rap-idly under low b-values,32ADC calculated from low b-values (0
s/mm2and 200 s/mm2) can be considered perfusion-sensitive in our study. Our study showed a maximal increase of 24.8% in the parotid ADC at 44.6 seconds (TTP⫽21.6 scans) after the start of lemon juice stimulation. Such a rapid increase of pa-rotid ADC implies an instantaneous increase of papa-rotid perfu-sion after gustatory stimulation. The parotid response to gus-tatory stimulation has been recently investigated by arterial spin-labeling perfusion-weighted MR imaging,33 showing a
mean increase of 62% of parotid blood flow. However, arterial
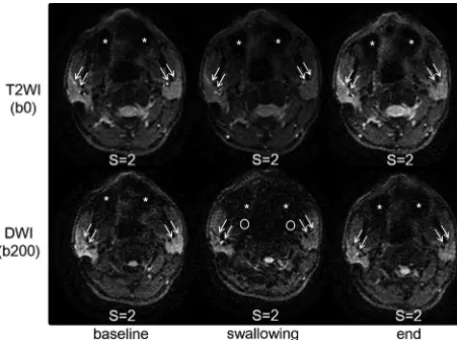
FIG 3. Magnetic susceptibility artifacts on T2WI and DWI. Mild dis-tortion and signal loss involving the bilateral maxillary sinuses (stars) occur on all T2WI and DWI scans. During swallowing, the parotid glands are still free from artifacts, though more extensive artifacts involve the nasal cavity, oropharynx, and bilateral masticator spaces (circles). The anterior margins of the parotid glands are indicated by arrows. S indicates magnetic susceptibility artifact score.
[image:4.594.55.284.47.217.2] [image:4.594.54.287.299.450.2]splabeling MR imaging is also limited in depicting the in-stantaneous response of the parotid glands due to its low tem-poral resolution of 160 seconds per scan.33Evaluation of
pa-rotid gland function by using blood oxygen level– dependent MR imaging showed an initial drop of signal intensity after gustatory stimulation by using ascorbic acid.34In addition to
the aforementioned MR imaging techniques, dynamic con-trast-enhanced MR imaging has also been applied to evaluate the perfusion change caused by salivary stimulation recently.35
After swallowing, the parotid glands showed rapid reduction of ADC toward the baseline with an RR of 100% in our study. Our results reflect rapid reduction of parotid perfusion after swal-lowing lemon juice. The parotid ADC showed significantly higher RR than T2WI (P⬍.001). Our results suggest that the parotid perfusion has returned to the baseline level at the end of the dynamic scans, while the water refill of the parotid glands has not.
Our results also show apparent intersubject variations regard-ing all salivary parameters, especially after swallowregard-ing lemon juice. The intersubject variations might reflect the biologic diver-sity. If one takes TTP for example, possible reasons for the varia-tions of TTP include residual lemon juice in the oral cavity,
re-peated swallowing, and other involuntary motions or background noises during dynamic scanning.
Our study has several potential limitations. First, there is a trade-off between temporal resolution and signal-to-noise ratio in our study. Therefore, we performed an analysis of imaging quality to examine the severity of magnetic susceptibility artifacts. Our results showed that the parotid glands were free from mag-netic susceptibility artifacts at baseline and at the end of dynamic scans with substantial-to-almost perfect interobserver agreement. Second, the signal intensity of DWI might be influenced by bulk motion in our study. Therefore, we applied a low-pass filter to reduce the high-frequency signal fluctuations. Our results are consistent with the aforementioned quantitative salivary gland scintigraphic studies30,31regarding rapid emptying of saliva and
arterial spin-labeling MR imaging studies33regarding increased
blood flow after gustatory stimulation. Third, signal intensity on T2WI and DWI might be not only attributed to water molecules but also affected by fat molecules.36,37To verify the change of the
water component in response to gustatory stimulation, another high-temporal-resolution echo-planar dual-echo MR imaging pulse sequence has been designed for direct measurement of the proton density of the parotid glands.
200 250 300 350 400 450 500
1 11 21 31 41 51 61 71
Parod Glands
b0
b200
lemon juice administraon
swallowing
0.0012 0.0013 0.0014 0.0015 0.0016 0.0017 0.0018 0.0019 0.0020
1 11 21 31 41 51 61 71
Parod Glands
ADC
lemon juice administraon
swallowing
A
B
FIG 5. Averaged signal intensity–time curves of T2WI (b0) and DWI (b200) (A) and ADC time curves of the parotid glands (B). Lemon juice is administrated (long arrow) at the 11th scan and is swallowed (short arrow) at the 21st scan. a.u. indicates arbitrary unit.
20% 15% 10% 5% 0% 5% 10%
1 6 11 16 21 26 31 36 41 46 51 56 61 66 71
Parod Glands
b0
20% 15% 10% 5% 0% 5% 10%
1 6 11 16 21 26 31 36 41 46 51 56 61 66 71
Parod Glands
b200
20% 10% 0% 10% 20% 30% 40%
1 6 11 16 21 26 31 36 41 46 51 56 61 66 71
Parod Glands
ADC
A
B
C
[image:5.594.53.532.49.247.2] [image:5.594.55.531.286.427.2]CONCLUSIONS
Instantaneous parotid perfusion responses to gustatory stimula-tion can be quantified by ADC by using high-temporal-resolustimula-tion echo-planar DWI.
ACKNOWLEDGMENTS
The authors are grateful to Cheng-Hsuan Juan for contribut-ing the comprehensive cartoon illustration of gustatory stimulation.
Disclosures: Y.-J. Liu—UNRELATED:Grants/Grants Pending: Received support in part from the Ministry of Science and Technology under Grant No. NSC 102-2221-E-035– 003–MY.
REFERENCES
1. Kohler PF, Winter ME.A quantitative test for xerostomia: the Saxon test, an oral equivalent of the Schirmer test.Arthritis Rheum1985; 28:1128 –32CrossRef Medline
2. Chiappin S, Antonelli G, Gatti R, et al.Saliva specimen: a new labo-ratory tool for diagnostic and basic investigation.Clin Chim Acta
2007;383:30 – 40Medline
3. Arrago JP, Rain JD, Brocheriou C, et al.Scintigraphy of the salivary glands in Sjo¨gen’s syndrome. J Clin Pathol 1987;40:1463– 67 CrossRef Medline
4. van Acker F, Flamen P, Lambin P, et al.The utility of SPECT in determining the relationship between radiation dose and salivary gland dysfunction after radiotherapy.Nucl Med Commun2001;22: 225–31CrossRef Medline
5. Buus S, Grau C, Munk OL, et al.11C-methionine PET, a novel method for measuring regional salivary gland function after radio-therapy of head and neck cancer.Radiother Oncol2004;73:289 –96 CrossRef Medline
6. Ikeda M, Motoori K, Hanazawa T, et al.Warthin tumor of the pa-rotid gland: diagnostic value of MR imaging with histopathologic correlation.AJNR Am J Neuroradiol2004;25:1256 – 62Medline 7. Eida S, Sumi M, Sakihama N, et al.Apparent diffusion coefficient
mapping of salivary gland tumors: prediction of the benignancy and malignancy.AJNR Am J Neuroradiol2007;28:116 –21Medline 8. Yerli H, Agildere AM, Aydin E, et al.Value of apparent diffusion
coefficient calculation in the differential diagnosis of parotid gland tumors.Acta Radiol2007;48:980 – 87CrossRef Medline
9. Yabuuchi H, Matsuo Y, Kamitani T, et al.Parotid gland tumors: can addition of diffusion-weighted MR imaging to dynamic contrast-enhanced MR imaging improve diagnostic accuracy in character-ization?Radiology2008;249:909 –16CrossRef Medline
10. Habermann CR, Arndt C, Graessner J, et al.Diffusion-weighted echo-planar MR imaging of primary parotid gland tumors: is a pre-diction of different histologic subtypes possible?AJNR Am J Neuro-radiol2009;30:591–96CrossRef Medline
11. Celebi I, Mahmutoglu AS, Ucgul A, et al.Quantitative diffusion-weighted magnetic resonance imaging in the evaluation of parotid gland masses: a study with histopathological correlation.Clin Im-aging2013;37:232–38CrossRef Medline
12. Patel RR, Carlos RC, Midia M, et al.Apparent diffusion coefficient mapping of the normal parotid gland and parotid involvement in patients with systemic connective tissue disorders.AJNR Am J Neu-roradiol2004;25:16 –20Medline
13. Sumi M, Takagi Y, Uetani M, et al.Diffusion-weighted echoplanar MR imaging of the salivary glands.AJR Am J Roentgenol2002;178: 959 – 65CrossRef Medline
14. Regier M, Ries T, Arndt C, et al.Sjo¨gren’s syndrome of the parotid gland: value of diffusion-weighted echo-planar MRI for diagnosis at an early stage based on MR sialography grading in comparison with healthy volunteers.Rofo2009;181:242– 48CrossRef Medline 15. Dirix P, De Keyzer F, Vandecaveye V, et al.Diffusion-weighted
mag-netic resonance imaging to evaluate major salivary gland function
before and after radiotherapy.Int J Radiat Oncol Biol Phys2008;71: 1365–71CrossRef Medline
16. Zhang Y, Ou D, Gu Y, et al.Diffusion-weighted MR imaging of salivary glands with gustatory stimulation: comparison before and after radiotherapy.Acta Radiol2013;54:928 –33CrossRef Medline 17. Marzi S, Forina C, Marucci L, et al.Early radiation-induced changes
evaluated by intravoxel incoherent motion in the major salivary glands.J Magn Reson Imaging2015;41:974 – 82CrossRef Medline 18. Juan CJ, Cheng CC, Chiu SC, et al.Temporal evolution of parotid
volume and parotid apparent diffusion coefficient in nasopharyn-geal carcinoma patients treated by intensity-modulated radiother-apy investigated by magnetic resonance imaging: a pilot study.PLoS One2015;10:e0137073CrossRef Medline
19. Studer G, Kirilova A, Jaffray D, et al.Major salivary gland function: diffusion-weighted MRI (DWI) assessment before, during and af-ter radiation therapy.International Journal of Radiation Oncology
2005;63:S361CrossRef
20. Habermann CR, Cramer MC, Graessner J, et al.Functional imaging of parotid glands: diffusion-weighted echo-planar MRI before and after stimulation.Rofo2004;176:1385– 89CrossRef Medline 21. Habermann CR, Gossrau P, Kooijman H, et al.Monitoring of
gusta-tory stimulation of salivary glands by diffusion-weighted MR imaging: comparison of 1.5T and 3T.AJNR Am J Neuroradiol2007; 28:1547–51CrossRef Medline
22. Ries T, Arndt C, Regier M, et al.Value of apparent diffusion coeffi-cient calculation before and after gustatory stimulation in the diag-nosis of acute or chronic parotitis.Eur Radiol2008;18:2251–57 CrossRef Medline
23. Kato H, Kanematsu M, Toida M, et al.Salivary gland function evaluated by diffusion-weighted MR imaging with gustatory stimulation: preliminary results. J Magn Reson Imaging2011;34: 904 – 09CrossRef Medline
24. Thoeny HC, De Keyzer F, Claus FG, et al.Gustatory stimulation changes the apparent diffusion coefficient of salivary glands: initial experience.Radiology2005;235:629 –34CrossRef Medline 25. Freiman M, Voss SD, Mulkern RV, et al.In vivo assessment of
opti-mal b-value range for perfusion-insensitive apparent diffusion co-efficient imaging.Med Phys2012;39:4832–39CrossRef Medline 26. Dikaios N, Punwani S, Hamy V, et al.Noise estimation from
aver-aged diffusion weighted images: can unbiased quantitative decay parameters assist cancer evaluation? Magn Reson Med 2014;71: 2105–17CrossRef Medline
27. Liu YJ, Lee YH, Chang HC, et al.A potential risk of overestimating apparent diffusion coefficient in parotid glands.PLoS One2015;10: e0124118CrossRef Medline
28. Lemke A, Stieltjes B, Schad LR, et al.Toward an optimal distribution of b values for intravoxel incoherent motion imaging.Magn Reson Imaging2011;29:766 –76CrossRef Medline
29. Koh DM, Collins DJ, Orton MR.Intravoxel incoherent motion in body diffusion-weighted MRI: reality and challenges.AJR Am J Roentgenol2011;196:1351– 61CrossRef Medline
30. Hermann GA, Vivino FB, Shnier D, et al.Variability of quantitative scintigraphic salivary indices in normal subjects.J Nucl Med1998; 39:1260 – 63Medline
31. Aung W, Murata Y, Ishida R, et al.Study of quantitative oral radio-activity in salivary gland scintigraphy and determination of the clinical stage of Sjo¨gren’s syndrome.J Nucl Med2001;42:38 – 43 Medline
32. Koh DM.Qualitative and quantitative analyses: image evaluation and interpretation.In: Koh DM, Theony HC.Diffusion-Weighted MR Imaging: Applications in the Body. Berlin: Springer-Verlag; 2010:33– 47
33. Schwenzer NF, Schraml C, Martirosian P, et al.MR measurement of blood flow in the parotid gland without contrast medium: a func-tional study before and after gustatory stimulation.NMR Biomed
2008;21:598 – 605CrossRef Medline
(BOLD)-MRI at 1.5T and 3T.J Magn Reson Imaging2008;27:43– 48 CrossRef Medline
35. Clark HD, Moiseenko VV, Rackley TP, et al.Development of a method for functional aspect identification in parotid using dy-namic contrast-enhanced magnetic resonance imaging and con-current stimulation. Acta Oncol 2015;54:1686 –90 CrossRef Medline
36. Juan CJ, Chang HC, Hsueh CJ, et al.Salivary glands: echo-planar versus PROPELLER diffusion-weighted MR imaging for assess-ment of ADCs.Radiology2009;253:144 –52CrossRef Medline 37. Chang HC, Juan CJ, Chiu HC, et al.Effects of gender, age, and body