ORIGINAL RESEARCH
PEDIATRICS
Development of the Fetal Cerebral Cortex in the
Second Trimester: Assessment with 7T
Postmortem MR Imaging
Z. Zhang, Z. Hou, X. Lin, G. Teng, H. Meng, F. Zang, F. Fang, and S. Liu
ABSTRACT
BACKGROUND AND PURPOSE: Few investigators have analyzed the fetal cerebral cortex with MR imaging of high magnetic strength. Our purpose was to document the sulcal development and obtain quantitative measurements of the fetal brain in the second trimester.
MATERIALS AND METHODS: The brains of 69 fetal specimens, with GA 12–22 weeks, were first scanned on a 7T MR imaging scanner. Then the sequential development of the different fissures and sulci was analyzed, and quantitative measurements of the cerebral cortex were obtained.
RESULTS:A new chronology of sulcal development during 12–22 weeks GA was summarized. Before 12 weeks, few sulci were present; by 16 weeks, many sulci were present. The 16th week could be considered the most intensive time point for sulcal emergence. Most sulci, except for the postcentral sulcus and intraparietal sulcus, were present by 22 weeks GA. Measurements of the fetal brains, each with different growth rates, linearly increased with GA, but no sexual dimorphisms or cerebral asymmetries were detected.
CONCLUSIONS: The second trimester is the most important phase, during which most sulci are present and can be clearly shown on 7T postmortem MR imaging. It is apparent that the specific time during which neuropathologic features of sulci appear, previously thought to be well understood, should be redefined. Quantitative data provide assistance in the precise understanding of the immature brain. The present results are valuable in anatomic education, research, and assessment of normal brain development in the uterus.
ABBREVIATIONS:GA⫽gestational age; US⫽ultrasonography
T
he developmental process of the fetus in vivo is divided into the first, second, and third trimesters, which are closely asso-ciated with the different developmental stages of the CNS. The first and second trimesters correspond to the neurulation, differ-entiation of cerebral vesicles, and neurogenesis.1-3Disorders ofmigration are more likely to occur in the second trimester.
Either undermigration or overmigration of neurons will lead to cortical abnormalities, such as gray matter heterotopia, agyria/pachygyria, heterotopia within the molecular layer (layer 1 of the cortex), and neuronal heterotopia.4Therefore, it is
impor-tant to study fetal brain development in the second trimester. The sulci first appear as shallow fossa and then develop into a deeper and more curved pattern on the cerebral cortex.5,6The
timing of the appearance of these different types of sulci is so precise that neuropathologists consider sulcation to be a reliable estimation of GA and consequently a good marker of fetal brain maturation.6Fetal sulcal development has been studied in
neuro-pathology,5with US7and MR imaging in vitro8and in vivo.6
However, few investigators have described the normal patterns of fetal sulcation with an MR imaging scanner of high magnetic strength.
The dimensions of the developing fetal brain change rapidly in early life, and morphometric normative data are crucial for the assessment of normal maturation and diagnosis of brain anoma-lies.9Currently, prenatal morphometric studies have been
fo-cused as early as 17 weeks GA,10but only the linear biometric
values were obtained on 2D images without 3D reconstruction of the fetal brain. In addition, the existing MR imaging
postprocess-Received August 19, 2012; accepted after revision October 2.
From the Research Center for Sectional and Imaging Anatomy (Z.Z., Z.H., X.L., H.M., S.L.), Shandong University School of Medicine, Shandong, China; Department of Medical Imaging (Z.Z., Z.H.), Provincial Hospital Affiliated with Shandong University, Shandong, China; Department of MR (X.L.), Shandong Medical Imaging Research Institute, Shandong, China; and Department of Radiology (G.T., F.Z., F.F.), Zhong Da Hospital, Southeast University School of Clinical Medicine, Jiangsu, China. This work was supported by the National Natural Science Foundation of China (No. 31071050; No. 81001223), Natural Science Foundation and Doctoral Foundation of Shandong Province (No. ZR2009CM091; No. BS2010YY048), and Promotive Re-search Fund for Excellent Young and Middle-Aged Scientists of Shandong Province (No. BS2010YY042).
Please address correspondence to Shuwei Liu, Research Center for Sectional and Imaging Anatomy, Shandong University School of Medicine, 44 Wen-hua Xi Rd, Jinan, Shandong Province, P. R. China 250012; e-mail address: [email protected].
Indicates open access to non-subscribers at www.ajnr.org
Indicates article with supplemental on-line video
ing software with automated tissue segmentation widely used for adults is not suitable for the fetal brain,11and thus we still lack 3D
reliable and consistent quantitative measurements of the fetal brain at the early developmental phase.
In our study, we present a normal trajectory of fetal sulci de-velopment and obtain quantitative data of the fetal cerebral cortex during 12–22 weeks GA.
MATERIALS AND METHODS
Subjects
A total of 85 fetal specimens of 12–22 weeks GA were obtained from medically indicated or spontaneous abortions, and fetal deaths from hospitals in the Shandong Province of China.
The inclusion criteria were the same as those in our previous research12-15: 1) maternal pregnancy records showing an absence
of documented fetal chromosomal abnormalities, stressful intra-uterine conditions, maternal genetic disease in the families, or a history of seizures in the case of eclampsia; 2) results of US exam-ination for the fetus during pregnancy and results of postmortem MR imaging examinations for the specimen indicating an ana-tomically normal and developmentally appropriate fetal CNS; and 3) further validated detailed autopsy combined with neuro-pathologic examinations also describing no detectable CNS malformations.
Finally, 69 specimens with an appropriately developed fetal brain were reserved for the study (GA dispositions and numbers of the chosen specimens are listed in Table 1). This study was conducted after approval of the Ethical Committee at Shandong University.
Image Acquisition
The brains were not removed from the calvaria and were scanned by a 7T micro-MR with a maximal gradient of 360 mT (70/16 PharmaScan; Bruker BioSpin, Bremen, Germany). A rat body coil with an inner diameter of 60 mm was selected to scan all of the fetuses. For T1-weighted images, section thickness was 0.8 mm; section interval, 0.8 mm; TR, 384.4 ms; TE, 15.8 ms; matrix size, 512⫻512; number of excitations, 1; and field of view, 6⫻6 cm. For T2-weighted images, section thickness was 0.5 mm; section interval, 0.5 mm; TR, 17,000 ms; TE, 50 ms; matrix size, 256⫻ 256; number of excitations, 4; and field of view, 6⫻6 cm.
Structure Annotation, 3D Reconstruction, and Quantitative Measurements
The brain structures were assigned and annotated based on a his-tology atlas of second-trimester fetal brains.16The T2-weighted
images were segmented and reconstructed by Amira 4.1 software (www.amira.com). The segmentation on the cortical surface was performed at the borderline between the cortical plate and the marginal zone (Fig 1A, C). The 3D reconstruction models were automatically obtained after segmentation. We simultaneously segmented all images twice using 2 anatomists to obtain a mean. After segmentation, a polygonal surface model was created. The Amira software was used to generate a triangular surface grid for the brain embedded in a voxel dataset. Then the surface area for each triangular grid was summed to obtain the surface area of the whole brain. A brain mask for the 3D volume was created by segmentation. All of the voxels in the mask were accumulated to obtain brain volume, and a linear interpolation method was used to get the voxels in the gap between 2 sections. The brain volume and surface area were just of the supratentorial brain, and the ventricles were included.
Brain length, width, and height were also calculated. Brain height was defined as the vertical distance between 2 horizontal planes, containing the most superior and inferior points of the brain, respectively. Brain length and width were defined in a sim-ilar fashion (Fig 1D).
Statistical Analysis
Our criterion to define a sulcus is the same as that used by Garel et al.6A clear indentation at the surface of the brain was
consid-ered to be the earliest indication of a sulcus. One sulcus was con-sidered to be present if it was observed in more than 75% of cases, detectable if observed in 25% to 75% of cases, and absent if ob-served in less than 25% of cases. A pairedttest was used to detect significant differences in sex and hemispheres. All of the statistical work was done with SPSS version 17.0 (SPSS, Chicago, Illinois).
RESULTS
Of the 69 specimens, 31 were male and 38 were female. All were from the Chinese Han ethnic group with an average age of 18.348⫾2.869 weeks GA. The GA span of male specimens was 13–22 weeks (mean⫾SD, 18.129⫾2.592 weeks GA), and the GA span of female specimens was 12–22 weeks (mean⫾SD, 18.526⫾ 3.100 weeks GA). There were no significant sex differences in GA (P⫽ .571). There was no statistically significant interobserver variation (P⫽.810) at preliminary analysis.
Sulci
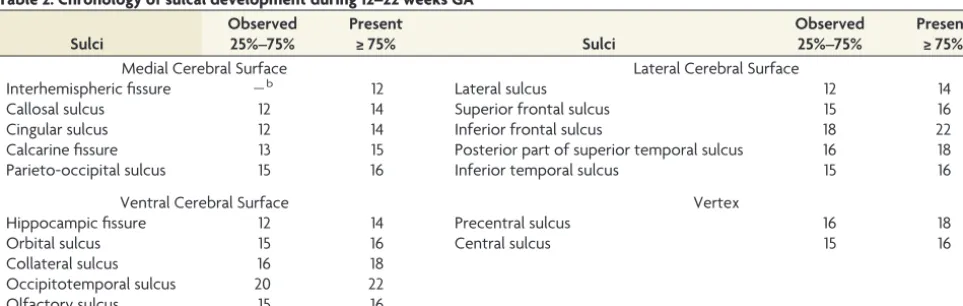
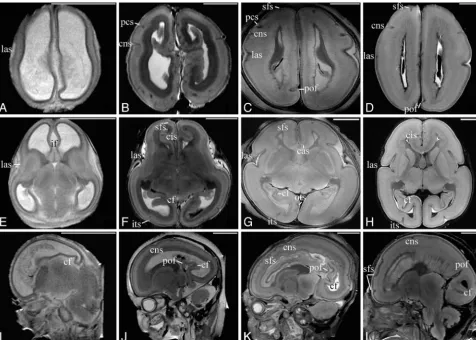
The chronology of sulcal development during 12–22 weeks GA is listed in Table 2. At 12 weeks GA, few sulci except the interhemi-spheric fissure and the lateral sulcus were present (Fig 2A, -E). By 16 weeks GA, many sulci were present, such as the central sulcus, the superior frontal sulcus, calcarine fissure, and parieto-occipital sulcus (Fig 2B, -F,and-J), and the 16th week GA could be con-sidered to be the most intensive point of sulcal emergence. At 20 weeks GA, the present sulci became a little deeper and more ob-vious on the cortical surface (Fig 2C, -G,and-L). The collateral sulcus and the posterior part of the superior temporal sulcus
Table 1: GA dispositions and numbers of chosen specimens (nⴝ69)
GA Number
12 3
13 3
14 3
15 4
16 5
17 7
18 4
19 6
20 16
21 12
emerged as well. Most sulci, except the postcentral sulcus and intraparietal sulcus, were not present until 22 weeks GA (Fig 2D, -H). At this point, all of the visible sulci were straight, immature, and had not developed the secondary branches (Fig 2). In addi-tion, most appeared deeper and more distinguishable at the right hemisphere, especially the superior frontal sulcus and the central sulcus (Fig 2B, D).
The lateral sulcus, which was the first to be distinguished, was the most obvious of all of the sulci. During 12–22 weeks GA, the lateral sulcus became deeper and wider, with the opercula insulae approaching each other. However, the opercula insulae did not fold until 22 weeks GA (Fig 2E–H).
The calcarine fissure and the parieto-occipital sulcus were the most prominent in the medial cerebral surface. The emergence time of the calcarine fissure was a little earlier than that of the parieto-occipital sulcus, and they gradually became separate by 20 weeks GA (Fig 2I–L).
The appearance of all of the other sulci, such as the central sulcus, the posterior part of the superior temporal sulcus, and the superior frontal sulcus, did not change much and remained shal-low and tiny before 22 weeks GA (Fig 2).
3D Visualization Model of the Fetal Brain
The 3D visualization model demonstrates well the morphologic changes of the cortical surface (Fig 3). Most sulci, delineated as shallow fossae on the cerebral surface, could be observed (Fig 3), such as the lateral sulcus, central sulcus, and superior frontal sul-cus. The length, depth, and location of the sulci could also be
clearly demonstrated (Fig 3). The sulci were discontinuous and appeared as a cluster of separated shallow fossae, which merged together to form a single immature sulcus after 16 weeks GA (Fig 3B–D), such as the central sulcus and inferior temporal sulcus. The lateral sulcus was described as a wide fossa on the cortical surface (Fig 3). It became deeper as GA increased, and the oper-culum insulae did not fold until 22 weeks GA (Fig 3D).
Quantitative Assessment of the Fetal Brain
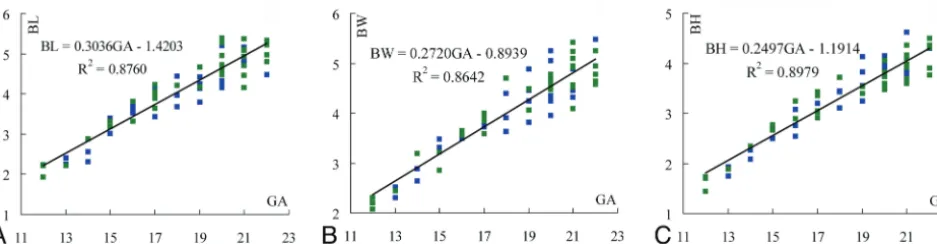
From the slope of the lines, it could be concluded that the total cerebrum was developing at a different speed. The brain surface area and volume increased the fastest (Fig 4), followed by its length (Fig. 5A). The height increased the slowest (Fig. 5C). There were no sexual dimorphisms or cerebral asymmetries in the mea-surements (P⬎.05).
DISCUSSION
Sulcation in the Second Trimester
Development of the fetal cerebral cortex is defined by changes of the sulci, because they are indicators of brain maturation.5,6
Ex-ploring the sequential development of sulci can greatly enrich our knowledge of prenatal radiology and will supply certain guidance for assessing normal cortical development in vivo.1-3
Our results show that most of the sulci can be observed much earlier on 7T MR imaging than on in vivo fetal MR imaging. An example of this is the central sulcus, which is commonly observed on fetal MR imaging at 24 –25 weeks GA,6but can be clearly
ob-served on 7T postmortem MR imaging at 16 weeks GA. Thus, we
[image:3.594.55.533.48.171.2]FIG 1. Methods of image segmentation with Amira 4.1.A, The original image.B, Segmentation of the hemisphere.C, Different colors are filled in the structures after segmentation.D, 3D visualization model and measurements of brain length, width, and height.
Table 2: Chronology of sulcal development during 12–22 weeks GAa
Sulci
Observed Present
Sulci
Observed Present
25%–75% ≥ 75% 25%–75% ≥ 75%
Medial Cerebral Surface Lateral Cerebral Surface
Interhemispheric fissure ⫺b 12 Lateral sulcus 12 14
Callosal sulcus 12 14 Superior frontal sulcus 15 16
Cingular sulcus 12 14 Inferior frontal sulcus 18 22
Calcarine fissure 13 15 Posterior part of superior temporal sulcus 16 18
Parieto-occipital sulcus 15 16 Inferior temporal sulcus 15 16
Ventral Cerebral Surface Vertex
Hippocampic fissure 12 14 Precentral sulcus 16 18
Orbital sulcus 15 16 Central sulcus 15 16
Collateral sulcus 16 18
Occipitotemporal sulcus 20 22
Olfactory sulcus 15 16
a
Sulci were present on 7T postmortem MR imaging scans.
[image:3.594.55.537.216.369.2]believe that MR imaging with higher magnetic strength can delin-eate small sulci earlier.
There were inconsistencies between our results and those of previous research. For example, we found the central sulcus at 16 weeks GA, but Chi et al5found it at 20 weeks GA on
neuropatho-logic examinations. We found that the superior frontal sulcus and inferior temporal sulcus had already been present at 16 weeks GA in almost all of the specimens, but Chi et al5described the
neuro-pathologic appearance of the these 2 sulci at 25 weeks and 30 weeks GA, respectively. These inconsistencies need to be studied further. Genetic, environmental, nutritional, and other differ-ences exist between our generation and past generations, as well as between white and Asian races,17which may affect the
develop-mental speed of the fetal brain. The emergence time of sulci, de-scribed in great detail in anatomic and embryologic books and in published studies, should be re-examined.
FIG 2. Transverse T2-weighted 7T MR images of 12 (A,E), 16 (B,F), 20 (C,G), and 22 (D,H) weeks GA. Sagittal T2-weighted 7T MR images of 13 (I), 16 (J), 18 (K), and 20 (L) weeks GA. The lateral sulcus and the interhemispheric fissure can be distinguished at 12 weeks GA (A,E). At 16 weeks GA, more sulci can be observed (B,F), such as the central sulcus and the superior frontal sulcus. At 20 –22 weeks GA, the sulci are more clearly delineated (E–H). On the sagittal images, development of the calcarine fissure, the parieto-occipital sulcus, the central sulcus, and the superior frontal sulcus can be clearly distinguished. The bar in each figure represents 1 cm; if, interhemisphaeric fissure; cas, callosal sulcus; cis, cingular sulcus; cf, calcarine fissure; pof, parieto-occipital sulcus; ots, occipitotemporal sulcus; las, lateral sulcus; sfs, superior frontal sulcus; its, inferior temporal sulcus; pcs, precentral sulcus; cns, central sulcus.
[image:4.594.57.534.46.386.2] [image:4.594.56.534.468.581.2]There are many possible reasons for the inconsistencies be-tween our results and those described in past research,14such as
fluid loss of the fetal brain caused by fetal death or formalin fixa-tion, method of describing the presence of a sulcus (being ob-served in more than 75% or 50% cases), method of examination (US or MR imaging of different magnetic strength), different races (Asian or Western), and other unknown reasons. It is thought that all of these variables cannot lead to such an appre-ciable difference between our chronology of sulcal development and that of Chi et al.5
In our study, the sulci are described as a cluster of separated shallow fossae at 16 weeks GA, termed “sulcal roots” in previous research.18 It can be concluded that sulcal development starts
from several separated fossae on the cerebral surface, these fossae then join together, and a single complete sulcus is formed. The 16th week of GA may be considered as the original point for for-mation of the sulcal roots.
Quantitative Measurements of the Fetal Brain in the Second Trimester
Quantitative analysis in our study may provide valuable assis-tance in modeling normal fetal brain development. Currently, quantitative data on the fetal brain mainly come from research on neonates or premature infants,19,20and very little is known
about the range of normal values in the first and second tri-mesters. Therefore, our measurements, obtained from a large cohort, may be a valuable reference to determine whether the cortex is developing normally during the midtrimester.
Al-though the fetuses in our study have undergone formalin fixation, which slightly reduces the volume and increases the width of the sulci, previous studies have confirmed the clinical application of these measurements.8,12-14,21
Our measurements of the surface area and volume of the brain at 13–21 weeks GA were approximately 10 cm2and 5 cm3greater
than those of Huang et al,22obtained with 11.7T and 4.7T
post-mortem MR imaging, respectively. However, our results might be more accurate because they were obtained with 7T MR imaging from a greater amount of specimens, and all of the specimens were scanned in situ, which may have avoided deformations caused by human factors or gravity when the brain is removed from the cranial cavity.
Brain length in our research was roughly 0.5 cm smaller than the fronto-occipital diameter of 20 –22 weeks GA, described by Parazzini et al,9and was roughly 1 cm smaller than the
fronto-occipital diameter of 17–22 weeks GA, described by Moreira et al.10For brain width, our research demonstrates a width of
ap-proximately 0.5 cm greater than the cerebral biparietal diameter described by Parazzini et al9and Moreira et al.10These
inconsis-tencies are mainly the result of different definitions of brain mea-surements found in our research and in theirs. Our meamea-surements may be more convincing because they were obtained from 3D visualization models based on MR imaging of high magnetic strength instead of 2D in vivo fetal MR imaging.
There have been 2 opposing views in US research about whether sexual dimorphisms and cerebral asymmetries are
pres-FIG 4. Quantitative measurements of fetal brain surface area and volume. The measurements increase linearly with GA. The surface area increases faster. Surface area is in square centimeters, and volume is in cubic centimeters. BA indicates brain surface area; BV, brain volume. The blue points represent the males, and the green represent the females.
[image:5.594.138.449.50.174.2] [image:5.594.61.530.225.347.2]ent in fetal brains in the second half of gestation,23-25but MR
imaging studies have discovered these features in premature and neonatal brains.19,24Our results, however, indicate that no
signif-icant sexual dimorphisms and cerebral asymmetries are present during the second trimester. Because the total number of subjects and their distribution in each GA group are relatively small, it can only be suspected that brain sexual differentiation starts in the third trimester, when the brain has finished the initial develop-mental phase and will step into an accelerated and complicated developmental period.
Superiority of 7T Postmortem MR Imaging in
Demonstration of the Fetal Brain in the Second Trimester
The low-image contrast of in vivo fetal MR imaging precludes the application of postprocessing tools dedicated to the adult brain.11
However, postmortem MR imaging obtained with high magnetic strength is of high quality and is sufficient for segmentation, re-construction, and quantitative analysis. The consistency in dem-onstrating the cortical surface between the gross anatomy and the 3D visualization model has been proved.14Manual segmentation,
which may be both tedious and time-consuming for large imag-ing, is much more precise than automatic segmentation, espe-cially for the immature fetal brain. It is thought that these 3D visualization models, with dynamic demonstration, can exactly delineate developmental changes of the fetal brain during the sec-ond trimester, and supply quantitative data about the cortical surface area and volume that is hard to obtain by US, in vivo MR imaging, or histology studies. Our results may benefit the com-prehension of immature structures in the second trimester.
CONCLUSIONS
The second trimester is the most important phase, during which most sulci are present and can be clearly shown on 7T postmor-tem MR imaging. Perhaps the specific time during which neuro-pathologic features of sulci emerge, previously thought to be well understood, should be redefined. Quantitative data assist greatly in the precise understanding of the immature brain. Measure-ments of fetal brains with different growth rates increase linearly with GA. Fetal brain sexual dimorphisms and asymmetries may arise and develop during the third trimester. Our results are valu-able in anatomic education, research, and assessment of normal brain development in the uterus.
ACKNOWLEDGMENTS
We thank Hamed Haghnazar, Sam Hobel, and Xuntao Yin for linguistic advice during the revision.
REFERENCES
1. Encha-Razavi F, Sonigo P.Features of the developing brain.Childs Nerv Syst2003;19:426 –28
2. Prayer D, Kasprian G, Krampl E, et al.MRI of normal fetal brain development.Eur J Radiol2006;57:199 –216
3. Glenn OA.MR imaging of the fetal brain.Pediatr Radiol2010;40: 68 – 81
4. Fogliarini C, Chaumoitre K, Chapon F, et al.Assessment of cortical
maturation with prenatal MRI: part II: abnormalities of cortical maturation.Eur Radiol2005;15:1781– 89
5. Chi JG, Dooling EC, Gilles FH.Gyral development of the human brain.Ann Neurol1977;1:86 –93
6. Garel C, Chantrel E, Brisse H, et al.Fetal cerebral cortex: normal gestational landmarks identified using prenatal MR imaging.AJNR Am J Neuroradiol2001;22:184 – 89
7. Monteagudo A, Timor-Tritsch IE.Development of fetal gyri, sulci and fissures: a transvaginal sonography study.Ultrasound Obstet Gynecol1997;9:222–28
8. Hansen PE, Ballesteros MC, Soila K, et al.MR imaging of the devel-oping human brain. Part 1. Prenatal development.Radiographics
1993;13:21–36
9. Parazzini C, Righini A, Rustico M, at al.Prenatal magnetic resonance imaging: brain normal linear biometric values below 24 gestational weeks.Neuroradiology2008;50:877– 83
10. Moreira NC, Teixeira J, Themudo R, et al.Measurements of the nor-mal fetal brain at gestation weeks 17 to 23: a MRI study. Neuroradi-ology2011;53:43– 48
11. Habas PA, Kim K, Rousseau F, et al.Atlas-based segmentation of developing tissues in the human brain with quantitative validation in young fetuses.Hum Brain Mapp2010;31:1348 –58
12. Zhang Z, Liu S, Lin X, et al.Development of fetal cerebral cortex: assessment of the folding conditions with post-mortem magnetic resonance imaging.Int J Dev Neurosci2010;28:537– 43
13. Zhang Z, Liu S, Lin X, et al.Development of laminar organization of the fetal cerebrum at 3.0T and 7.0T: a postmortem MRI study. Neu-roradiology2011;53:177– 84
14. Zhang Z, Liu S, Lin X, et al.Development of fetal brain of 20 weeks gestational age: Assessment with post-mortem magnetic resonance imaging.Eur J Radiol2011;80:e432–39
15. Meng H, Zhang Z, Geng H, et al.Development of the subcortical brain structures in the second trimester: assessment with 7.0-T MRI.Neuroradiology2012;54:1153–59
16. Bayer SA, Altman J.The human brain during the second trimester.
In: Atlas of Human Central Nervous System Development, Indianapolis: CRC Press; 2005
17. Tang Y, Hojatkashani C, Dinov ID, et al.The construction of a Chi-nese MRI brain atlas: a morphometric comparison study between Chinese and Caucasian cohorts.Neuroimage2010;51:33– 41 18. Re´gis J, Mangin JF, Ochiai T, et al.“Sulcal root” generic model: a
hypothesis to overcome the variability of the human cortex folding patterns.Neurol Med Chir (Tokyo) 2005;45:1–17
19. Dubois J, Benders M, Borradori-Tolsa C, et al.Primary cortical fold-ing in the human newborn: an early marker of later functional de-velopment.Brain2008;131:2028 – 41
20. Dubois J, Benders M, Cachia A, et al.Mapping the early cortical folding process in the preterm newborn brain.Cereb Cortex2008; 18:1444 –54
21. Torkildsen A.The gross anatomy of the lateral ventricles.J Anat
1934;68:480 –91
22. Huang H, Xue R, Zhang J, et al.Anatomical characterization of hu-man fetal brain development with diffusion tensor magnetic reso-nance imaging.J Neurosci2009;29:4263–73
23. Tilea B, Alberti C, Adamsbaum C, et al.Cerebral biometry in fetal magnetic resonance imaging: new reference data.Ultrasound Obstet Gynecol2009;33:173– 81
24. Kivilevitch Z, Achiron R, Zalel Y.Fetal brain asymmetry: in utero sonographic study of normal fetuses.Am Obstet Gynecol2010;202: 359.e1– 8