Munich Personal RePEc Archive
AN ANALYSIS OF PERFORMANCE
IN E-COMMERCE INDUSTRY
azahar, intan nur asyiqin
Universiti Utara Malaysia
18 November 2019
“AN ANALYSIS OF PERFORMANCE IN E-COMMERCE INDUSTRY”
INTAN NUR ASYIQIN AZAHAR
Universiti Utara Malaysia
ABSTRACT
The study’s aim is an attempt to determine the altogether performance of Amazon company in
e-commerce industry which involved two main factors of internal (firm-specific) and external (macroeconomics) factors. These data was interpreted and collected from Amazon annual reports of five year period from 2014 to 2018. There are four risks involved which are liquidity risk, credit risk, operational risk, and market risk. Measurement of current ratio, quick ratio, average-collection period, debt to income ratio, operational ratio, and operating margin are used to inspect the general five years execution of Amazon from e-commerce industry. Subsequently, to decide the relationship of these risk variables to the business' exhibition, this investigation used liquidity risk, credit risk, operational risk, market risk, gross domestic products (GDP), inflation, interest rate, exchange rate, standard deviation, and corporate governance index. SPSS framework are utilized to do information examination in which by actualizing stepwise strategy which apply the descriptive statistics, correlation, and model summary. In view of the information examination, we can presume that operational risk is the most influence to ROA since it gives the most effect to performances of the business. Regardless, different factors give low effect to the ROA and there is no noteworthy related with.
2
1.0 INTRODUCTION 1.1Introduction
The beginning of this chapter comprise of overview of Amazon company. Later, discussing the problem statement, objectives of research, the study’s scope, and final research organization.
1.2 Overview of industry
E-commerce is define as an activity of product and services buying and selling by electronic means. E-commerce industry in the United States has showed big progress for these past few years. In fact, it grew from total of 505 billion dollars in 2018 and projected to exceed 735 billion USD dollars in 2023. For now, it was recorded that Amazon is the most popular e-commerce company in the United States. About 1/3 of United States internet users purchased products online at least once a month. The e-commerce market has been growing as mobile shopping applications increased in number and this is one of the major contributions to e-commerce industry growth in the United States.
1.3 Problem Statement
It is very important for e-commerce industry in management of their performance as to prevent themselves from bankruptcy. Because of risks like liquidity risks, credit risks, operational risks, and market risks, risk often occurs to e-commerce industry. The problem here
is when industry’s performance decrease, it will affect the companies badly and worst case is
lead to bankruptcy. The bad performance indicates that management of companies are not efficient and this will give a signal for investors and shareholders from investing in e-commerce
industry. Hence, the identification of factors with performance as necessary actions can be taken.
1.4 Research objectives
In general, this study was designed in the determining e-commerce industry’s performance and its determinants. The objectives of this study are:
3
1.5 Research Questions
1. Does any relationship exist between internal factors and performance?
2. Does any relationship exist between external factors and performance?
3. Does any relationship exist between both factors and performance?
1.6 Scope of Study
The study sample is Amazon company of e-commerce industry. In calculating the financial ratios, data are taken from five year of annual reports from 2014 to 2018 of respective five companies.
1.7 Organization of the Study
4
2.0 LITERATURE REVIEW
2.1INTRODUCTION
This chapter is devoted to background of the company and review literature related to
research.
2.2BACKGROUND OF THE COMPANY
Amazon was founded as a result of what Jeff Bezos called his "regret minimization
framework", which described his efforts to fend off any regrets for not participating sooner in the Internet business boom during that time. In 1994, Bezos left his employment as vice-president of D. E. Shaw & Co., a Wall Street firm, and moved to Seattle, Washington, where he began to work on a business plan for what would become Amazon.com.
On July 5, 1994, Bezos initially incorporated the company in Washington State with the name Cadabra, Inc. He later changed the name to Amazon.com, Inc. a few months later, after a lawyer misheard its original name as "cadaver".In its early days, the company was operated out of the garage of Bezos's house on Northeast 28th Street in Bellevue, Washington. In September 1994, Bezos purchased the domain name relentless.com and briefly considered naming his online store Relentless, but friends told him the name sounded a bit sinister. The domain is still owned by Bezos and still redirects to the retailer.
Bezos selected the name Amazon by looking through the dictionary; he settled on "Amazon" because it was a place that was "exotic and different", just as he had envisioned for his Internet enterprise. The Amazon River, he noted, was the biggest river in the world, and he
planned to make his store the biggest bookstore in the world. Additionally, a name that began with "A" was preferred because it would probably be at the top of an alphabetized list. Bezos placed a premium on his head start in building a brand and told a reporter, "There's nothing about our model that can't be copied over time. But you know, McDonald's got copied. And it's still built a huge, multibillion-dollar company. A lot of it comes down to the brand name. Brand names are more important online than they are in the physical world."
5
and gauge exchange off uniquely in contrast to some different organizations. accordingly, it is imperative to investors, to comprehend our central administration and basic leadership approach so you may guarantee that it is predictable with your very own venture theory.
Amazon representatives are utilizing their organization gave stock to pressure top officials into lessening commitments to environmental change. Amazon's intermediary explanation, incorporates a representative sponsored goals requesting that the organization report freely on how it intends to lessen its dependence on non-renewable energy sources and deal with the dangers presented by environmental change. On Wednesday, supporters discharged an open letter marked by in excess of 5,200 representatives approaching CEO Jeff Bezos and the top managerial staff to help the goals. In the letter, the representatives additionally requested that Amazon quit offering its cloud administrations to the oil and gas enterprises.
Tech giant like Amazon may have their organizations' own ethos to fault. For tech labor, portions of stock (or investment opportunities) are a typical piece of pay bundles, enabling representatives to utilize their stake in an organization as something other than a brilliant pass to mogul.
Amazon laborers' environmental change investor proposition was documented in
December, and will be put to a vote by investors at the organization's yearly gathering on May 22, alongside 11 other investor supported recommendations. The reiteration of issues brought up in these recommendations address a considerable lot of the most squeezing contentions confronting the organization. Amazon's board suggested casting a ballot against every one of them in the intermediary proclamation.
Jamie Kowalski, an Amazon programming engineer who was among the representatives who recorded the goals, called the board's resistance "a stage off course and sends an
inappropriate message to our workers." Kowalski said "it's reasonable by the way that more than 5,400 workers have marked our letter that we're energetic about Amazon turning into a pioneer on environmental change.
6
only a few senior managers to talk to NYT reporters for its article, and declined requests for
interviews with Jeff Bezos, the company's founder and CEO, and his top leaders. The problem issue in the company is unreasonably high standards and expectations, breeding unhealthy competition among co-workers,insensitive management, favouring criticism
over harmony, lack of praise and unfair systems of ranking.
Definition of Corporate Governance, Credit Risk, Operational Risk, Liquidity Risk and Market Risk and Performance
2.3Corporate Governance
As per the Securities and Exchange Commissions (2017), corporate administration is a structure and practice of the relationship so as to advance straightforwardness and
responsibility of the top managerial staff so as to assemble certainty among speculators. To raise capital and be a freely recorded organization, such certainty is basic. The key
explanation behind the disappointment of directing corporate administration is that it depended on a consistence way to deal with box ticking. A maintainability procedure, consequently, applies a principal way to deal with corporate administration to ensure that people with great influence responsible. Responsibility is in this manner a columns to corporate administration (Raut, 2014). a decent corporate administration structure probably won't demonstrate that an organization is executing a viable corporate administration rehearses.
Great corporate administration is progressively recognized as a huge driver of long haul speculation and has gotten an essential subject in monetary circles. Such administration has
become important for any association genuine about improving its exhibition. The writing regarding this matter likewise contains proof of a positive connection between's the degree of corporate administration and bank emergencies. Corporate administration is viewed as an indispensable key to understanding institutional proficiency and efficiency.
7
2.4Credit Risk
Credit risk is essential to monetary organizations. Particularly in the here and now where
money isn't just constrained to paper yet the estimation of monetary standards and items is of intangibility like digital forms of money. Moreover, it tends to be comprehended that credit risk is a potential open door for the borrower to neglect to pay the advance to the money related establishment for the time given.
Flip-over is where a generally safe portion has a bigger estimation of hazard gauge than a high chance section. It is generally brought about by over-division when professionals look for biased power avariciously in the model advancement organize. This implies a section is compelled to part encourage into a few little portions for an appropriate in-test increment of the unfair power, yet they have no conspicuous contrast from the populace viewpoints. At the point when flip-over happens, experts ordinarily join portions physically, or through various level bunching.
2.5Operational Risk
Operational risk management recognizes, measures, oversees, controls and reports the operational danger of the entire undertaking. For the monetary help industry, particularly for money related middle people, for example, banks, risk is constantly an unavoidable thing to do business. Be that as it may, because of the missteps of banks, the vulnerability of the market and the change of the capital market, the destructiveness of dangers and the outcomes brought about by antagonistic hazard the board are increasingly genuine. The developing volume of exchanges and the requirement for computerization and speed have driven up the expense of risk.
Operational chance the board is a significant viewpoint in an association to oversee
operational chance proficiently. Henceforth, the article proposed to examine the impacts of
inside and outer factor in assembling industry towards operational hazard. This examination utilizes time arrangement relapse investigation of assembling industry in Germany from 2012
8
2.6Liquidity Risk
Liquidity, is the capacity of a bank to subsidize increments in resources and meet
remarkably due, without bringing about inadmissible misfortunes. The central job of banks in the development change of transient stores into long haul credits makes banks
characteristically cannot protect against liquidity chance. Liquidity dangers can't be
segregated from foundational dangers. In this manner, it will fuse the jobs accepted by data asymmetries and market put together guideline – consequently expound with respect to how market based guideline could serve to address issues which trigger liquidity dangers.
Defective information being a factor which is contributory to liquidity emergencies and bank runs, and market based guideline being basic in encouraging revelation.
Liquidity creation are the two key elements of a bank. Liquidity Creation assumes a
significant job in the economy, yet there is no thorough proportion of liquidity creation that exists in our nation. This investigation assesses the notional estimation of liquidity made by Scheduled business banks in India during the period 2005 to 2018. We have created four proportions of liquidity creation by Indian Banks, said Berger and Bouwman (2009). Holmstrom and Tirole, 1998; Kashyap, Rajan, and Stein, 2002, Liquidity creation is one of the crucial capacities performed by a bank. Liquidity is said to be made when illiquid resources are financed with fluid liabilities. Cockeyed exercises additionally add to liquidity creation.
2.7Market Risk
Risk evaluation is an important condition for computing financial capital and go about as a foundation of the executive choice. Along these lines, bank pay impact by showcase hazard which is affecting on and shaky sheet positions cost.
This investigation comprises of three model to be tried which are Model 1 that thinks about inner variables, Model 2 looks at the outside elements and Model 3 incorporate both of inward and outer components. The point of this examination is to explore the components that affected the market valuation.
9
comprehended as only identified with globalization. Albeit a few firms can move seaward all in all, ebb and flow innovative change permits fissuring the working environment and even the activity of the various undertakings of occupations (Weil, 2014).
2.8Performance
Performances is one of the critical pointer to decide if the organization is working admirably and speak to the notoriety to the network. Figuring is made by utilizing money related data from the yearly report.
Individual and friends dealing has progressively replaced part and nation aggregate bartering prompting progressively punctured and multi-layered national aggregate haggling
frameworks. In this paper, we build up a thorough order of dealing and contend that both the haggling level and the level of integrative communication between bartering units matters for adequacy. This thought is tried utilizing delegate organization level information for the European Union. We find that the adequacy of composed division and staggered frameworks is higher than for every other type of dealing. Approach suggestions are talked about as these outcomes challenge current attempts to change aggregate dealing in Europe.
2.9The Importance of Corporate Governance
Great corporate governance adds to reasonable financial advancement by improving the presentation of organizations and expanding their entrance to outside capital. In developing markets great corporate administration serves various open approach destinations. It
diminishes weakness of the budgetary emergencies, fortification property rights; decreases
exchange cost and cost of capital and prompts capital market advancement. Corporate administration concerns the relationship among the administration, directorate, controlling investors, minority investors and different partners.
10
3.0METHODOLOGY
3.1Introduction
Cohen and Manion (1996) characterize the system as an exploration strategy for gathering information. This technique is used to accomplish the objective of the investigation and accordingly gets ideal outcomes toward the finish of the examination. This examination plans to comprehend the portability of the e-commerce business and its determinants. The strategy used to gather information is the Social Science Statistics Package (SPSS) version 25.
3.2Data and sample
In order to direct this investigation, one organizations was picked as tests. The organizations are web based business organization which is Amazon. Information from the yearly reports from the year 2014 until 2018 is used to know the
dependent variables (return on asset) and the independent variables (internal factors and macroeconomic elements).
3.3Statistical technique
I pick Amazon.com to lead this investigation as a web based business
organization situated in Seattle, Washington. I gathered the organization's yearly report (from 2014 to 2018) and utilized the point by point data in the income statement and the balance sheet in these yearly reports to ascertain the
organization from all perspectives, (for example, profitability, liquidity,
11
3.4Data Analysis
There are one dependent variable and three independent variables in this study, based on the conceptual framework of research in the future. The research framework as follow:
Independent Variables (IV) Dependent Variables (DV)
Figure 3.1 Research Framework
To decide the impact of independent variables on the dependent variables, multiple regression analysis was used. This sort of strategy will describe the impact of independent variables on the dependent variable. Multiple regression can be communicated by the accompanying equation:
ROA = β0 + β1CR + β2ACP + β3OR + β4OM + β5QR + β6DIR + β7INDXS +
e... Equation 1
ROA = β0 + β1INFLA + β2BETA + β3INTR + β4EXCGR + β5GDP +
e... Equation 2
ROA = β0 + β1CR + β2ACP + β3OR + β4OM + β5QR + β6DIR + β7INDXS + β8INFLA + β9BETA + β10INTR + β11EXCGR + β12GDP +
e... Equation 3 return on asset
ROA Internal factors
Macroeconomic factors
12
Table 3.1 Measurement of Variables
No Variables Notation Measurement
1 Return On Asset ROA Net Income/ Total Assets
2 Current Ratio CR Current asset / Current Liability 3 Quick Ratio QR (Current Asset – Inventories – Prepaid
Expenses) / Current Liabilities
4 Average
Collection Period
ACP Account Receivable / (Net Sales/360)
5 Debt-to-income DTI Total Liability / Total Income
6 Operational Ratio OPR Operating Expenses / Net Sales x 100
7 Operating Margin OPM EBIT / Revenue 8 Corporate
Governance Index
CGI Disclosure or score of 1 is given, otherwise zero, on following item :
i. Accountability ii. Transparency iii. Independence iv. Fairness
v. Sustainability 9 Gross Domestic
Products
GDP Economic Growth
10 Inflation INF Consumers Price Index
3.5Statistical Package for Social Sciences (SPSS)
13
4.0FINDING AND ANALYSIS
4.1Descriptive statistic
Descriptive Statistics
Mean Std. Deviation N
ROA .022769007220618 .025422102477614 5
CURRENT RATIO 1.074834707400354 .032760420784269 5
QUICK RATIO .797327961934529 .035071755649304 5
AVERAGE-COLLECTION PERIOD
23.76230408732279
6
2.289940275971137 5
DEBT TO INCOME 63.86324735733238
0
101.9360500867610
10 5
OPERATIONAL RATIO .973985942815178 .018580154473506 5
OPERATING MARGIN .022854635968579 .017462200695538 5
GDP 2.420 .5450 5
Inflation 1.500 .8916 5
InterestRate 2.020 .4266 5
ExchangeRate 1.00 .000 5
STDV 12.64017728334559
2
11.03812527403934
7 5
[image:15.595.109.498.169.605.2]Cgi .800 .0000 5
Table 4.1 Table of Descriptive Statistics of Model 3
A descriptive statistics table 4.1 above shown dependent variable, internal factors
of the company and macroeconomic factors from year 2014 until 2018. The return of asset ratio for the five year stated the mean of 2.27% indicates that Amazon company
14
effective among the 5 years. Meanwhile the standard deviation is 2.54%. The standard deviation used to identify data of the mean. Hence, it is clearly show that the return of the e-commerce does not vary larger from average within five years. The higher the standard deviation indicates that ROA has a larger change from average. According to
Brigham and Houston (2001), return on asset (ROA) is calculated by comparing obtainable income for common shareholders to total assets. Higher ROA value indicates more good of company performance, as a result of higher return on
investment rate. This value reflects the company's return on all assets provided to the company (Wild et al, 2005). The most significant variables which affecting the performance of company is operational risk. For operational risk, the mean of operating margin is 0.0228 % lower than the mean of operational ratio which is 0.9739% where indicating that company earn low of profit among the past 5 years while standard deviation of operating margin is 0.0174% and the standard deviation of operational ratio is 0.0185% explaining that low portion in the changes of the operational risk in the same period. According to Chua 1996, knowing the
fundamental source of an operational risk event is central and helps an organization to understand and control this risk in the future.
From the table, we can see that, current ratio has the higher mean 1.074% and lower standard deviation 0.0327% compared to quick ratio which the mean is 0.797%
and standard deviation 0.0350% in term of liquidity risk. If a company’s current
liabilities exceed the number of current assets, the firm might face some issue to pay back the creditors within the short term period. If this problem occurs, the company could end up into bankruptcy. According by Nicholas (1991) that corporations who
15
4.2Trend analysis
[image:17.595.107.451.143.354.2]4.2.1 Performance
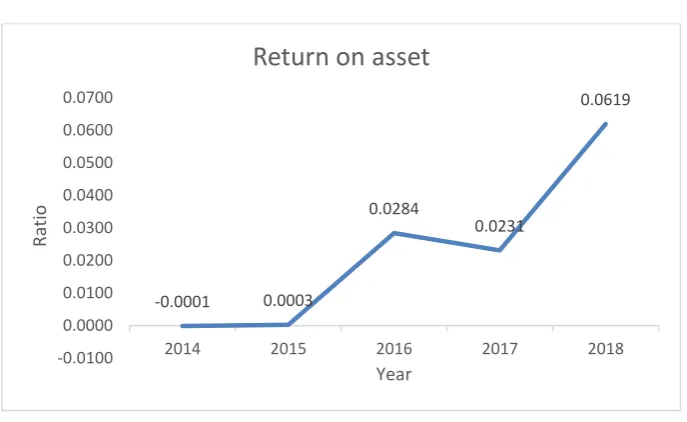
Figure 4.1 Return on Asset
Figure 4.1 above shown the return on asset from year 2014 until 2018. This ratio
is use to measures the profitability of the company to its total assets. Return on asset is defined as the ability of the company to generate their earning in a certain period (harahap 2002). Roa also helps the investors to see if the company is able to convert the asset to the profits. Based on the graph, the highest roa is in year 2018 which is 6.19% and the lowest is in year 2014 is -0.01%, so that means the performances of the company is better in 2018 compared to other year.
-0.0001 0.0003
0.0284
0.0231
0.0619
-0.0100 0.0000 0.0100 0.0200 0.0300 0.0400 0.0500 0.0600 0.0700
2014 2015 2016 2017 2018
Rat
io
16
[image:18.595.107.439.75.293.2]4.2.2 Liquidity Risk
Figure 4.2 Current Ratio
Liquidity risks emerges when an organization experiences issues or incapable to meet its short term financial demand when they fall due. It estimated by current proportion which is a marker contrasting organization's current asset with its current liabilities. by looking at the chart above, in 2014 has the highest current ratio (1.1153 times) among all the five years. It shows that in 2016 has 1.1153 of current asset for cover up of current liabilities. Amazon has lower liquidity risk since it can pay its short term loans on time when it is expired. In any case, too high current ratio likewise shows that Amazon is wasteful in using its current asset to create income. Then, in 2017, it is presented to higher liquidity risk since it just has 1.0400 of current asset to cover current liabilities. Amazon needs more current asset, for example, money and receivables so as to pay its short-term loans when it due. Amazon is considered as ruined and can be sued for insolvency by loan bosses.
1.1153
1.0760
1.0448 1.0400
1.0981
1.0000 1.0200 1.0400 1.0600 1.0800 1.1000 1.1200 1.1400
2014 2015 2016 2017 2018
Rat
io
17
[image:19.595.106.452.76.291.2]4.2.3 Credit Risk
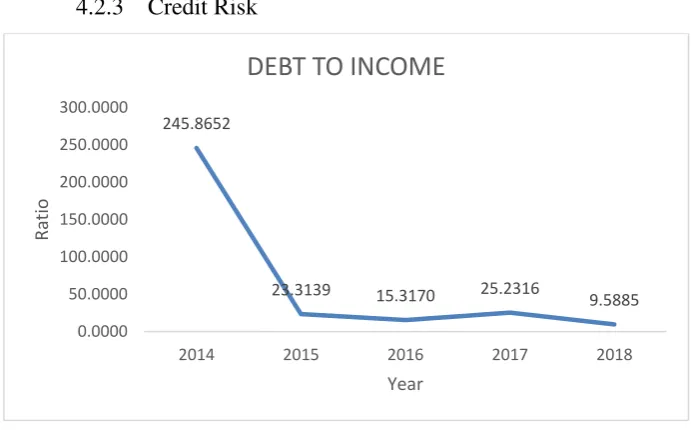
Figure 4.3 Debt to income
Debt to income measurement is used to identify whether Amazon will be able to pay the mortgage with their income by looking at the current income and current debt payments. The year 2014 shows the highest ratio of debt to income with 245.8652% followed by the year 2017 with 25.2316%. During the year 2014, Amazon holds a lots of debt and could not be able to cover a larger mortgage payment. However, its
decrease a lot from year 2014 to 2015 from 245.8652% to 23.3139% and the ratio continue to decrease and increase in a small amount in the following 4 years. During
2018, the debt to income ratio is the lowest between the five years with ratio of 9.5885% and shows a better result because the smaller the debt to income ratio, the higher the chance of Amazon be able to get line of credit.
245.8652
23.3139 15.3170 25.2316
9.5885 0.0000
50.0000 100.0000 150.0000 200.0000 250.0000 300.0000
2014 2015 2016 2017 2018
Rat
io
18
[image:20.595.109.471.100.333.2]4.2.4 Operational risk
Figure 4.4 Operational Ratio
Operational ratio is one of the financial ratio that used to test proficiency of the activity the board in an organization (Tulsian 2014). On the off chance that the operational risks are not appropriately overseen or controlled, severe risks may result and business disappointments may result. Operational chance is estimated by figuring the average operating rate for each organization for five back to back years (2014 to 2018). From the above figure 4.4, we can see that the most elevated operational proportion rate is in 2014, arriving at 0.9980%, which is higher than the other four years of turnover. This implies the majority of the organization's income is spent on operating costs. The high extent of offers conclude that the organization can't
efficiently deal with its activities. Simultaneously, the least operating rate in 2018 was 0.9467%, which was lower than the normal level which is 0.9737%. This shows the
organization is extremely proficient in overseeing tasks this year. The working proportions of year 2016 additionally are lower than normal, which implies that they have effectively dealt with their activities in recent year.
0.9980
0.9791
0.9692
0.9769
0.9467
0.9200 0.9300 0.9400 0.9500 0.9600 0.9700 0.9800 0.9900 1.0000 1.0100
2014 2015 2016 2017 2018
Rat
io
19
[image:21.595.108.470.81.308.2]4.2.5 Market Risk
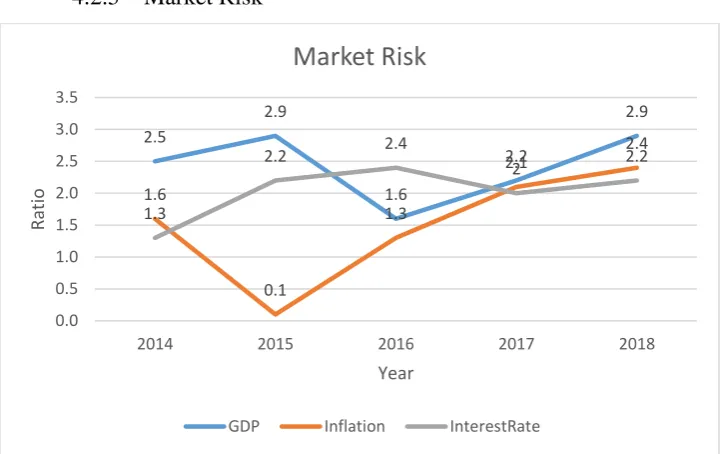
Figure 4.5 Market Risk
Market risk is characterized to probability of misfortune from adverse development of market price and it emerges from cost changing on the stock and mean. The every now and again of the price changing, the higher the volatility and it show organization is confronting higher market risk. Market risk can be ordered into interest rate risks, equity risks, exchange rate risks and commodity price risks (Ramos 2000). Market risk can't be wiped out through diversification. The adjustments in gross domestic product (GDP), inflation and interest rates are a portion of the determinants of market risk. The chart above shows the determinants of the development in the course of recent five years. Gross domestic product is utilized to measure the fiscal estimation of a nation's merchandise and ventures created inside a year. Malaysia's GDP has been increment in 2014 to 2015, decline from 2015 to 2016 and increment generally during the two years from 2016 to 2018. In 2015 and 2018, Malaysia's GDP was the
most elevated, at 2.9%. This shows in that year, the nation's economy was at its best. Higher total national output is favored in light of the fact that it shows that the financial circumstance in a nation is developing.
Inflation rates may show comparative upward and descending patterns. Inflation rise from 0.1% in 2015 to 2.4% in 2018. High inflation isn't useful for the nation since it decreases the value of the money except if the interest rate in that specific year is higher than the inflation rate. There has been little change in interest rate in recent five years. In 2014, the interest rate was 1.3%, and interest rate in 2015 and 2018 has a
2.5
2.9
1.6
2.2
2.9
1.6
0.1
1.3
2.1
2.4
1.3
2.2 2.4
2 2.2
0.0 0.5 1.0 1.5 2.0 2.5 3.0 3.5
2014 2015 2016 2017 2018
Rat
io
Year
Market Risk
20
similar proportion of 2%. Interest rate straightforwardly influence a nation's inflation rate and may lead organizations to give more securities to help their business growth.
4.2.6 Corporate Governance Index
2014 2015 2016 2017 2018
Accountability 1 1 1 1 1
Fairness 1 1 1 1 1
Transparency 1 1 1 1 1
Independence 0 0 0 0 0
Sustainability 1 1 1 1 1
Total 4/5 4/5 4/5 4/5 4/5
[image:22.595.109.478.164.342.2]Percentage (%) 80% 80% 80% 80% 80%
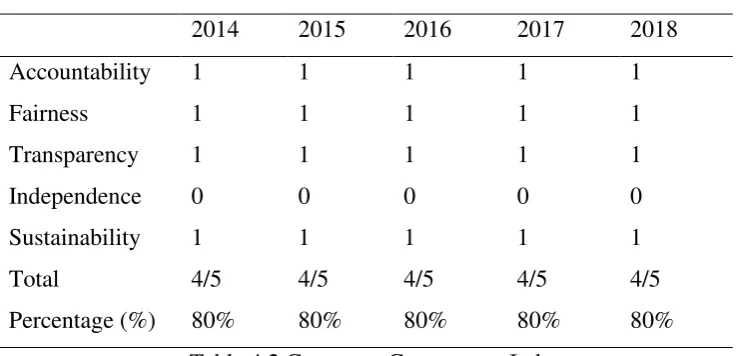
Table 4.2 Corporate Governance Index
Index Score is measure to decide the corporate governance list of the organization to decide the level of consistence of organizations dependent on the principles of corporate governance. One principle is anxiety with transparency in which all list scores are values depend on a yearly report that can be gotten transparently. In view
of this, it can show the Amazon willingness to uncover its organization data. To measure the index score, 5 principles were used as guideline to decide the effectiveness of corporate governance factor. The principles are accountability, fairness, transparency, independence and sustainability. Accountability is measure by looking at the board meeting while transparency by looking if Amazon have audit committee or not. Then, Independence are measures by the number of non-executive board in the company and if they have female on board in the company, they follow the principles of fairness. Lastly, sustainability is measure by looking if this company have done charity, corporate social responsibility (csr) or green technology program with community.
From of the figure above, the most high corporate index score was gotten by
21
the 5 principle to decide the viability of corporate governance and satisfied the principles of corporate governance.
4.3Data analysis
4.3.1 Coefficient Table
Coefficientsa
Model
Unstandardize d Coefficients
Standardiz
ed Coefficient
s
t Sig.
95.0% Confidence Interval for B
Collinearity Statistics
B
Std.
Error Beta
Lower Bound
Upper Bound
Toleran
ce VIF
1 (Constant) -.009 .007
-1.408
.254 -.030 .012
OPERATI NG MARGIN
1.398 .235 .960 5.938 .010 .649 2.147 1.000 1.000
[image:23.595.48.542.245.485.2]a. Dependent Variable: ROA
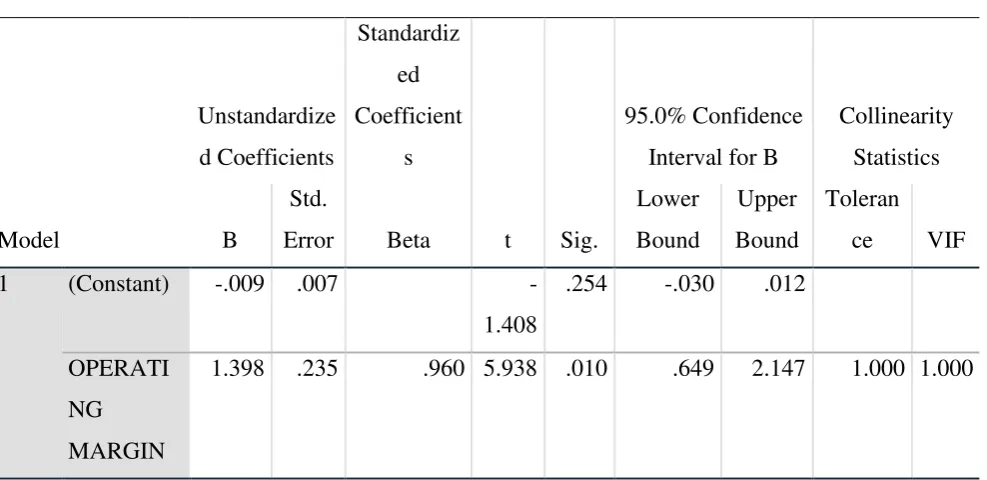
Table 4.3 Table of regression coefficient
Based on the table of regression coefficient in table 4.3 above, ROA is shown as dependent variable, there is one variable that relevant which is Operating Margin. P-value is used to the determine the significant between the dependent variable and independent variables. The p-value <0.001 has the most significant to the dependent variable and followed by p-value <0.05 which has moderate significant and p-value < 0.10 has the least significant. The operating margin is positive correlation and the moderate significant with the return of asset which the p-value < 0.05 and t = 5.938. It means that the changes in return of asset (ROA) will most influence the operating margin. Operating margin and return on asset give significant valuable of knowledge into the organization's profitability and proficiency The higher the operating margin,
the better, since it implies there's more cash left over for different things, for example,
22
4.3.2 Model Summary and Anova
Model Summaryb
Model R R Square
Adjusted R
Square
Std. Error of
the Estimate
Durbin-Watson
1 .960a .922 .895 .0082199527
10466
2.192
a. Predictors: (Constant), OPERATING MARGIN
b. Dependent Variable: ROA
ANOVAa
Model
Sum of
Squares df Mean Square F Sig.
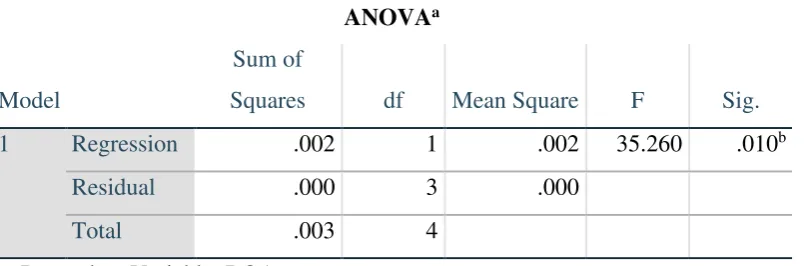
1 Regression .002 1 .002 35.260 .010b
Residual .000 3 .000
Total .003 4
a. Dependent Variable: ROA
[image:24.595.76.479.321.454.2]b. Predictors: (Constant), OPERATING MARGIN
23
Model Summaryc
Model R R Square
Adjusted R
Square
Std. Error of
the Estimate
Durbin-Watson
1 .922a .851 .801 .0113364371
53573
2 .996b .993 .986 .0030554231
31525
2.502
a. Predictors: (Constant), STDV
b. Predictors: (Constant), STDV, GDP
c. Dependent Variable: ROA
ANOVAa
Model
Sum of
Squares df Mean Square F Sig.
1 Regression .002 1 .002 17.115 .026b
Residual .000 3 .000
Total .003 4
2 Regression .003 2 .001 137.455 .007c
Residual .000 2 .000
Total .003 4
a. Dependent Variable: ROA
b. Predictors: (Constant), STDV
[image:25.595.73.439.77.220.2]c. Predictors: (Constant), STDV, GDP
24
Model Summaryc
Model R R Square
Adjusted R
Square
Std. Error of the
Estimate
Durbin-Watson
1 .960a .922 .895 .0082199527104
66
2 .997b .994 .987 .0028536878206
32
2.554
a. Predictors: (Constant), OPERATING MARGIN
b. Predictors: (Constant), OPERATING MARGIN , Inflation
c. Dependent Variable: ROA
ANOVAa
Model
Sum of
Squares df Mean Square F Sig.
1 Regression .002 1 .002 35.260 .010b
Residual .000 3 .000
Total .003 4
2 Regression .003 2 .001 157.723 .006c
Residual .000 2 .000
Total .003 4
a. Dependent Variable: ROA
b. Predictors: (Constant), OPERATING MARGIN
[image:26.595.74.439.79.219.2]c. Predictors: (Constant), OPERATING MARGIN , Inflation
Table 4.7 Model Summary and Anova for model 3
25
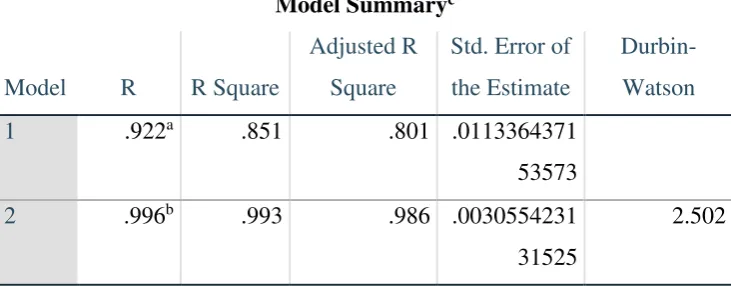
macroeconomic factors in Equation 3, return on asset (ROA), average collection period (ACP), operational ratio (OPR), and Standard Deviation show, the model is utilized to clarify the adjustments in Amazon organization return of asset is 99.4% for the five years. For the most part, the bigger the R square, the better the regression
model accommodates your perceptions. The model summary on Model 1 is the outcome taken from the organization specific factors as an independent variable which is the R square is 92.2%. The model outline on Model 2 is the outcome taken from the organization macroeconomic factors just as an independent variable which is the R square is 99.3% Based on the R square qualities acquired from Model 1, Model 2 and Model 3, it tends to be seen that the organization internal factors and
26
5.0CONCLUSION AND RECOMMENDATION
5.1Conclusion
Objective of this study is to identify the effect of return on asset on the corporate governance, financial performances, and macroeconomics factors in Amazon. As the result, operating margin is the most influenced with the dependent variable which is will affect the company profit. For the whole result, operational ratio are significant to return on asset (ROA). However, there were some variables that have negative relationship to the return on asset such as interest rate, when interest increase, the return on asset of the company will decrease.
5.2 Recommendation
This study attempts the determinants of the return of asset on the corporate
governance of Amazon. However, the sample size is quite limited and insufficient to gain the accuracy of the final result since only five years are being use. Therefore, future researcher are advised to enlarge the term of study to know more and detail about the company.
27
References
Abdullah, N. S. (april 2018). Corporate Governance and Performance of Hotel Industry (Ihi). Munich Personal RePEc Archive.
Braakmann, N. a. (february 2016). The Efficacy of Hybrid Collective Bargaining Systems: An Analysis of the Impact of Collective Bargaining on Company Performance in Europe. Munich Personal RePEc Archive.
Cipriano, N. A. (2018). Operational risk and its determinants among five companies in manufacturing industry in Germany. Munich Personal RePEc Archive.
Grover, N. a. (2019). Determinants, Persistence and value implications of liquidity creation: An evidence from Indian Banks. Munich Personal RePEc Archive, 1.
Janda, K. a. (2016). Credit risk modelling: default probabilities for Portuguese municipalities. Munich Personal RePEc Archive.
Javed, A. Y. (2007). Relationship between Corporate Governance Indicators and Firm Value: A Case Study of Karachi Stock Exchange. Munich Personal RePEc Archive, 1.
Malo, M. a. (2019). Do old and new labour market risks overlap? Automation, offshorability, and non-standard employment. Munich Personal RePEc Archive, 2.
Mehmood, M. S. (2017). Empirical Examination for Operational and Credit Risk Perspective – A Case of Commercial Banks of Pakistan. Munich Personal RePEc Archive, 2.
Mohammad Azmi, N. S. (2018). The Factors Influence Credit Risk in Japan Banking Sector Specific for Kyoto bank. Munich Personal RePEc Archive.
Ojo, M. (2009). The role of external auditors in corporate governance agency problems and the management of risk. Munich Personal RePEc Archive, 2.
OTENG-ABAYIE, E. F. (December 2018). Corporate Governance and Efficiency of Rural and Community Banks (RCBs) in Ghana. Munich Personal RePEc Archive, 94.
Privantu, D. M. (19 december 2018). Conceptual Approaches to Public Governance. Corporate Governance vs.Public Governance. Munich Personal RePEc Archive, 205.
Sinha, P. a. (2019). Estimation of liquidity created by banks in India. Archive, Munich Personal RePEc.
Sinha, P. a. (2019). Estimation of liquidity created by banks in India. Munich Personal RePEc Archive.
Syazwani, A. (2019). Tobin’s Q and Its Determinants: A Study of Market Valuation in MISC Berhad.
Munich Personal RePEc Archive.
Szybisz, M. A. (2019). Interactions between Credit and Market Risk, Diversification vs Compounding effects. Munich Personal RePEc Archive.
Teo, S. W. (april 2017). Telekom Malaysia Berhad (TM): Study of Relationship Between Performance (ROA) and Internal, External Factor. Munich Personal RePEc Archive.
28 APPENDIX Correlations R O A CUR RENT RATI O QU ICK RA TIO AVERA GE-COLLE CTION PERIO D DEB T TO INC OM E OPERAT IONAL RATIO OPER ATING MARGI N G D P Infla tion Interes tRate Exchan geRate ST D V Cg i Pears on Correl ation
ROA 1.
00
0
-.063 .52
6
.613
-.542
-.929 .960 .0
27 .70
1
.494 . .9
22 . CURRE NT RATIO -.0 63
1.000 .79
8
-.161 .663 .157 -.180 .6
61 .07
3
-.634 . .2
40 . QUICK RATIO .5 26
.798 1.0
00
.159 .306 -.373 .385 .4
38 .49
5
-.270 . .6
93 . AVERA GE-COLLEC TION PERIOD .6 13
-.161 .15
9
1.000
-.262
-.442 .488 .1
20 .83
1
.010 . .5
56 . DEBT TO INCOME -.5 42
.663 .30
6
-.262 1.00
0
.761 -.731 .0
78 .03
5
-.953 .
-.4 32 . OPERAT IONAL RATIO -.9 29
.157
-.37
3
-.442 .761 1.000 -.994
-.1
35
-.40
3
-.730 .
-.8 96 . OPERAT ING MARGIN .9 60
-.180 .38
5
.488
-.731
-.994 1.000 .0
57 .48
6
.701 . .8
95 .
GDP .0
27
.661 .43
8
.120 .078 -.135 .057 1.
00
0
-.10
3
-.206 . .4
03 .
Inflation .7
01
.073 .49
5
.831 .035 -.403 .486
-.1
03 1.0
00
-.164 . .5
88 . InterestR ate .4 94
-.634
-.27
0
.010
-.953
-.730 .701
-.2
06
-.16
4
1.000 . .3
60 .
Exchang
eRate
29
STDV .9
22
.240 .69
3
.556
-.432
-.896 .895 .4
03 .58
8
.360 . 1.
00
0 .
Cgi . . . 1.
00
0
Sig.
(1-tailed)
ROA . .460 .18
2
.136 .172 .011 .005 .4
83 .09
4
.199 .000 .0
13 .0 00 CURRE NT RATIO .4 60
. .05
3
.398 .111 .401 .386 .1
12 .45
4
.126 .000 .3
49 .0 00 QUICK RATIO .1 82
.053 . .399 .309 .268 .261 .2
30 .19
8
.330 .000 .0
97 .0 00 AVERA GE-COLLEC TION PERIOD .1 36
.398 .39
9
. .335 .228 .202 .4
24 .04
0
.494 .000 .1
65 .0 00 DEBT TO INCOME .1 72
.111 .30
9
.335 . .068 .080 .4
50 .47
8
.006 .000 .2
34 .0 00 OPERAT IONAL RATIO .0 11
.401 .26
8
.228 .068 . .000 .4
14 .25
1
.081 .000 .0
20 .0 00 OPERAT ING MARGIN .0 05
.386 .26
1
.202 .080 .000 . .4
64 .20
3
.094 .000 .0
20 .0
00
GDP .4
83
.112 .23
0
.424 .450 .414 .464 . .43
5
.370 .000 .2
51 .0
00
Inflation .0
94
.454 .19
8
.040 .478 .251 .203 .4
35
. .396 .000 .1
48 .0 00 InterestR ate .1 99
.126 .33
0
.494 .006 .081 .094 .3
70 .39
6
. .000 .2
76 .0 00 Exchang eRate .0 00
.000 .00
0
.000 .000 .000 .000 .0
00 .00
0
.000 . .0
00 .0
00
STDV .0
13
.349 .09
7
.165 .234 .020 .020 .2
51 .14
8
.276 .000 . .0
00
Cgi .0
00
.000 .00
0
.000 .000 .000 .000 .0
00 .00
0
.000 .000 .0
00 .
30
CURRE
NT
RATIO
5 5 5 5 5 5 5 5 5 5 5 5 5
QUICK
RATIO
5 5 5 5 5 5 5 5 5 5 5 5 5
AVERA
GE-COLLEC
TION
PERIOD
5 5 5 5 5 5 5 5 5 5 5 5 5
DEBT
TO
INCOME
5 5 5 5 5 5 5 5 5 5 5 5 5
OPERAT
IONAL
RATIO
5 5 5 5 5 5 5 5 5 5 5 5 5
OPERAT
ING
MARGIN
5 5 5 5 5 5 5 5 5 5 5 5 5
GDP 5 5 5 5 5 5 5 5 5 5 5 5 5
Inflation 5 5 5 5 5 5 5 5 5 5 5 5 5
InterestR
ate
5 5 5 5 5 5 5 5 5 5 5 5 5
Exchang
eRate
5 5 5 5 5 5 5 5 5 5 5 5 5
STDV 5 5 5 5 5 5 5 5 5 5 5 5 5