GATA4 loss of function in liver cancer impedes
precursor to hepatocyte transition
Francis O. Enane, … , Han Chong Toh, Yogen
Saunthararajah
J Clin Invest.
2017;127(9):3527-3542. https://doi.org/10.1172/JCI93488.
The most frequent chromosomal structural loss in hepatocellular carcinoma (HCC) is of the
short arm of chromosome 8 (8p). Genes on the remaining homologous chromosome,
however, are not recurrently mutated, and the identity of key 8p tumor-suppressor genes
(TSG) is unknown. In this work, analysis of minimal commonly deleted 8p segments to
identify candidate TSG implicated
GATA4
, a master transcription factor driver of hepatocyte
epithelial lineage fate. In a murine model, liver-conditional deletion of 1
Gata4
allele to
model the haploinsufficiency seen in HCC produced enlarged livers with a gene expression
profile of persistent precursor proliferation and failed hepatocyte epithelial differentiation.
HCC mimicked this gene expression profile, even in cases that were morphologically
classified as well differentiated. HCC with intact chromosome 8p also featured GATA4 loss
of function via
GATA4
germline mutations that abrogated GATA4 interactions with a
coactivator, MED12, or by inactivating mutations directly in GATA4 coactivators, including
ARID1A
. GATA4 reintroduction into
GATA4
-haploinsufficient HCC cells or ARID1A
reintroduction into
ARID1A
-mutant/
GATA4
-intact HCC cells activated hundreds of
hepatocyte genes and quenched the proliferative precursor program. Thus, disruption of
GATA4-mediated transactivation in HCC suppresses hepatocyte epithelial differentiation to
sustain replicative precursor phenotype.
Research Article
Genetics
Oncology
Find the latest version:
Introduction
Hepatocellular carcinoma (HCC) is the world’s second leading cause of cancer death. In the effort to understand the molecu-lar mechanisms of HCC genesis, a relevant lead is that the most recurrent chromosomal structural loss in HCC is of chromosome 8 (8p), occurring in more than 60% of cases (1, 2). The frequency of this event suggests loss of one or more 8p genes is central to trans-formation. Of the approximately 500 genes on chromosome 8p, however, none are mutated at a high rate — presumably, complete loss of function by mutation of the remaining alleles might be del-eterious, and haploinsufficiency of specific 8p genes is enough to contribute to transformation. The lack of mutations, howev-er, complicates the task of identifying the key tumor-suppressor genes (TSGs) and pathways disrupted by 8p deletion, and the identity of this gene or genes is unknown. One clue is that occa-sionally, instead of the usual deletion of the entire chromosome 8p, there are smaller deletions targeting the segment from 8p22 to 8p23 (minimal commonly deleted regions), removing tens instead of hundreds of genes (3).
There have been attempts at functional interrogation of this more limited catalog of genes. In one study, FGL1 (also known as LFIRE or HFREP-1), which encodes for a fibrinogen (blood coagulation) family protein, was identified as a candidate 8p TSG because of its location at 8p22 and its lower expression in HCC versus adjacent noncancerous liver and because its further knock-down in HCC cells by antisense oligonucleotides increased prolif-eration, while its exogenous introduction had the opposite effect (4). Fgl1-knockout mice, however, have no liver phenotype (5). In other studies, DLC1 on chromosome 8p22, which encodes for a GTPase-activating protein, was implicated as a TSG based on a range of observations similar to those generated for FGL1 (6, 7). Again though, Dlc1-haploinsufficient mice have no overt pheno-type, liver or otherwise, and the complete knockout is embryonic lethal, with neural tube and cardiac but not liver defects (8). Thus, neither Fgl1 nor Dlc1 have been found to have a usual central role in liver cell fate determination to warrant the frequency of haplo-insufficiency observed in HCC.
The epidemiologic link between HCC and inflammatory insults such as viruses suggests participation in transformation of pathways regulating liver regeneration. In several organ systems, a hierarchy of quiescent stem cells, then highly proliferative com-mitted precursors (transit amplifying cells), then nonproliferating specialized mature cells, is well chronicled as mediating tissue homeostasis. At one point, the liver was thought to contrast with these other organs in that mature epithelial cells (hepatocytes The most frequent chromosomal structural loss in hepatocellular carcinoma (HCC) is of the short arm of chromosome 8
(8p). Genes on the remaining homologous chromosome, however, are not recurrently mutated, and the identity of key 8p tumor-suppressor genes (TSG) is unknown. In this work, analysis of minimal commonly deleted 8p segments to identify candidate TSG implicated GATA4, a master transcription factor driver of hepatocyte epithelial lineage fate. In a murine model, liver-conditional deletion of 1 Gata4 allele to model the haploinsufficiency seen in HCC produced enlarged livers with a gene expression profile of persistent precursor proliferation and failed hepatocyte epithelial differentiation. HCC mimicked this gene expression profile, even in cases that were morphologically classified as well differentiated. HCC with intact chromosome 8p also featured GATA4 loss of function via GATA4 germline mutations that abrogated GATA4 interactions with a coactivator, MED12, or by inactivating mutations directly in GATA4 coactivators, including ARID1A. GATA4 reintroduction into GATA4 -haploinsufficient HCC cells or ARID1A reintroduction into ARID1A-mutant/GATA4-intact HCC cells activated hundreds of hepatocyte genes and quenched the proliferative precursor program. Thus, disruption of GATA4-mediated transactivation in HCC suppresses hepatocyte epithelial differentiation to sustain replicative precursor phenotype.
GATA4 loss of function in liver cancer impedes
precursor to hepatocyte transition
Francis O. Enane,1 Wai Ho Shuen,2 Xiaorong Gu,1 Ebrahem Quteba,1 Bartlomiej Przychodzen,1 Hideki Makishima,1 Juraj Bodo,1
Joanna Ng,2 Chit Lai Chee,2 Rebecca Ba,2 Lip Seng Koh,2 Janice Lim,2 Rachael Cheong,2 Marissa Teo,2 Zhenbo Hu,1 Kwok Peng Ng,1
Jaroslaw Maciejewski,1 Tomas Radivoyevitch,3 Alexander Chung,4 London Lucien Ooi,4 Yu Meng Tan,4 Peng-Chung Cheow,4
Pierce Chow,4 Chung Yip Chan,4 Kiat Hon Lim,5 Lisa Yerian,6 Eric Hsi,6 Han Chong Toh,2 and Yogen Saunthararajah1
1Translational Hematology and Oncology Research, Taussig Cancer Institute, Cleveland Clinic, Cleveland, Ohio, USA. 2Division of Medical Oncology, National Cancer Centre Singapore, Singapore. 3Department of Quantitative Health Sciences, Cleveland Clinic, Cleveland, Ohio, USA. 4Department of Hepato-pancreato-biliary and Transplant Surgery and 5Department of Pathology,
Singapore General Hospital, Singapore. 6Clinical Pathology, Pathology Institute, Cleveland Clinic, Cleveland, Ohio, USA.
Authorship note: F.O. Enane and W.H. Shuen contributed equally to this work. H.C. Toh and Y. Saunthararajah contributed equally to this work.
Conflict of interest: The authors have declared that no conflict of interest exists.
Submitted: February 20, 2017; Accepted: June 8, 2017.
The Journal of Clinical Investigation
R E S E A R C H A R T I C L E
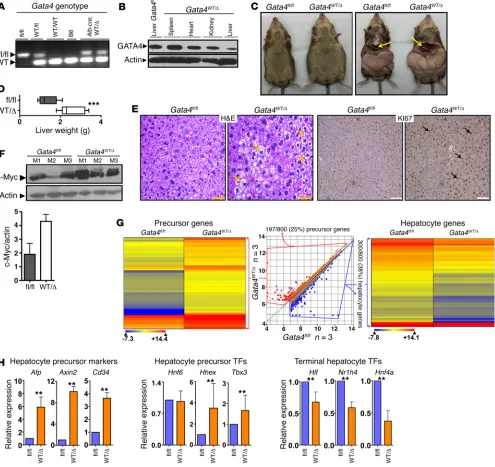
conditional deletion of a single Gata4 allele (Gata4WT/Δ) (Figure
2A). Compared with Gata4fl/fl mice, Gata4WT/Δ mice demonstrated
substantially decreased GATA4 protein levels only in the liver (Fig-ure 2B). At formal phenotyping at 3 and 8 months, the Gata4WT/Δ
mice (n = 11) had strikingly enlarged livers on a normal diet (Figure 2, C and D, and Supplemental Figure 2). Markers of proliferation Ki67 and MYC, measured by immunohistochemistry and Western blot, were substantially increased in Gata4WT/Δ (Gata4
haploin-sufficient) versus Gata4fl/fl (Gata4 WT) livers (Figure 2, E and F, and Supplemental Figure 2).
RNA-sequencing was used to compare the gene expression profiles of Gata4-haploinsufficient versus WT livers. Of genes more highly expressed in Gata4-haploinsufficient livers, 25% (197 of 800) were associated with a precursor stage of liver devel-opment (Figure 2G and Supplemental Table 1) (23). Of genes less expressed in Gata4-haploinsufficient livers, more than a third (300 of 800, 38%) were late liver development specialized hepatocyte epithelial function genes, such as lipid metabolism genes, coagulation pathway genes, and genes that antagonize MYC to terminate proliferation (24–26). Key hepatocyte precursor marker genes Afp, Axin2, and Cd34 were also measured by quanti-tative real-time PCR (QRT-PCR), affirming their enrichment with Gata4 haploinsufficiency (Figure 2H).
To better understand the level of the differentiation continu-um at which hepatocyte maturation was impeded by Gata4 haplo-insufficiency, we also used QRT-PCR to measure expression levels of key transcription factor drivers that operate at early versus late stages of hepatocyte epithelial differentiation, identified by others during hepatocyte generation in vitro and in liver development; expression levels of commitment and early hepatocyte differen-tiation–driving transcription factors Hnf6, Hhex, and Tbx3 were preserved while those of late-differentiation driving transcription factors Hnf4a, Hlf, and Nr1h4 were significantly suppressed with Gata4 haploinsufficiency (Figure 2H) (17–19, 27–29). GATA4 is a “pioneer” transcription factor, known to initiate remodeling of compacted chromatin for subsequent gene activation (30). We therefore asked whether baseline differences in the chromatin state could explain preserved/high expression of transcription fac-tor genes Hnf6, Hhex, and Tbx3, but repression of Hnf4a, Hlf, and Nr1h4. Epigenetic marks at these genes were therefore examined at the ultimate baseline, embryonic stem cells (ESCs). Hnf6, Hhex, and Tbx3 had open chromatin in ESCs, that is, low DNA CpG meth-ylation and high histone 3 lysine 4 trimethmeth-ylation (H3K4me3) lev-els (Supplemental Figure 3). In contrast, suppressed late-differen-tiation transcription factor genes Hnf4a, Hlf, and Nr1h4 had closed or compacted chromatin at this same baseline, with high CpG methylation and low H3K4me3 levels (Supplemental Figure 3).
Hundreds of hepatocyte epithelial-differentiation genes are also suppressed and precursor genes increased in HCC compared with nor-mal liver. Gene expression of adjacent noncancerous liver tissue and HCC was then compared by microarray (n = 46 pairs). Approx-imately 2,486 genes were less expressed (average expression at least 1.5-fold higher in nonmalignant liver) in HCC (n = 46) than in nonmalignant liver (n = 46) (Figure 3A). The top tissue expres-sion association of these suppressed genes was in liver genes, that is, approximately 25% of these genes (600 of 2,486) were special-ized hepatocyte genes, such as members of the cytochrome p450 and cholangiocytes) might respond to mitotic triggers to
medi-ate regeneration/homeostasis (9). Recent detailed molecular and cellular examination, however, has shown that a cellular hierar-chy is present in the liver. Despite difficulties in separating liver cells by morphologic appearance, a cellular subset displays high expression of early hepatocyte differentiation-driving transcrip-tion factors Tbx3, Foxa2, and Sox9, low expression of hepatocyte epithelial-differentiation genes, a diploid genome, and replicative potential; it also mediates liver homeostasis by differentiating into cells with a typical hepatocyte epithelial-differentiation gene expression profile and polyploid genome (9–12). Several groups have found that HCC phenocopies this subset of liver precursor cells (10, 13–19). How this happens, however, is unknown. Here, we show that haploinsufficiency of a master transcription factor driver of hepatocyte differentiation, GATA4, located on chromo-some 8p, and genetic alterations that compromise the transacti-vating function of GATA4 are a cause of HCC precursor pheno-type. Interestingly, another highly recurrent structural deletion in HCC, that of chromosome 17p, also centers on a gene for a master transcription factor, TP53, the master regulator of apoptosis. Thus, the master regulatory circuits for 2 major MYC-antagonizing, pro-liferation-terminating metazoan programs, epithelial differentia-tion and apoptosis, are genetically disrupted in HCC.
Results
Candidate 8p TSGs. Chromosome 8p was frequently deleted in our HCC series from Singapore (24 of 55, 44% of cases). Deletion of 8p is also the most frequent structural deletion identified by SNP array karyotyping in the large TCGA series of patients with HCC in the USA (245 of 360, 68%) (Figure 1A). One patient in the Singa-pore series had a smaller deleted 8p segment that contained only 14 genes (Figure 1B). Of these 14 genes, only GATA4 (master tran-scription factor driver of hepatocyte differentiation) and NEIL2 (1 of 4 DNA glycosylases) had gene expression characteristics expected of candidate TSGs — lower expression in HCC with 8p deletion than without and in HCC versus normal liver (Figure 1B). Karyotyping of 26 HCC cell lines identified several minimal com-monly deleted chromosome 8p segments that again centered close to GATA4 (Figure 1C) (Cancer Cell Line Encyclopedia [CCLE], https://portals.broadinstitute.org/ccle/home). In multiple public-ly available gene expression databases, GATA4 was consistentpublic-ly less expressed in HCC versus normal liver and in HCC with 8p deletion than without, and a strong correlation (Spearman’s cor-relation, R = 0.5382, P < 0.0001, n = 361) was observed between GATA4 copy number and GATA4 expression (Figure 1D and Sup-plemental Figure 1; supSup-plemental material available online with this article; https://doi.org/10.1172/JCI93488DS1).
Figure 1. GATA4 is a candidate TSG on chromosome 8p. (A) Chromosome gains and losses in HCC. HCC (n = 55 Singapore series, n = 330 TCGA series) karyotyped by SNP array. Blue plot, frequency of loss by chromosome location; red plot, frequency of gain. (B) Of the 14 genes in the smallest minimal deleted region observed in a patient with HCC, only 2 were less expressed in HCC with 8p deletion (del) than without (WT) and less expressed in HCC than in normal liver (N). Gene expression by microarray. Wilcoxon rank sum test, 2-tailed. (C) Chromosome 8 (chr8) copy number loss peaked in proximity to
GATA4,while copy number gain peaked in proximity to MYC in multiple HCC cell lines (n = 27). Representative images for JHH2, JHH4, JHH5, and SNU475
The Journal of Clinical Investigation
R E S E A R C H A R T I C L E
(American Joint Committee on Cancer histologic grade 1; ref. 31.) (Supplemental Figure 4). As in murine conditional liver Gata4 hap-loinsufficiency, the problem seemed to be with late-stage matura-tion, since expression of transcription factors that drive hepatocyte commitment and early differentiation (HNF6, HHEX, HNF1A) was family and lipid metabolism genes (Figure 3A and Supplemental
Table 2) (P < 1 × 10–16, Benjamini corrected, DAVID gene
[image:5.585.44.539.62.529.2]ontolo-gy analysis; https://david.ncifcrf.gov/). This pattern of suppres-sion of hundreds of specialized hepatocyte genes was seen even in HCCs that appeared to be well differentiated by light microscopy
Figure 2. Liver-conditional Gata4 haploinsufficiency (Gata4WT/Δ) produced enlarged livers with a proliferative precursor phenotype. (A) Genotyping
for floxed Gata4 allele in Gata4fl/fl, Alb-cre, progeny of the cross (Gata4WT/Δ), and controls. DNA isolated from tails. PCR analysis (primers in Supplemental
Table 6). (B) GATA4 protein reduction in liver, but not other tissues, in Gata4WT/Δ compared with Gata4fl/fl mice. Western blot. (C) Markedly enlarged livers in
Gata4WT/Δ versus Gata4fl/fl mice. Arrows indicate liver (n = 11 Gata4WT/Δ mice generated with similar phenotype). (D) Liver weights in Gata4WT/Δ versus Gata4fl/fl
mice. ***P < 0.001, Wilcoxon rank sum test, 2-tailed. n = 11 each group. Sacrifice at 8 months. (E) Liver histopathology in Gata4WT/Δ versus Gata4fl/fl mice.
Proliferation evaluated by immunohistochemistry for KI67. Arrows indicate fatty changes in H&E stain and positive KI67. Magnification: ×200 (H&E), ×100 (KI67).(F) MYC protein levels were increased in Gata4WT/Δ versus Gata4fl/fl livers. Western blot. Bar graph shows densitometric analysis. (G) Gene ontology
analysis of genes 1.5-fold more or less expressed in Gata4WT/Δ versus Gata4fl/fl liver showed increased expression of liver precursor genes, but decreased
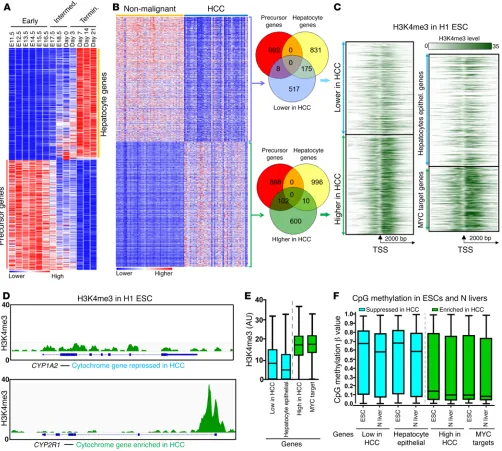
baseline in ESCs, with low CpG methylation and high H3K4me3 levels, while in contrast, genes less expressed in HCC, including hundreds of known hepatocyte epithelial-differentiation genes, begin at this same baseline with closed chromatin characterized by high CpG methylation and low H3K4me3 levels (Figure 4, C–F).
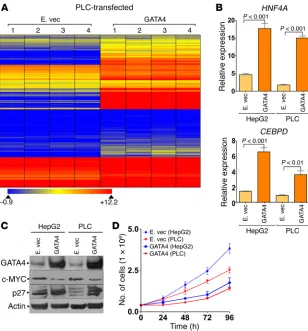
A cause-effect role for GATA4 in the regulation of these sup-pressed hepatocyte genes was demonstrated by their upregulation upon exogenous correction of GATA4 levels in the HCC cell line PLC, which contains an 8p deletion (Figure 5A and Supplemental Figure 6); GATA4 markedly increased expression of 329 of 600 (55%) of the hepatocyte genes suppressed in HCC (Figure 5A). Of particular interest are hepatocyte genes that antagonize MYC func-tion to terminate proliferafunc-tion; the hepatocyte factors HNF4A and CEBPD have been shown to have such actions (17–19, 27–29). GATA4 introduction activated both HNF4A and CEBPD quantified by QRT-PCR (Figure 5B). As expected, this was accompanied by downregu-lation of the MYC protein, upregudownregu-lation of the p27/CDKN1B protein (p27/CDKN1B is the cyclin-dependent kinase inhibitor that medi-ates cell-cycle exits by differentiation — Cdkn1b knockout mice have >20% increase in liver mass; refs. 32–34) (Figure 5C), and decreased cell growth without early apoptosis (Figure 5D).
preserved, but that of late-differentiation driving transcription fac-tors (CEBPD, HLF, NR1H4, NR2F1) was suppressed (Supplemental Figure 5). More than 400 genes suppressed in HCC versus noncan-cerous livers were also suppressed in Gata4-haploinsufficient ver-sus WT livers (Figure 3B). Specialized hepatocyte epithelial genes constituted a large fraction of these genes commonly suppressed in both HCC and Gata4-haploinsufficient livers (Figure 3C).
[image:6.585.51.542.55.407.2]To complement the above analyses, genes differentially expressed between nonmalignant livers and HCC were identified also by another method, unsupervised hierarchical clustering. Of genes with significantly higher gene expression in HCC versus normal liver (false discovery rate [FDR] < 0.01), 90 of 700 (13%) were liver precursor genes (significantly linked with early stages of liver development) while only 10 of 700 (~1%) were terminal- differentiation genes. In contrast, of genes significantly less expressed in HCC versus normal liver, only 8 of 700 (~1%) were precursor genes, while 175 of 700 (25%) were terminal-differenti-ation genes (Figure 4, A and B, and Supplemental Table 3). Also, as observed earlier for Gata4-haploinsufficient livers (Supplemental Figure 3), genes highly expressed in HCC, including proliferation genes (MYC target genes), have open or “poised” chromatin at
Figure 3. Similar precursor gene enrichment and hepatocyte gene suppression in HCC and Gata4-haploinsufficient livers. (A) Gene ontology analysis of genes 1.5-fold more or less expressed in HCC (n = 46) versus adjacent noncancerous liver (n = 46). DAVID gene ontology analysis complemented by hepatocyte differentiation-stage–specific expression as per Supplemental Table 1. (B) Overlap in genes more or less expressed in HCC versus noncancerous and in Gata4WT/Δ (haploinsufficient) versus Gata4fl/fl (WT) livers. (C) Examples of specialized hepatocyte epithelial-differentiation genes that are similarly
The Journal of Clinical Investigation
R E S E A R C H A R T I C L E
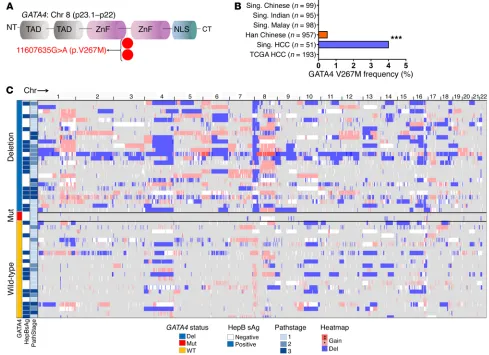
Atypical HCC containing a rare germline GATA4 loss-of-function mutation. To evaluate whether GATA4 is also inactivated by muta-tion in HCC, we sequenced all GATA4-coding regions from HCC and paired noncancerous liver. Remarkably, we found an identical germline GATA4 missense mutation (GATA4 V267M) in 2 cases of HCC without 8p deletion (frequency 2 of 51, 4%; DNA from
peripheral blood mononuclear cells was sequenced to evaluate the germline) (Figure 6A and Supplemental Figure 7). The ami-no acid altered by this recurrent mutation was highly conserved across species (Supplemental Figure 7G). Although this mutation has not been noted in the sequencing of the general population of Singapore, it has been noted as a rare, exclusively
[image:7.585.42.544.56.507.2]gous germline variant in ethnic Han Chinese in China (4 of 957, 0.4%, rs116781972), where it has been linked with congenital heart defects (Figure 6B) (35–37). Both HCC cases with the muta-tion were atypical compared with other HCC patients; both were female, even though HCC rates are 4 times higher in males than females (38), neither patient had hepatitis B or C or cirrhosis or other HCC risk factors, and neither HCC contained frequent chro-mosomal structural gains or deletions by SNP array karyotyping, contrasting with most other HCCs in the series (Figure 6C). The mutation affected only 1 GATA4 allele (variant allele frequency, ~50%) (Supplemental Figure 7 and Supplemental Table 4).
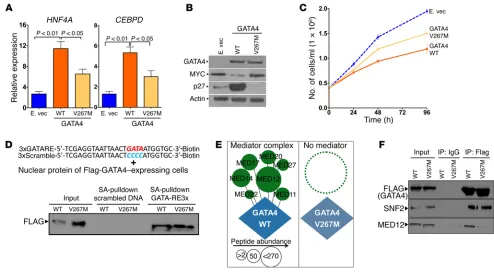
Unlike gene deletion, missense alteration is not unmistak-ably a loss-of-function event. When we used expression vectors to express similar amounts of WT GATA4 or GATA4 V267M protein in GATA4-haploinsufficient HCC cells (PLC), however, GATA4 V267M was less able than GATA4 to activate HNF4A and CEBPD, downregulate MYC, upregulate p27/CDKN1B, or slow HCC cell growth (Figure 7, A–C). We therefore looked for bio-chemical reasons for decreased transactivating function of GATA4 V267M. Decreased DNA binding was not the explana-tion, since GATA4 V267M bound GATA-response elements with affinity equal to that of WT GATA4 in DNA-binding assays (Fig-ure 7D). Nor was GATA4 V267M mislocalized to the cytoplasm instead of the nucleus by Western blot of cell fractions (Supple-mental Figure 8). Amino acid 267 is located between the zinc fin-ger DNA-binding domains of GATA4, a region thought to mediate protein-protein interactions. Thus, we comprehensively ana-lyzed the GATA4 V267M and WT GATA4 protein interactomes
by immunoprecipitation followed by liquid chromatography tandem mass spectrometry (LC-MS/MS). The unbiased protein interactome analysis revealed a striking absence of the mediator complex from the GATA4 V267M versus the WT GATA4 protein interactomes (Figure 7E, Supplemental Figure 9–11, and Supple-mental Table 5). This finding was confirmed also by immunopre-cipitation–Western blot for mediator 12 (MED12), performed in triplicate (Figure 7F and Supplemental Figure 11).
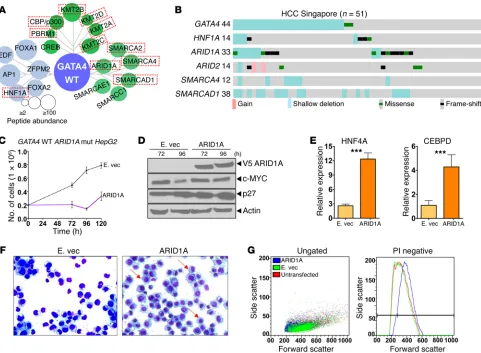
[image:8.585.44.352.55.386.2]Major coactivators for GATA4 are recurrently inactivated in HCC. GATA4 V267M loss of interactions with mediator complex suggested that direct inactivation of key coactivators that mediate transcription activation by GATA4 could be another mechanism by which GATA4 function is impaired in HCC. Coactivators for GATA4 were identified by LC-MS/MS analysis of the GATA4 pro-tein interactome (Figure 8A and Supplemental Table 5). Several of the identified coactivators were recurrently inactivated at a high rate in HCC (~40% of cases), observed in both the Singapore and TCGA series, with the highest inactivating mutation rate observed for AT-rich interactive domain 1A (ARID1A) (Figure 8B and Sup-plemental Figure 12). HNF1A, a differentiation-driving transcrip-tion factor found in the GATA4 protein interactome, was also fre-quently mutated in both the Singapore and TCGA series (Figure 8, A and B, Supplemental Figure 12, and Supplemental Table 5). Con-sistent with the idea that coactivator inactivation will negatively affect GATA4-mediated gene activation, there was similar sup-pression of key late-differentiation factors downstream of GATA4 in both GATA4-haploinsufficient and ARID1A/SMARCAD1/ ARID2/SMARCA4-deficient HCC; this suppression was greater
The Journal of Clinical Investigation
R E S E A R C H A R T I C L E
HCC cases were hepatitis B sAg positive). In contrast, approxi-mately 25% of HCC in the TCGA series from the USA contained CTNNB1 mutations (Supplemental Figure 14). There was no significant difference, however, in the rate of GATA4 deletion, ARID1A mutation or deletion, or TP53 mutation or deletion in the Singapore versus TCGA series.
Discussion
The liver replenishes hepatocytes consumed by metabolic work and insults such as viruses routinely and in controlled fashion. One control on this tissue homeostasis is WNT-CTNNB1 signal-ing, which initiates tissue precursor proliferation (10), and muta-tions that constitutively activate CTNNB1 are frequent in HCC in Europe and North America (20%–40% of cases). CTNNB1 mutations are less frequent in Asia and in patients with hepatitis B–associated HCC (39–44), possibly because hepatitis B viral X protein directly increases WNT/CTNNB1 signaling (45, 46). Oth-er homeostatic controls tOth-erminate precursor prolifOth-eration once it is initiated; advancing differentiation (transition to specialized lineage fate) routinely terminates exponential proliferation of pre-than that observed in HCC without these alterations in both the
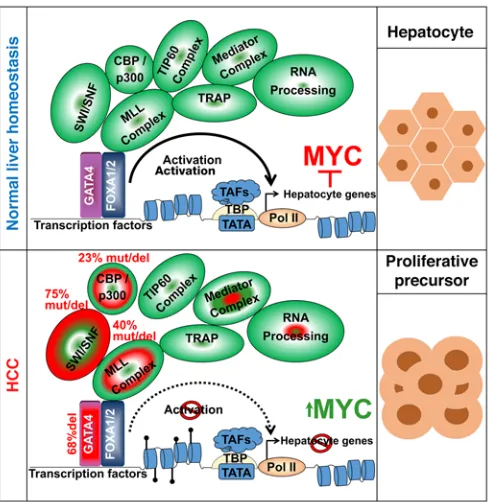
Singapore and TCGA series (Supplemental Figure 13). Reintro-duction of ARID1A into ARID1A-mutant/GATA4-intact HCC cells (HepG2) by expression vector activated key terminal hepatocyte epithelial-differentiation genes, downregulated MYC, upregulat-ed p27/CDKN1B, inducupregulat-ed morphologic changes of epithelial dif-ferentiation, and terminated proliferation (Figure 8, C–G). These analyses suggested a model in which inactivation of hepatocyte master transcription factor GATA4 and/or GATA4 coactiva-tors impaired activation of terminal hepatocyte epithelial genes that physiologically antagonize MYC to mediate precursor-to- hepatocyte transition (Figure 9).
[image:9.585.40.529.62.417.2]CTNNB1 mutations were not detected in our HCC series. Muta-tions in CTNNB1 are known to be less frequent in HCC in Asian subjects and/or patients with hepatitis B than in HCC in patients of other ethnicities or those without hepatitis B (refs. 39–43; reviewed in ref. 44). To extend these observations, we used targeted next-generation sequencing to evaluate for CTNNB1 mutations in the Singapore HCC series and found no mutations (mean coverage 2,777, range 38–5,645; 56% of the Singapore
that mimicked that of HCC. Presumably only 1 allele of GATA4 is inactivated in HCC because some GATA4 is needed for existence along the GATA4-dependent liver differentiation continuum; Gata4 complete knockouts have liver agenesis (21, 22).
GATA4 is a known “pioneer” transcription factor, that is, GATA4 has been shown to access compacted chromatin that is inaccessible to lesser transcription factors to initiate the remodel-ing needed for subsequent gene activation (30). It is notable, there-fore, that transcription factor drivers of proliferation, hepatocyte commitment, and early differentiation (Myc, Hnf6, Hhex, Tbx3) that had preserved or even increased expression in Gata4-haplo-insufficient livers and HCC versus normal livers had chromatin already poised or open at the earliest baseline of ESC, while in con-trast, transcription factor drivers of terminal epithelial differentia-tion (Hnf4a, Hlf, and Nr1h4) and hundreds of hepatocyte epithelial- differentiation genes that had significantly decreased expression in Gata4-haploinsufficient livers and HCC had closed chromatin at this same baseline. That is, marked baseline differences in the chromatin state of proliferation/commitment versus terminal dif-ferentiation genes may interact with pioneer/master transcription factor deficiency to stall differentiation at committed, intrinsically proliferative points in the differentiation continuum.
Also implicating chromatin remodeling failure in HCC gen-esis is direct inactivation of coactivators (chromatin remodelers) themselves — transcription factors are selective in their coactivator cursors, and degree of differentiation failure correlates with
clin-ical aggressiveness of HCC (47). Even if differentiation derange-ment is not obvious by light microscopy, as can be the case with HCC classified as well differentiated (grade 1 histologic grade), it is evident by gene expression analyses that precursor genes are elevated and hundreds of hepatocyte genes are suppressed in grade 1 HCC compared with normal liver. That HCC phenocopies proliferating precursors with suspended epithelial differentiation has also been observed by others by (i) detailed immunophenotyp-ing (15); (ii) a near-diploid genome characteristic of liver precur-sors (instead of the polyploid genome of mature hepatocytes) (10, 16); (iii) capacity of HCC cells to differentiate into hepatocytes (13, 14); and (iv) pericentral vein location of HCC that is similar to that of liver precursors (10, 16).
[image:10.585.42.536.54.328.2]The mechanisms underlying this precursor phenotype of HCC were not known. A small subset of the hundreds of transcription factors expressed in cells are masters that command and coor-dinate other transcription factors to drive lineage fates. It is thus notable that a master transcription factor driver of hepatocyte lin-eage fate, GATA4 (24–26), is located in a minimal deleted segment of chromosome 8p in this and other HCC series (1, 3, 6, 7). Condi-tional deletion of 1 allele of Gata4 from murine liver, to model the haploinsufficiency observed in human HCC, created an enlarged, proliferative liver phenotype, with a gene expression profile of pre-cursors and failed terminal hepatocyte epithelial differentiation
The Journal of Clinical Investigation
R E S E A R C H A R T I C L E
female and did not have hepatitis B, alcohol use, or cirrhosis, and interestingly, neither HCC contained frequent chromosom-al structurchromosom-al gains or deletions by SNP array karyotyping. Based on this atypical character of the cases and the enrichment of the mutation in the Singapore HCC series (4% from 0.4% reported in the general ethnic Han Chinese population), this germline muta-tion could be a risk factor for HCC.
Biochemical actions of coactivators to open chromatin are bal-anced by corepressors that keep it compacted. A corollary of coact-ivator loss of function, therefore, is unbalanced activity of oppos-ing corepressors (52). This suggests pharmacologic inhibition of corepressors can potentially compensate for genetic reduction in coactivators to crack the chromatin barrier and resume epithelial differentiation of HCC cells (52). This result is observed in vitro with the clinical drug decitabine, which inhibits a corepressor, DNA methyltransferase 1 (DNMT1), that creates and/or main-tains the CpG methylation repression marks strikingly enriched at terminal differentiation versus proliferation/commitment genes usage (48, 49) — and of the coactivators interacting with GATA4,
identified by MS analysis of the GATA4 protein interactome, sev-eral (ARID1A, SMARCAD1, ARID2, SMARCA4) are genetically inactivated at a high rate in HCC (>40% inactivating mutations or deletions). Consistent with these loss-of-function events negative-ly affecting transactivation by GATA4, reintroduction of ARID1A into ARID1A-deficient/GATA4-intact HCC cells activated GATA4 target genes, resumed hepatocyte epithelial differentiation, and terminated proliferation. Also, liver-conditional deletion of 1 Arid1a allele in mice created a phenotype of proliferative liver pre-cursors with impaired hepatocyte differentiation (50), and genetic inactivation of Smarcb1 in mice potently suppressed hepatocyte differentiation and increased proliferation (51).
[image:11.585.44.525.55.408.2]We also found 2 HCC cases without GATA4 deletion, but with a very rare germline missense mutation in GATA4 (GATA4 V267M) that abrogated its interactions with mediator (MED12, etc.), another complex that mediates transcription activation. Both patients did not have usual HCC risk factors; they were
Also, the chromatin landscape of ESCs, the ultimate tissue pre-cursors, suggests that pioneer function is broadly less needed for activation of intrinsically accessible proliferation/commitment genes, but necessary for activation of intrinsically compacted terminal epithelial-differentiation genes. Notably, therefore, chromosome 8p deletion is also highly recurrent in cancers of the lung, colon, breast, prostate, head, neck, bladder, ovary, prostate, and brain, and minimal commonly deleted regions in these can-cers also incorporate GATA4 (71–75). GATA4 reintroduction into glioblastoma cell lines promoted differentiation and decreased proliferation (71). It is conceivable, therefore, that GATA4 hap-loinsufficiency and/or coactivator inactivation is how MYC- antagonizing terminal-differentiation programs are selectively suppressed in multiple cancers.
Missing from our understanding of HCC genesis was the gene(s) and pathways driving selection pressure for highly recur-rent chromosome 8p deletions. Here, we showed that GATA4 is a key TSG targeted by this alteration and that GATA4 loss of function explains in large part how HCC cells suspend the epithelial fate that would otherwise suppress replicative precursor phenotype.
Methods
Primary HCC and paired nonmalignant liver tissue. Fresh primary
HCC tumors were surgically removed (therapeutic segmentectomy or hemihepatectomy) at the National Cancer Centre Singapore between 2008 and 2011. Resected liver tissue was analyzed by frozen section to identify neoplastic and nonneoplastic areas. These were macrodis-sected for analyses as HCC and paired nonmalignant liver tissue.
Liver-conditional knockout of Gata4. Gata4 double-floxed mice
were purchased from the Jackson Laboratory (stock 008194). These mice were crossed to albumin-cre mice, also from the Jackson Labo-ratory (stock 003574). 100% of F1 progeny were Gata4 haploinsuffi-cient only in hepatocyte cells. Both double-floxed and liver-conditional
Gata4-haploinsufficient mice were monitored daily; animals with signs
of distress were euthanized by an IUCAC-approved protocol. PCR genotyping primer (Supplemental Table 6) sequences were provided by the Jackson Laboratory. DNA was isolated from mouse tails using the DNA Purification Kit (Promega catalog A1020).
RNA and DNA extraction. Snap-frozen specimens were
equilibrat-ed with a buffer (RNAlater-ICE, Ambion) that preserves RNA integrity. Frozen specimens, no larger than 0.5 cm, were added to RNAlater-ICE that was first cooled to –80°C in polypropylene tubes and equilibrat-ed with the RNAlater-ICE at –20°C overnight. The specimens were separated for (a) tissue homogenization and RNA extraction and (b) proteinase K digestion and DNA extraction. The fragment for RNA extraction was homogenized using a tissue homogenizer. The mirVana Kit (Ambion) was used per the manufacturer’s protocol for extraction of total RNA. The fragment for DNA extraction was minced with a blade into fragments approximately 2 mm in dimension. These fragments were placed in Eppendorf tubes with cold PBS and left on ice for 5 to 10 minutes to leach out the RNAlater-ICE before digestion in proteinase K for DNA extraction. After removing PBS, lysis buffer was added followed by proteinase K digestion as per the manufactur-er’s instructions for the DNeasy Blood and Tissue Kit (QIAGEN).
Cell culture and transfection. Human HCC cell lines HepG2 (ATCC,
stock Hb-8065) and PLC (ATCC, stock CRL-8024) were cultured in RPMI media with 10% FBS, 100 U/ml penicillin, and 100 μg/ml strep-(53–58). Unfortunately decitabine has trivial distribution into the
liver in vivo, hindering clinical translation to treat HCC (57, 59). Several clinical development efforts are thus directed toward improving distribution of decitabine and related 5-azacytidine into liver (57, 59). A reason to pursue such development is that cell cycle exits by resumed epithelial differentiation do not require p53 — conventional oncotherapy applies stress upstream of p53 to upregulate it and cause apoptosis (cytotoxicity); such intent is undermined when p53 or its key cofactors (e.g., p16/CDKN2A) are absent/nonfunctional, as in HCC (60).
Can MYC gain of function itself inhibit terminal epithelial dif-ferentiation (13)? Although we cannot rule this out, consideration of ordered multicellularity and experimental data here and elsewhere indicate that MYC is subordinate to terminal differentiation. For example, HNF4A dominantly antagonizes MYC to terminate prolif-eration even in cancer cells with MYC amplification (58, 61–70), and GATA4 and ARID1A restoration in the experiments here activat-ed hundractivat-eds of epithelial-differentiation genes, suppressactivat-ed MYC expression, and terminated proliferation despite several genetic alterations in the HCC cells that amplify and stabilize MYC.
[image:12.585.44.289.56.307.2]GATA4 has pioneer and/or master transcription factor roles in tissues originating from other germ layers besides endoderm.
The Journal of Clinical Investigation
R E S E A R C H A R T I C L E
ed from peripheral blood mononuclear cells was similarly sequenced to determine whether the mutation was germline.
In addition, targeted next-generation sequencing was applied to exon 4 of GATA4 (to confirm the mutation identified by Sanger sequencing) and to all coding exons of HNF1A, ARID1A, SMARCA4,
ARID2, CTNNB1, and TP53. Primers (Supplemental Table 6) were
designed using PrimerQuest (www.idtdna.com). Each target exon was amplified by PCR using 100 ng/μl or more of primary DNA. The PCR amplification protocol included an initial denaturation step (94°C for 5 minutes), followed by 19 cycles of denaturation (94°C for 30 seconds, at 25% ramp cooling temperature), annealing, and exten-sion (60°C for 3 minutes at 40% ramp cooling). After PCR amplifi-cation, subsequent purification and sequencing library preparation were according to Illumina pair-end library protocol. Briefly, DNA was purified using magnetic beads. The purified PCR products were end repaired to introduce sticky ends using end-repair enzyme (NEB catalog E6050S). Paired-end adapters were then ligated using T4 DNA Ligase (NEB catalog M0202S) to the amplified PCR fragments of about 250 bp in length. Nick fill reaction was performed using Bst DNA polymerase (NEB catalog MO374S). Library fragments and all PCR amplification were performed using HotStart Applied Biologi-cal Material (ABM) Taq DNA polymerase (ABM catalog G011). The library was subjected to deep sequencing on Illumina MiSeq using 2 × 300 paired-end sequencing following standard loading proce-dures. Coverage information for each sequenced gene for each sam-ple is reported in Supsam-plemental Table 4. Raw sequencing reads were trimmed of Illumina adapters, and low quality reads were discarded. Paired-end alignment was done using BWA 0.6 aligner with hg19 as the reference sequence. Variant extraction was done using the GATK pipeline (GATKv3.3). We prioritized variants after an elimination of sequencing/mapping errors (removal of low-quality reads, sequenc-ing depth of at least 30 reads and 10 mutation reads, removal of vari-ants with directional bias), removal of potential, common, benign polymorphisms (using publicly available databases of common and rare germline variants such as ExAC [http://exac.broadinstitute. org/], ESP6500 [http://evs.gs.washington.edu/EVS/], and 1000 Genomes [http://www.internationalgenome.org/]), and removal of variants with minor allelic frequency of more than 0.0001. Sequenc-es were aligned to the reference genome using NovoAlign and were analyzed using Integrative Genome Viewer (IGV) software.
RNA sequencing. RNA was extracted from murine livers by the
methods discussed above; however, the liver samples were also treated with DNaseI to remove potential DNA contamination. RNA integrity was measured by 1% 2D gel electrophoresis. Samples with 28S and 18S RNA (n = 3 mice per group) were sent for sequencing by ABM. RNA quality check was confirmed using Agilent 2100 Bioanalyzer, with all samples passing quality control. The samples were subjected to poly A enrichment, followed by fragmentation, first- and second-strand syn-thesis, adenylation of 3′ ends, adapter ligation, DNA fragmentation enrichment, and real-time PCR quantification. Cluster generation and sequencing were carried out in one run on NextSeq 500 (Illumina, cluster generation and 2-channel sequencing), and Bcl files were con-verted to FastQ data immediately after the run. Over forty million paired-end reads for all 6 samples were recovered from the sequenc-ing. Sequence reads were aligned to murine reference genome mm10 by Bowtie 2, and expression data were generated for analysis. Heat maps were generated using ArrayStarv3 (DNASTAR).
tomycin (Mediatech). Cells were incubated at 37°C in a 5% CO2 atmo-sphere. DNA was isolated from both cell lines for SNP array analysis. PLC cells were transfected with GATA4 WT and GATA4 V267M vec-tor, and approximately 60 × 106 cell pellets were harvested at 72 hours.
Harvested cells were resuspended in 1× PBS plus PI plus PMSF (PBSW buffer PH7-9). The pellet was centrifuged at 835 g for 5 minutes. Cells were washed 3 times in PBSW buffer.
GATA4 and ARID1A expression vectors. WT GATA4 cDNA was
cloned into pFlag-CMV4 (OriGene Technologies) using Clontech infusion cloning (Clontech Laboratories Inc.). The primers used for infusion cloning (Supplemental Table 6) were designed to insert WT GATA4 cDNA at the C terminal end of the Flag tag in the pFlagCMV4 vector (OriGene Technologies). Transient transfection of GATA4 WT or empty vector into HCC cell lines was performed using Xfect trans-fection (Clontech) following the manufacturer’s guidelines. Cell pel-lets were isolated at 0, 48, and 96 hours after transfection for down-stream analysis. pLenti-puro-ARID1A was a gift from Ie-Ming Shih (Johns Hopkins, Baltimore, MD, USA) (Addgene plasmid 39478) (76).
In vitro site-directed mutagenesis. In vitro site-directed
mutagen-esis was performed using the Stratagene QuikChange Site-Directed Mutagenesis Kit (catalog 200519). Mutagenic oligonucleotides spe-cific for point mutation 11607635G>A in GATA4 exon 4 (Supplemen-tal Table 6) were designed and ordered from Integrated DNA Tech-nologies (ITD). Both forward and reverse primers annealed to the same sequence on opposite strands of the plasmid expressing GATA4 cDNA. The mutant strand synthesis reaction was performed with the recommended PCR conditions from a Stratagene kit and using Pfu-Turbo DNA polymerase (Stratagene 200519). After the thermocy-cler reaction, the PCR product was treated with Dpn I endonuclease reagent to digest the WT parenteral DNA template. The Dpn I–treated PCR product was purified and used to transform XL1 Blue Super-competent Cells. The cells containing the mutant cDNA were used to transform E. coli at 37°C overnight. Colonies were selected and mini-prep reaction was carried out using the QIAGEN Mini-Prep Kit (cata-log 27106). The isolated bacteria DNA was sequenced to confirm the presence of the mutant GATA4 cDNA by both Sanger sequencing and target deep sequencing using primers designed to amplify WT GATA4 cDNA (data not shown) (Supplemental Table 2). Colonies with mutant GATA4 were maxi-prepared using the Promega Pure Yield Plasmid Kit (catalog A2492) and used for transfection experiments.
QRT-PCR using SYBR green. RNA was isolated using the RNeasy
method (QIAGEN), and cDNA was prepared using the iScript cDNA Synthesis Kit (Bio-Rad). QRT-PCR was done using an ABI Prism 7500 Sequence Detection System (Applied Biosystems) and SYBR Premix Ex Taq II (TakaRa). Real-time PCR primers (Supplemental Table 6) were designed with PrimerQuest (https://www.idtdna.com/primerquest/ Home/Index). The relative number of copies of mRNA (RQ) was cal-culated based on the average Ct values using the housekeeping gene
GAPDH as internal control and baseline controls for relative
expres-sion. Results are shown as mean ± SD of 3 independent experiments.
Sanger and targeted next-generation sequencing. All coding region
isolat-Covalent binding of antibody to protein G beads. 25 mg (200 μl) of protein G–sepharose was washed twice with 1× PBS, followed by incu-bation with 200 μl of Flag antibody for 1 hour at room temperature and pressure. Antibody-bound protein G was incubated in 1% chicken egg albumin for 1 hour. This was washed twice with 1× PBS. 25 mg of dimethylpimelimidate was added to 1 ml of 300 mM NEM, followed by swirling for 30 minutes at room temperature and pressure. This was repeated twice. Glycine-HCl (PH3), was added, followed by spin down. This was washed 3× using 1× PBS. Samples were then washed ×2 using nuclear extraction buffer.
Immunoprecipitation. 200 μl of nuclear protein lysate was pre-cleared using protein G-sepharose (50% slury). This was incubat-ed at 4°C for approximately 60 minutes and spun for 10 minutes at 4°C. Supernatant was transferred to fresh tubes. 30 mg nuclear pro-tein extracts (precleared lysate) was transferred to tubes with anti-body-bound protein G beads and rocked gently at 4°C overnight. This mixture was washed 5 times with 1× PBS containing 1% NP-40. Sam-ples were dried using Spin-Dry vacuum centrifugation at –100 on a SpeedVac vapor trap. Immunoprecipitation products were extracted from the protein G beads using Laemmli sample buffer.
Western blot analysis. Western blot was by standard methods:
antibodies used were GATA4 (Abcam, catalog Ab124265), anti-Flag (Sigma-Aldrich, catalog F7425-2MG), c-MYC (Cell Signaling Technol-ogy, catalog 5605), p27/CDKN1B (Cell Signaling TechnolTechnol-ogy, catalog 3833) and β-actin (Sigma-Aldrich, catalog a3854), histone 3 (Cell Sig-naling Technology, catalog 9715S), MED12 (Cell SigSig-naling Technolo-gy, catalog 4529S,) SMARCA5/SNF2 (Cell Signaling TechnoloTechnolo-gy, cat-alog 13543s), and anti-V5 (Abcam, catcat-alog Ab27671).
Protein identification by LC-MS/MS. Anti-Flag and isotype
anti-body immunoprecipitation products were separated by molecular weight using SDS-polyacrylamide gel electrophoresis and stained with colloidal Coomassie blue (GelCode Blue, Pierce Chemical). All separated proteins on the gel slices were excised (Supplemental Figure 9); proteins were reduced with dithiothreitol (Sigma-Aldrich, D0632, 10 mM), alkylated with iodoacetamide (Sigma-Aldrich, I1149, 55 mM), and digested in situ with trypsin. Peptides were extracted from gel pieces 3 times using 60% acetonitrile and 0.1% formic acid/water. The dried tryptic peptide mixture was redissolved in 20 μl of 1% formic acid for MS analysis. Tryptic peptide mixtures were analyzed by online LC-MS/MS on an Orbitrap Mass Spectrom-eter (Thermo Fisher Scientific).
Database search and data validation. Mascot Daemon software
(version 2.3.2; Matrix Science) was used to perform database searches using the Extract_msn.exe macro provided with Xcalibur (version 2.0 SR2; Thermo Fisher Scientific) to generate peaklists. The following parameters were set for creation of the peaklists: parent ions in the mass range of 400–4500, no grouping of MS/MS scans, and thresh-old at 1000. A peaklist was created for each analyzed fraction (i.e., gel slice), and individual Mascot (version 2.3.01) searches were per-formed for each fraction. The data were searched against Homo
sapi-ens entries in the UniProt protein database (May 2015 release, 151,569
total sequences; http://www.uniprot.org/). Carbamidomethylation of cysteines was set as a fixed modification, and oxidation of methionine was set as a variable modification. Specificity of trypsin digestion was set for cleavage after Lys or Arg, and 2 missed trypsin cleavage sites were allowed. The mass tolerances in MS and MS/MS were set to 10 ppm and 0.6 Da, respectively, and the instrument setting was
spec-Gene expression analysis by microarray. The HumanHT-12 v3 gene
expression microarray (Illumina) was used to analyze RNA from paired HCC and nonmalignant liver. The array evaluated over 25,000 annotated genes with over 48,000 probes designed using RefSeq (Build 36.2, Rel 22) and UniGene (Build 199). Microarray probe inten-sity values were subject to average normalization by GenomeStudio software to minimize the effects of variation from nonbiological fac-tors and to calculate expression measures from the raw data. Expres-sion measures of probe sets covering specific genes of interest were exported as a spreadsheet to the SAS System V9.2 (SAS Institute Inc.) for further statistical analysis. Only probe intensity data with detec-tion P values of less than 0.05 (a statistical calculadetec-tion that provides the probability that the signal from a given probe is greater than the average signal from the negative controls) were used in analyses of differences between groups of samples. Heat maps were generated by ArrayStarv3 (DNASTAR). All original microarray data were deposited in the NCBI’s Gene Expression Omnibus (GEO GSE57958).
High-resolution molecular karyotyping by SNP array. The
Human-660W-Quad v1.0 DNA BeadChip Kit was used for high-resolution molecular karyotyping of DNA isolated from primary HCC specimens and a control nonmalignant DNA. The BeadChip analyzed more than 660,000 individual loci. Genome Studio (Illumina), KaryoStudio (Illumina), and IGV (77) software were used to document large chro-mosome aberrations (e.g., >75 kb), to score these aberrations as loss, gain, or uniparental disomy (UPD), and for crossmatching these aber-rations with information from public databases. Affymetrix SNP6 CEL files of 27 liver-derived CCLE samples were converted into A- and B-allele frequencies using crlmm of the Bioconductor R package oligo. log R ratios (LRR) were then computed as log2 of A+B divided by its median. Curves fitted to LRR were obtained using the ggplot2 func-tion stat_smooth with its span parameter set to 0.3. The smooth curve displayed without its data was found similarly, but using data from all 27 CCLE liver cell lines combined.
Cell fractionation and nuclear protein extraction. Cells were
resus-pended in 500 μl PBSW followed by addition of 10% NP-40 (1:20 μl). This was incubated on ice for 1 minute followed by centrifugation at 835 g for 10 minutes. Supernatant containing the cytoplasmic frac-tion was transferred to a separate tube. Nuclear pellets were washed in PBSW buffer and centrifuged at 835 g for 10 minutes. Benzonase was added (1 μl), and this was incubated on ice for 90 minutes and vortexed every 30 minutes. 250 μl of nuclear extraction buffer E1 (250
μl PBSW + 2% NP40 + 500 mM [5 μl] + 5 M NaCl [25 μl]) was add-ed, followed by a 10-minute incubation on ice; mixture was vortexed every 5 minutes. Sample was centrifuged at full speed for 10 minutes. The supernatant, which contained the cytoplasmic fraction, was trans-ferred to a separate tube. 5 μl of 10% SDS was added to the remaining nuclear pellet. Nuclear protein was extracted again by adding 250 μl of nuclear extraction buffer E2 (250 μl PBSW + 1% NP40 + 500 mM [2.5 μl] NaCl) to the remaining pellet. Sample was incubated on ice for 10 minutes and vortexed every 5 minutes as above. This was followed by centrifugation at full speed for 15 minutes. Supernatant was added to the nuclear protein extraction tube. Nuclear extraction buffer (200
The Journal of Clinical Investigation
R E S E A R C H A R T I C L E
to provide a ranked representation of tissue expression associations that were most saturated or “enriched” with the input gene lists. For analysis of public ChIP sequencing (ChIP-Seq) data, aligned H1 ESC H3K4me3 ChIP-Seq data (ENCFF775QSF) were imported, analyzed, and visualized using EaSeq and its suite of integrated tools; all values were normalized to reads per million per 1 kbp (80).
Wilcoxon rank sum and Student’s t tests were 2-sided and per-formed at the 0.05 significance level unless stated otherwise. SDs for each set of measurements were calculated and represented as y axis error bars on each graph. JMP Pro 10.0 or SAS statistical software was used to perform statistical analysis (SAS Institute Inc., http://www. jmp.com) including correlation analyses.
Study approval. Human samples were obtained in the context of
clinically indicated surgery and with written informed consent from patients in accordance with the Declaration of Helsinki and using protocols approved by the SingHealth Institutional Review Board at the National Cancer Centre Singapore; human HCC tumors and paired normal samples were surgically removed at the National Can-cer Centre Singapore between 2008 and 2011. Animal studies were conducted at the Cleveland Clinic using protocols approved by the Cleveland Clinic IACUC.
Author contributions
All authors reviewed and edited the manuscript. FOE designed and performed experiments. WHS validated sequencing experiments of GATA4 and in vitro functional effects of GATA4 transfection. XG validated GATA4 immunoprecipitation. EQ generated the Gata4 conditional KO mouse model. BP performed bioinformat-ics and next-generation sequence analysis. HM analyzed GATA4 sequences. JB performed IHC studies. JN, CLC, RB, LSK, JL, RC, and MT isolated DNA and RNA from paired normal versus HCC samples. ZH isolated and analyzed gDNA from HCC and adjacent normal tissue. KPN analyzed ChIP-Seq data. JM reviewed deep sequencing data and edited the manuscript. TR performed biosta-tistics and analyzed SNPA data. AC, LLO, YMT, PCC, PC, CYC, and KHL isolated and characterized tissues from HCC patients. LY and EH validated IHC studies. HCT and YS conceived hypoth-eses, designed experiments, obtained funding, analyzed data, and wrote the manuscript.
Acknowledgments
HCT is supported by the National Medical Research Council (NMRC)/MOHIAFCAT2/001/2014, the Biomedical Research Council (BMRC) EDB-IAF311020, a National Cancer Centre Research Fund (NCCRF) pilot grant, a Terry Fox Foundation Pilot Grant, and block funding from the National Cancer Centre Sin-gapore. YS is supported by case GI SPORE P50CA150964, Com-prehensive Cancer Center grant P30 CA043703, and Cleveland Clinic HCC Center of Excellence grants. Financial support was also received from the NIH (RO1 CA204373).
Address correspondence to: Han Chong Toh, Division of Medical Oncology, National Cancer Centre Singapore, Singapore. Phone: 65.64368314; Email: [email protected]. Or to: Yogen Saunthararajah, Taussig Cancer Institute, 9500 Euclid Avenue R40, Cleveland, Ohio 44195, USA. Phone: 216.444.8170; Email: [email protected].
ified as ESI-Trap. To calculate the FDR, the search was performed using the decoy option in Mascot. The spectral FDR and protein FDR were 0.35% ± 0.17% and 4.28% ± 1.99%, respectively. A minimum Mascot ion score of 25 and peptide rank 1 were used for automatically accepting all peptide MS/MS spectra.
LFQ. Relative protein quantification was performed using spectral
count-based label-free relative protein quantitation (LFQ). For each biological sample, data from the individual gel slices were combined. Statistical analysis was performed on all proteins identified, with aver-age spectral counts of 2 or more for at least 1 of the 3 experiments. The spectral count data were normalized by total spectral counts of the bait protein (GATA4) in each sample to adjust for differences in over-all protein levels among samples. Proteins were considered to have a significant difference in abundance if there was a difference of 2-fold or greater in normalized spectral counts between experiments and a P value of 0.01 or less using a 2-tailed t test. Spectral counts for all pro-teins and peptides identified are provided in Supplemental Table 5.
GATA4 DNA-binding analysis. A 5′-GATA probe (ATTACTGATA-ATGGTG-3′ X3) and negative control probe (5′ -ATTACTCCCCAT-GGTG-3′ X3) (underlines indicate GATA4 response element versus scrambled sequence ‘CCCC’) were designed and ordered from ITD. The probes were biotinylated with a biotin-labeling kit following the manufacturer’s guidelines (Thermo Fisher Scientific, catalog K0651). GATA4 WT and GATA4 V267M vector were transfected in HCC cell PLC, cell pellets from 6.0 × 10⁶ cells were isolated at 48 hours, and
nuclear fractions were extracted using nuclear extraction buffer: (250
μl PBSW buffer PH7-9) + ( 2% NP40 + 500 mM [5 μl] + 5 M NaCl [25
μl]). Isolated nuclear fractions were incubated with the GATA probe and the scramble control probe at 4°C overnight. Incubated fractions were pulled down using streptavidin beads for 1 hour at room temperature.
Bioinformatic and statistical analysis. Proteins identified by
label-free LC-MS/MS were analyzed by the Ingenuity Pathway Analysis Tool (IPA, Ingenuity Systems). The core analysis function included in IPA was used to interpret the data in the context of biological pro-cesses, pathways, and networks. Right-tailed Fisher’s exact test was used to determine a P value indicating that the probability of biolog-ical functions, canonbiolog-ical pathways, and diseases associated with the networks was not because of chance alone. Each protein identifier was mapped to its corresponding gene object in the Ingenuity Path-ways Knowledge Base.
1. Xue W, et al. A cluster of cooperating tumor-suppressor gene candidates in chro-mosomal deletions. Proc Natl Acad Sci U S A. 2012;109(21):8212–8217.
2. Kan Z, et al. Whole-genome sequencing identi-fies recurrent mutations in hepatocellular carci-noma. Genome Res. 2013;23(9):1422–1433. 3. Cooke SL, Pole JC, Chin SF, Ellis IO, Caldas C,
Edwards PA. High-resolution array CGH clarifies events occurring on 8p in carcinogenesis. BMC Cancer. 2008;8:288.
4. Yan J, et al. LFIRE-1/HFREP-1, a liver-specific gene, is frequently downregulated and has growth suppressor activity in hepatocellular car-cinoma. Oncogene. 2004;23(10):1939–1949. 5. Demchev V, et al. Targeted deletion of fibrinogen
like protein 1 reveals a novel role in energy sub-strate utilization. PLoS ONE. 2013;8(3):e58084. 6. Xue W, et al. DLC1 is a chromosome 8p tumor
suppressor whose loss promotes hepatocellular carcinoma. Genes Dev. 2008;22(11):1439–1444. 7. Yuan BZ, Miller MJ, Keck CL, Zimonjic DB,
Thorgeirsson SS, Popescu NC. Cloning, charac-terization, and chromosomal localization of a gene frequently deleted in human liver cancer (DLC-1) homologous to rat RhoGAP. Cancer Res. 1998;58(10):2196–2199.
8. Durkin ME, Avner MR, Huh CG, Yuan BZ, Thorgeirsson SS, Popescu NC. DLC-1, a Rho GTPase-activating protein with tumor suppres-sor function, is essential for embryonic develop-ment. FEBS Lett. 2005;579(5):1191–1196. 9. Boulter L, Lu WY, Forbes SJ. Differentiation of
progenitors in the liver: a matter of local choice. J Clin Invest. 2013;123(5):1867–1873.
10. Wang B, Zhao L, Fish M, Logan CY, Nusse R. Self-renewing diploid Axin2(+) cells fuel homeostatic renewal of the liver. Nature. 2015;524(7564):180–185.
11. Cardinale V, et al. Multipotent stem/progenitor cells in human biliary tree give rise to hepato-cytes, cholangiohepato-cytes, and pancreatic islets. Hepatology. 2011;54(6):2159–2172. 12. Conigliaro A, et al. Evidence for a common
progenitor of epithelial and mesenchymal components of the liver. Cell Death Differ. 2013;20(8):1116–1123.
13. Shachaf CM, et al. MYC inactivation uncov-ers pluripotent differentiation and tumour dormancy in hepatocellular cancer. Nature. 2004;431(7012):1112–1117.
14. Zhang F, et al. Combined hepatocellular chol-angiocarcinoma originating from hepatic progenitor cells: immunohistochemical and double-fluorescence immunostaining evidence. Histopathology. 2008;52(2):224–232.
15. Köhn-Gaone J, Gogoi-Tiwari J, Ramm GA, Olynyk JK, Tirnitz-Parker JE. The role of liver progenitor cells during liver regeneration, fibro-genesis, and carcinogenesis. Am J Physiol Gastro-intest Liver Physiol. 2016;310(3):G143–G154. 16. Wang R, Ferrell LD, Faouzi S, Maher JJ, Bishop
JM. Activation of the Met receptor by cell attachment induces and sustains hepatocellu-lar carcinomas in transgenic mice. J Cell Biol. 2001;153(5):1023–1034.
17. Lazarevich NL, et al. Progression of HCC in mice is associated with a downregulation in the
expression of hepatocyte nuclear factors. Hepa-tology. 2004;39(4):1038–1047.
18. Bonzo JA, Ferry CH, Matsubara T, Kim JH, Gon-zalez FJ. Suppression of hepatocyte proliferation by hepatocyte nuclear factor 4α in adult mice. J Biol Chem. 2012;287(10):7345–7356. 19. Ning BF, et al. Hepatocyte nuclear factor 4 alpha
suppresses the development of hepatocellular carcinoma. Cancer Res. 2010;70(19):7640–7651. 20. Chakraborty A, et al. Neil2-null mice accumulate
oxidized DNA bases in the transcriptionally active sequences of the genome and are sus-ceptible to innate inflammation. J Biol Chem. 2015;290(41):24636–24648.
21. Watt AJ, Zhao R, Li J, Duncan SA. Development of the mammalian liver and ventral pancreas is dependent on GATA4. BMC Dev Biol. 2007;7:37. 22. Molkentin JD, Lin Q, Duncan SA, Olson EN.
Requirement of the transcription factor GATA4 for heart tube formation and ventral morphogen-esis. Genes Dev. 1997;11(8):1061–1072. 23. Li T, et al. Multi-stage analysis of gene expression
and transcription regulation in C57/B6 mouse liver development. Genomics. 2009;93(3):235–242. 24. Huang P, et al. Induction of functional hepatocyte-
like cells from mouse fibroblasts by defined fac-tors. Nature. 2011;475(7356):386–389. 25. Sekiya S, Suzuki A. Direct conversion of mouse
fibroblasts to hepatocyte-like cells by defined factors. Nature. 2011;475(7356):390–393. 26. DeLaForest A, et al. HNF4A is essential for
specification of hepatic progenitors from human pluripotent stem cells. Development. 2011;138(19):4143–4153.
27. Pawar SA, et al. C/EBP{delta} targets cyclin D1 for proteasome-mediated degradation via induc-tion of CDC27/APC3 expression. Proc Natl Acad Sci U S A. 2010;107(20):9210–9215.
28. Hwang-Verslues WW, Sladek FM. Nuclear receptor hepatocyte nuclear factor 4alpha1 competes with oncoprotein c-Myc for control of the p21/WAF1 promoter. Mol Endocrinol. 2008;22(1):78–90. 29. Parviz F, et al. Hepatocyte nuclear factor 4alpha
controls the development of a hepatic epi-thelium and liver morphogenesis. Nat Genet. 2003;34(3):292–296.
30. Cirillo LA, Lin FR, Cuesta I, Friedman D, Jarnik M, Zaret KS. Opening of compacted chro-matin by early developmental transcription factors HNF3 (FoxA) and GATA-4. Mol Cell. 2002;9(2):279–289.
31. Amin MB, et al., eds. AJCC Cancer Staging Manu-al. 8th ed. New York, NY: Springer International Publishing; 2017.
32. Fero ML, et al. A syndrome of multiorgan hyper-plasia with features of gigantism, tumorigenesis, and female sterility in p27(Kip1)-deficient mice. Cell. 1996;85(5):733–744.
33. Kiyokawa H, et al. Enhanced growth of mice lacking the cyclin-dependent kinase inhibitor function of p27(Kip1). Cell. 1996;85(5):721–732. 34. Nakayama K, et al. Mice lacking p27(Kip1) display
increased body size, multiple organ hyperplasia, retinal dysplasia, and pituitary tumors. Cell. 1996;85(5):707–720.
35. Tang ZH, et al. Two novel missense mutations of GATA4 gene in Chinese patients with sporadic congenital heart defects. Zhonghua Yi Xue Yi
Chuan Xue Za Zhi. 2006;23(2):134–137. 36. Wang E, et al. Identification of functional
muta-tions in GATA4 in patients with congenital heart disease. PLoS ONE. 2013;8(4):e62138. 37. Teo YY, et al. Singapore Genome Variation
Proj-ect: a haplotype map of three Southeast Asian populations. Genome Res. 2009;19(11):2154–2162. 38. Bosch FX, Ribes J, Díaz M, Cléries R. Primary
liver cancer: worldwide incidence and trends. Gastroenterology. 2004;127(5 Suppl 1):S5–S16. 39. Kawai-Kitahata F, et al. Comprehensive analyses
of mutations and hepatitis B virus integration in hepatocellular carcinoma with clinicopathologi-cal features. J Gastroenterol. 2016;51(5):473–486. 40. Guichard C, et al. Integrated analysis of somatic mutations and focal copy-number changes iden-tifies key genes and pathways in hepatocellular carcinoma. Nat Genet. 2012;44(6):694–698. 41. Boyault S, et al. Transcriptome classification of
HCC is related to gene alterations and to new ther-apeutic targets. Hepatology. 2007;45(1):42–52. 42. Kim YD, et al. Genetic alterations of Wnt
signaling pathway-associated genes in hepa-tocellular carcinoma. J Gastroenterol Hepatol. 2008;23(1):110–118.
43. Imbeaud S, Ladeiro Y, Zucman-Rossi J. Identifi-cation of novel oncogenes and tumor suppressors in hepatocellular carcinoma. Semin Liver Dis. 2010;30(1):75–86.
44. Tornesello ML, Buonaguro L, Tatangelo F, Botti G, Izzo F, Buonaguro FM. Mutations in TP53, CTNNB1 and PIK3CA genes in hepatocellular car-cinoma associated with hepatitis B and hepatitis C virus infections. Genomics. 2013;102(2):74–83. 45. Ding Q, et al. Erk associates with and primes GSK-
3beta for its inactivation resulting in upregulation of beta-catenin. Mol Cell. 2005;19(2):159–170. 46. Hsieh A, Kim HS, Lim SO, Yu DY, Jung G.
Hep-atitis B viral X protein interacts with tumor suppressor adenomatous polyposis coli to activate Wnt/β-catenin signaling. Cancer Lett. 2011;300(2):162–172.
47. Subramaniam S, Kelley RK, Venook AP. A review of hepatocellular carcinoma (HCC) staging sys-tems. Chin Clin Oncol. 2013;2(4):33.
48. Lemon B, Inouye C, King DS, Tjian R. Selec-tivity of chromatin-remodelling cofactors for ligand-activated transcription. Nature. 2001;414(6866):924–928.
49. Sikorski TW, Joo YJ, Ficarro SB, Askenazi M, Buratowski S, Marto JA. Proteomic analysis demonstrates activator- and chromatin- specific recruitment to promoters. J Biol Chem. 2012;287(42):35397–35408.
50. Sun X, et al. Suppression of the SWI/SNF compo-nent arid1a promotes mammalian regeneration. Cell Stem Cell. 2016;18(4):456–466.
51. Gresh L, et al. The SWI/SNF chromatin- remodeling complex subunit SNF5 is essen-tial for hepatocyte differentiation. EMBO J. 2005;24(18):3313–3324.
52. Gu X, et al. Runx1 regulation of Pu.1 corepressor/ coactivator exchange identifies specific molecu-lar targets for leukemia differentiation therapy. J Biol Chem. 2014;289(21):14881–14895. 53. Venturelli S, et al. Epigenetic combination
The Journal of Clinical Investigation
R E S E A R C H A R T I C L E
2007;109(10):2132–2141.
54. Dannenberg LO, Edenberg HJ. Epigenetics of gene expression in human hepatoma cells: expression profiling the response to inhibition of DNA methylation and histone deacetylation. BMC Genomics. 2006;7:181.
55. Arai M, et al. Sequential gene expression chang-es in cancer cell linchang-es after treatment with the demethylation agent 5-Aza-2’-deoxycytidine. Cancer. 2006;106(11):2514–2525.
56. Mei Q, et al. An open-label, single-arm, phase I/ II study of lower-dose decitabine based therapy in patients with advanced hepatocellular carcino-ma. Oncotarget. 2015;6(18):16698–16711. 57. Saunthararajah Y. Key clinical observations
after 5-azacytidine and decitabine treatment of myelodysplastic syndromes suggest practical solutions for better outcomes. Hematology Am Soc Hematol Educ Program. 2013;2013:511–521. 58. Saunthararajah Y, et al. Evaluation of
noncy-totoxic DNMT1-depleting therapy in patients with myelodysplastic syndromes. J Clin Invest. 2015;125(3):1043–1055.
59. Ebrahem Q, Mahfouz RZ, Ng KP, Saunthara-rajah Y. High cytidine deaminase expression in the liver provides sanctuary for cancer cells from decitabine treatment effects. Oncotarget. 2012;3(10):1137–1145.
60. Velcheti V, Radivoyevitch T, Saunthararajah Y. Higher-level pathway objectives of epigenetic therapy: A solution to the p53 problem in cancer. Am Soc Clin Oncol Educ Book. 2017;37:812–824. 61. Acosta JC, et al. Myc inhibits p27-induced
erythroid differentiation of leukemia cells by repressing erythroid master genes without reversing p27-mediated cell cycle arrest. Mol Cell Biol. 2008;28(24):7286–7295.
62. Negrotto S, et al. Noncytotoxic differentiation treatment of renal cell cancer. Cancer Res. 2011;71(4):1431–1441.
63. Grote D, Souabni A, Busslinger M, Bouchard M. Pax 2/8-regulated Gata 3 expression is necessary for morphogenesis and guidance of the nephric duct in the developing kidney. Development. 2006;133(1):53–61.
64. Green LM, Wagner KJ, Campbell HA, Addison K, Roberts SG. Dynamic interaction between WT1 and BASP1 in transcriptional regula-tion during differentiaregula-tion. Nucleic Acids Res. 2009;37(2):431–440.
65. Lucas B, Grigo K, Erdmann S, Lausen J, Klein-Hitpass L, Ryffel GU. HNF4alpha reduces proliferation of kidney cells and affects genes deregulated in renal cell carcinoma. Oncogene. 2005;24(42):6418–6431.
66. Ramaswamy S, Nakamura N, Sansal I, Bergeron L, Sellers WR. A novel mechanism of gene regu-lation and tumor suppression by the transcription factor FKHR. Cancer Cell. 2002;2(1):81–91. 67. Aschauer L, et al. Delineation of the key aspects
in the regulation of epithelial monolayer forma-tion. Mol Cell Biol. 2013;33(13):2535–2550. 68. Kojima T, et al. FOXO1 and TCF7L2 genes involved in metastasis and poor prognosis in clear cell renal cell carcinoma. Genes Chromo-somes Cancer. 2010;49(4):379–389.
69. Negrotto S, et al. CpG methylation patterns and decitabine treatment response in acute myeloid leukemia cells and normal hematopoietic precur-sors. Leukemia. 2012;26(2):244–254.
70. Ng KP, et al. p53 independent epigenetic- differentiation treatment in xenotransplant models of acute myeloid leukemia. Leukemia. 2011;25(11):1739–1750.
71. Agnihotri S, et al. A GATA4-regulated tumor suppressor network represses formation of malignant human astrocytomas. J Exp Med. 2011;208(4):689–702.
72. Akiyama Y, et al. GATA-4 and GATA-5 transcrip-tion factor genes and potential downstream
anti-tumor target genes are epigenetically silenced in colorectal and gastric cancer. Mol Cell Biol. 2003;23(23):8429–8439.
73. Guo M, et al. Hypermethylation of the GATA gene family in esophageal cancer. Int J Cancer. 2006;119(9):2078–2083.
74. Cai KQ, et al. Loss of GATA4 and GATA6 expression specifies ovarian cancer histological subtypes and precedes neoplastic transforma-tion of ovarian surface epithelia. PLoS ONE. 2009;4(7):e6454.
75. Hua G, et al. A negative feedback regulatory loop associates the tyrosine kinase receptor ERBB2 and the transcription factor GATA4 in breast can-cer cells. Mol Cancan-cer Res. 2009;7(3):402–414. 76. Guan B, Wang TL, Shih IeM. ARID1A, a factor
that promotes formation of SWI/SNF-mediated chromatin remodeling, is a tumor suppres-sor in gynecologic cancers. Cancer Res. 2011;71(21):6718–6727.
77. Robinson JT, et al. Integrative genomics viewer. Nat Biotechnol. 2011;29(1):24–26.
78. Reich M, Liefeld T, Gould J, Lerner J, Tamayo P, Mesirov JP. GenePattern 2.0. Nat Genet. 2006;38(5):500–501.
79. Huang da W, Sherman BT, Lempicki RA. Sys-tematic and integrative analysis of large gene lists using DAVID bioinformatics resources. Nat Protoc. 2009;4(1):44–57.
80. Lerdrup M, Johansen JV, Agrawal-Singh S, Han-sen K. An interactive environment for agile anal-ysis and visualization of ChIP-sequencing data. Nat Struct Mol Biol. 2016;23(4):349–357. 81. Nazor KL, et al. Recurrent variations in DNA
methylation in human pluripotent stem cells and their differentiated derivatives. Cell Stem Cell. 2012;10(5):620–634.