Heavy Metals’ Spatial Distribution Characteristics in a
Copper Mining Area of Zhejiang Province
*
Hua Sun1, Juan Li1, Xiaojun Mao2
1Department of Resource, Environment and Urban and Rural Planning, Nanjing Agricultural University, Nanjing, China 2Department of Geographic Science, Zhejiang Normal University, Jinhua, China
Email: [email protected]
Received July 11, 2011; revised September 3, 2011; accepted September 23, 2011
ABSTRACT
The spatial distribution characteristics of six heavy metals and metalloid in soil of Zhuji Lipu copper mining area, Zhe-jiang Province, was studied by using geostatistics approaches combined with GIS. These elements included Pb, As, Cr, Cu, Zn and Ni. The statistical analyses showed that concentrations of these elements were lognormal distribution. Con-centrations of Pb, As, Cu, Zn and Ni were strongly correlated with each other indicating that these elements in soils may be from the same pollution source. However, accumulation of Cr was unique with its geometric mean being close to that in the control soil. This indicates that Cr content was mainly influenced by soil factors. The Kriging method was applied to estimate the unobserved points. The Kriging interpolation maps reflected significant spatial distribution of these elements as influenced by both pollution and geological factors. The present study indicated that GIS based geo-statistics method could accurately analyze the spatial variation of heavy metals and metalloid in the mining area. Over-all, higher concentrations of heavy metals and metalloid were found in the center of both the north and south sides. The content of copper in the south was significantly higher than that in the north due to paddy field land uses. In addition, the terrain of four terraces tilted to the center and the broad irrigation accident occurred in the 4th trench in the south of sampling area were also contributed to the higher concentrations of these elements.
Keywords: Copper Mining Area; Heavy Metals; Spatial Characteristics; GIS
1. Introduction
Arable land pollution was becoming more serious in Chi- na and the world [1]. Mining and smeltering activities not only generated heavy metal pollution but also resu- lted in determination of soil quality and destruction of the ecological function of the system [2]. Currently in south-ern region of China, rapid development in mining indus-try has produced significant environmental problems including mine soil, water, and air pollution [3-6], which seriously affected food security and health of human and animal. Due to their long-term duration, heavy metal po- lluted soil is difficult to be remediated [7]. Therefore, re- mediation of heavy metal polluted soils has become a hot issue and understanding of the spatial distribution and variation of heavy metal pollution is an important pre-requisite.
The objectives of this study were to investigate the spa-tial distribution and variation of heavy metals and metal-loid in soils of Hang Pu copper plants of Zhuji City, Zhe-
jiang Province of China.
2. A study Area and Research Programs
2.1. The Study Area
Zhejiang North-central Pu mine is located in Zhuji City, Zhejiang Province, 29˚43'23"N, 119˚59'09"E with a total area of the mining area 0.8 km 2. Hilly terrain within the mining area was a major landscape. Mining land is in the subtropical monsoon climate with annual average tem-perature of 16.2˚C and ≥10˚C annual accumulated tem-perature 4924˚C - 5233˚C. Annual rainfall is 1335.9 mm and annual average evaporation is 1260.7 mm with an-nual average relative humidity of 75.1%. Soil type is mainly yellow red soil with red sandstone-shale devel-opment. Sampling areas are located north of the mining area.
2.2. Soil Sampling Plan
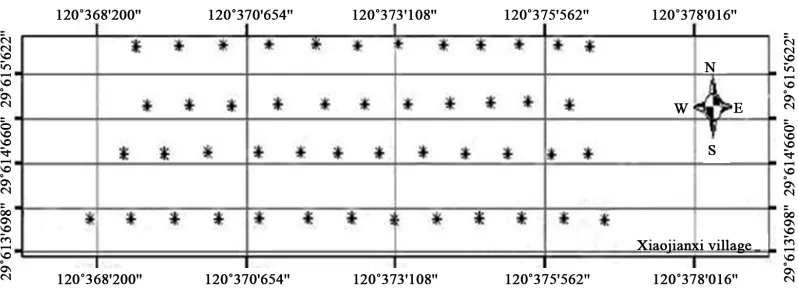
Since the mine area had relatively simple topography, the total 48 samples with a space between adjacent points of 10 meter were planned in order to ensure a representative sampling. In the north side of one major irrigation trench,
*The manuscript was sponsored by the humanities and social scientific
all these sampling were carefully distributed according to the land-use types and topographic characteristics (face, direction and length of ladder status) (Figure 1).
Mining water overflowing has occurred in the south east side of the 4th irrigation tunnels. Sampling areas was located about 300 meters south side and irrigation canal was along the general direction of flowing through the sampling areas from south to north central region.
2.3. Soil Sample Collection and Analyses
According to “soil environmental quality monitoring te- chnical specifications (NY/T395-2000)”, soils were col-lected and prepared. Surface soil (0 cm - 20 cm) was sam-pled from each point. Soils were then air-dried and ground through 2 mm sieve for analyses. Soils were analyzed for total lead, arsenic, chromium, copper, zinc, nickel, pH and etc [8].
Lead, arsenic, chromium, copper, zinc, nickel were de- termined with British X-ray fluorescence wavelength dis- persive spectrometer (Model AFS-820, PANalytical Axios production company).
2.4. Spatial Variability Analysis Method
Geographic information system (GIS) is fit for acquisi-tion and processing of the environmental informaacquisi-tion and based on geographic location and the spatial analysis techniques, which can make a quantitative evaluation of regional environment. We can visual display changes in the regional distribution of pollution by taking advantage of GIS technology with visualization of the results of the evaluation. At present, geographic information system (GIS) has been widely applied to the research of regional envi-ronmental pollution as an important spatial analysis te- chnology; it provides effective means for researching the spatial variability of pollutants.
Therefore, the paper chooses this method to research the spatial distribution characteristics of heavy metals and show the importance of the impact of heavy metals on the ecological environment.
In this paper, geostatistical spatial analyses were used to generally semi-variance map and describe spatial va- riability [9]. As a best spatial interpolation method, it has been widely applied to a regionalized variable characte- rization in soil science, environmental science and ecol-ogy and other fields [10]. ArcGIS9.1 was used for this geostatistical analysis, including the semi-variogram (semi- variogram) of the calculation and fitting comparison, Kriging spatial interpolation and simulation error analy-sis.
Semi-variance function is also often referred to as va- riation function, which is studied in geostatistics of soil variability [11]. Located in the one-dimensional (two-di- mensional or three-dimensional) space in different loca-tions x1, x2,xn on a certain soil characteristics of the
observed value of Z(x1), Z(x2),Z(xn), Semi-variance
[γ(h)] can reflect the spatial dependence of regionalized variables, the calculation can be estimated under:
2 1 1 2 n i i ih Z X Z X
N h
= hwhere N (h) is used for spacing the number of all pairs of observation points. With h as the abscissa, γ(h) was for the vertical coordinate mapping, that is, semi-variance diagram. Spatial local interpolation (Kriging method) is based on variation of a function and its structural analysis in a limited region of the regionalized variable values for the best linear unbiased estimation method, namely, (is a weighting factor, Z(x) is the sample value, Z is the esti-mated value):
1
n
i i i i
z z x
3. Results and Analysis
3.1. Statistical Analysis of Concentrations of Soil Heavy Metals and Metalloid
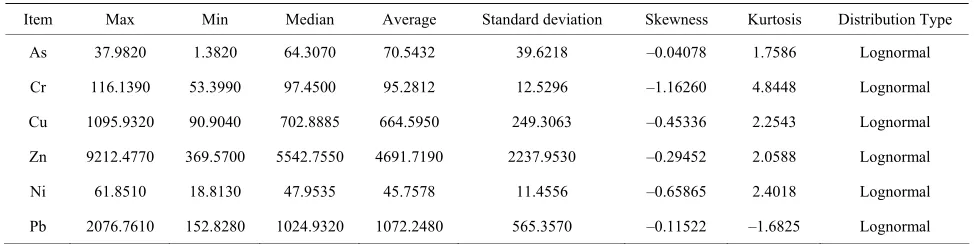
[image:2.595.100.499.576.723.2]Concentrations of six heavy metals were summarized in Table 1. The results showed that the highest variation
Table 1. Descriptive statistics of soil heavy metals and metalloid contents (mg/kg).
Item Max Min Median Average Standard deviation Skewness Kurtosis Distribution Type
As 37.9820 1.3820 64.3070 70.5432 39.6218 –0.04078 1.7586 Lognormal
Cr 116.1390 53.3990 97.4500 95.2812 12.5296 –1.16260 4.8448 Lognormal
Cu 1095.9320 90.9040 702.8885 664.5950 249.3063 –0.45336 2.2543 Lognormal
Zn 9212.4770 369.5700 5542.7550 4691.7190 2237.9530 –0.29452 2.0588 Lognormal
Ni 61.8510 18.8130 47.9535 45.7578 11.4556 –0.65865 2.4018 Lognormal
Pb 2076.7610 152.8280 1024.9320 1072.2480 565.3570 –0.11522 –1.6825 Lognormal
was found for concentrations of As, Cu, Zn, and Pb. The sources of these elements were contamination from min-ing activities over the years, especially through acid mine waste water. According to field surveys in 1967, the stu- dy area received acid mine waste water outside the Bay. In addition, a heavy application of chemical fertilizers and pesticides may also be important pollution sources for these elements. The major chemical fertilizer was su- perphosphate, potassium chloride, and urea. Frequently phosphate fertilizers contained some of these elements. Among all these elements, Cr had the least variation as well as Ni, indicating fewer impacts of anthropogenic sources on these two elements Cr and Ni.
According to the soil environmental quality standard of China (GB15618-1995), soils in the studied area (pH < 6.5) exceeded 100% of copper and zinc, lead standards, 91.67% of arsenic and 79.17% of nickel. For the studied area, soil copper, zinc, lead and arsenic contents have reached critical levels of pollution. But nickel pollution was relatively slight with an average of 45.7 mg/kg (Ni Class II standard is 40 mg/kg), while chromium has not yet to reach pollution levels. Therefore, the study area was in general characterized by combined pollution of main Cu, Zn, Pb and As.
In addition, the skewness and kurtosis analyses indica- te that arsenic, chromium, copper, zinc, nickel, and lead had a negative bias, and the addition to both Cr spikes outside the state. The frequency distribution histogram (Histogram) showed that six heavy metals and metalloid in soils studied were characterized by normal distribu-tion.
3.2. The Correlation between Heavy Metals and Metalloid in Soils
Table 2 showed that in soils of the studied area, a strong cross correlation occurred among these heavy metals and metalloid, especially between As-Cu, As-Zn, As-Ni, As- Pb, Cu-Zn, Cu-Ni, Cu-Pb, Zn-Ni, Zn-Pb, Ni-Pb. This indicates that all these elements may have a same source mainly from anthropogenic mining relevant activities. However, correlation between Cr and As or Cr, Cu, Zn,
Ni, and Pb were low. Therefore, As has the homology with Cu, Zn, Ni and Pb.
Affected by mining pollution processes, the content of As changed simultaneously with other heavy metals, while Cr was not significant, the elements of mining po- llution and the distribution were further demonstrated.
3.3. Spatial Variation Analysis of Heavy Metal in the Soil under the Conditions of
the Isotropic
Due to the presence of specific value of the variable, which may cause interruption of a continuous surface, experimental semi-variogram will distort or even obscure the inherent spatial structure of the variable characteris-tics [12]. In this paper we identified the specific value- domain method [13], that is, the sample average plus or minus three times the standard deviations, in this interval (±3 s) other than the data were as specific values, and then the normal maximum and minimum values were used instead of specific values. Subsequent calculations were based on the field data after treatment.
Table 2. The correlation coefficients of concentrations of soil heavy metals and metalloid.
As Cr Cu Zn Ni Pb
As 1 0.451 0.910** 0.817** 0.875** 0.971**
Cr 0.451 1 0.445 0.402 0.505 0.501
Cu 0.910** 0.455 1 0.882** 0.903** 0.873**
Zn 0.817** 0.402 0.882** 1 0.846** 0.779**
Ni 0.875** 0.505 0.903** 0.846** 1 0.870**
Pb 0.971** 0.501 0.873** 0.779** 0.870** 1
**indicates at p < 0.01 (n 48).
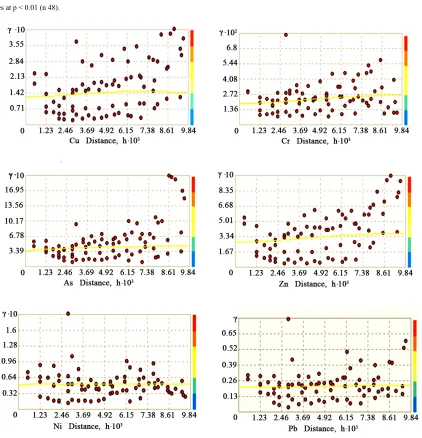
Figure 2. The corresponding graph of semivariograms of soil heavy metals.
It is necessary to fit different methods and parameters repeatedly for determining the theoretical model, in order to obtain the theoretical variation function for simulating that distance has impacted on data point. So, theoretical variation curves should be the most approximation with
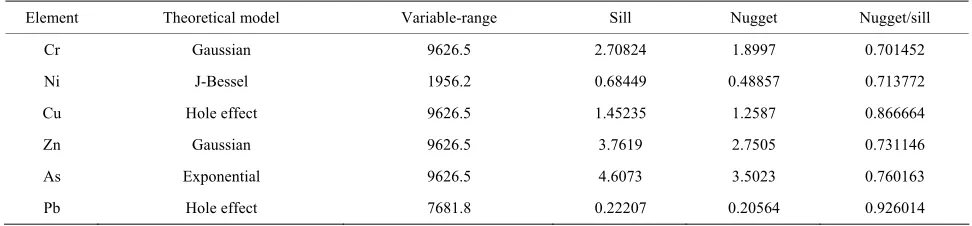
[image:4.595.87.509.209.647.2]Through several times of fitting, Table 3 shows the best fitting theoretical model and its parameters for the six heavy metals and metalloid in the semi-variance se-lected. The results show that, for Cr and Zn the Gaussian model may be theoretical model of the semi-variance; the J-Bessel may be for Ni; the Hole Effect model for Cu and Pb; and the Exponential model for As.
The ratios of soil nugget values to the value of base sta-tions for these elements were as follows: Lead > Copper > Arsenic > Zinc > Nickel > Chromium. Lead, copper, and arsenic had ratios of element nugget value to that of base stations, of 92.6014%, 86.6664%, 76.0163%, respe- ctively. The ratios of soil nugget values to those of base stations for other three heavy metals were 25% - 75%. Spacial correlations were controlled by the structural fa- ctors and random factors. Structural factors included su- ch as parent material, soil type, climate, and soil-forming factors, while random factors were farming, management practices, cropping systems, land use patterns, pollution and other human activities.
The optimized model should meet the following crite-ria: the minimized (close to 0) Standard Mean (Mean Standardized), the minimum root mean square prediction error (Root-Mean-Square), the minimized (close to 0) a- verage standard error (Average Standardized Errors), clo-
sest root mean square prediction Error (Root-Mean-Squa- re), closest (to 1) standard root mean square prediction error (Root-Mean-Square-Standardized) [14] (Table 4).
3.4. The Simulated Values and Measured Values of the Cross-Validation
Cross-validation was conducted in the data of all samples. Each time removing one of the points, with the remain-ing points, the value of the predicted value of the point, was compared to the actual value and the predictive va- lue of the difference between the validations of space- interpolation was used to analyze the degree of accuracy, thus the best Kriging analysis was selected. In theory, the best prediction is equal to the actual measured values and the slope between them should be a linear related. As the spatial interpolation in the process of smoothing (smoo- thing) effects, the linear slope between the measured va- lues and predicted values is usually less than 1. For exa- mple, the predicted values of soil Pb and the measured values of the relevant equation are:
Y = 0.71X + 342.779
[image:5.595.54.540.414.527.2]The correlation between measured values and the pre-dictive values of these six heavy metals and metalloid was at significant level (Table 5).
Table 3. Theoretical semivariogram models of soil heavy metals and metalloid and their corresponding parameters.
Element Theoretical model Variable-range Sill Nugget Nugget/sill
Cr Gaussian 9626.5 2.70824 1.8997 0.701452
Ni J-Bessel 1956.2 0.68449 0.48857 0.713772
Cu Hole effect 9626.5 1.45235 1.2587 0.866664
Zn Gaussian 9626.5 3.7619 2.7505 0.731146
As Exponential 9626.5 4.6073 3.5023 0.760163
[image:5.595.53.539.554.663.2]Pb Hole effect 7681.8 0.22207 0.20564 0.926014
Table 4. The interpolation errors of semivariogram corresponding models.
Element Root-Mean-Square Average-Standardized Errors Mean Standardized Root-Mean-Square Standardized
Cr 12.23 13.93 –0.01525 0.8814
Ni 8.995 11.27 0.01924 0.8861
Cu 3 204.3 278.5 –0.02274 0.9998
Zn 2117 3472 –0.1064 1.284
As 36.83 71.32 –0.03516 0.8842
[image:5.595.56.540.692.724.2]Pb 411.1 632.2 –0.02677 1.003
Table 5. The correlation coefficients between measured values and predictive values.
Soil Properties As Cr Cu Zn Ni Pb
Correlation 0.655** 0.368** 0.617** 0.511** 0.626** 0.728**
3.5. The Spatial Distribution of Soil Heavy Metals and Their Patterns
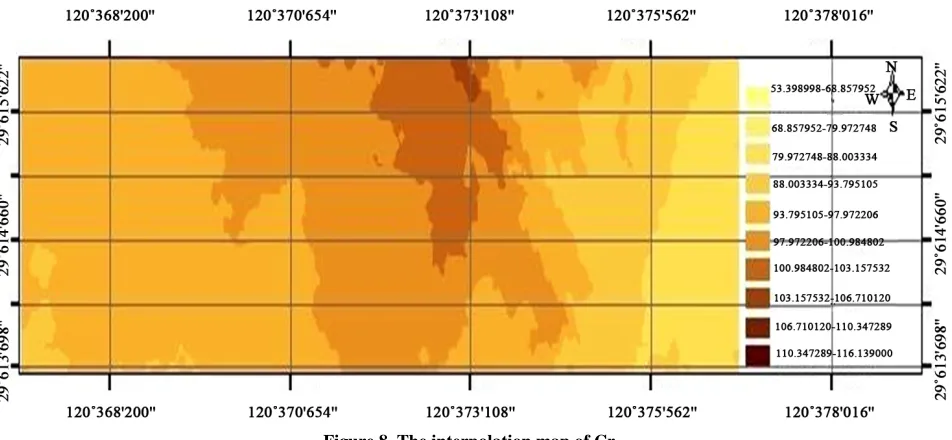
According to the principles of Kriging interpolation and semi-variogram fitting parameters, Geostatistical Analyst in ArcMap software was applied for analyzing module spatial variability of interpolation. Therefore spatial dis-tribution of trends of six heavy metals and metalloid and the distribution of these elements classification map were produced (Figure 3). Kriging interpolation was affected by variation function model simulation accuracy, the dis- tribution of samples, the selection of the number of adja-cent samples and many other factors. Interpolation accu-racy may be reflected through the interpolation error. The smaller the variance, i.e., the standard root mean square prediction error close to 1, the more accurate Kriging in- terpolation [15].
The Kriging interpolation maps for soil copper, zinc,
lead, arsenic, and nickel content were shown in Figures 3-8. The overall distribution trends show a north-south direction with higher values in the center. With decrea- sing from the center of north-south direction the higher values were found in the south than in the north of Grand.
[image:6.595.61.542.307.723.2]According to the Chinese 1995 soil environmental quali- ty standards, the maximum allowable concentration of pollutants were summarized as follows (Figures 3-8). In all regions copper and zinc contents were more than Cla- ss II standard criteria for acidic soils; in northwest, east and south-east part of the region, the lead level was be-tween Class I and Class II threshold criteria, and the rest of area, Pb was beyond the critical value of the standard Class II for acidic soil. In addition, the north-west and eastern parts of the region had arsenic content around the threshold criteria of Class I and the rest areas had As
Figure 3. The interpolation map of Cu.
Figure 5. The interpolation map of Pb.
Figure 6. The interpolation map of As.
Figure 8. The interpolation map of Cr.
beyond the Class II criteria. Northwest, northeast, east and south-east areas had nickel content between the stan- dard critical values of Class I and II for acidic soil with the rest areas exceeding threshold of Class I and Class II.
The overall distribution of chromium in soil showed the trends with highest values in the north, followed by the south and decreasing in the direction of the east-west. In the study area, north and south appeared to have rela-tively high values of chromium. East, south-east and nor- th-east regions with mainly mountainous areas had rela-tively low chromium content. According to the 1995 soil environmental quality standards, the east, southeast and northeast regions had chromium contents below the Class I critical value, while the rest of regions had Cr contents between Class I and Class II criteria for the acidic soil. All soils had Cr concentrations below the standard thre- shold for acidic soil.
4. Conclusions
Heavy metals and metalloid (arsenic, copper, zinc, nickel, and lead) have been significantly accumulated in soils around the 4th trench. Strong correlation among these elements may indicate all these elements came from the same pollution sources [16]. The contamination sources may be from both natural, i.e., geochemical sources, or anthropogenic source, i.e., human activities, or combined pollution sources. The present study showed strong cor-relation between As-Cu, As-Zn, As-Ni, As-Pb, Cu-Zn, Cu-Ni, Cu-Pb, Zn-Ni, Zn-Pb, Ni-Pb, indicating the hig- hly possibility of the same sources of these elements. Ho- wever, correlation between Cr and As, or Cr, Cu, Zn, Ni, and Pb was low, indicating that Cr was less accumulate in the region as well as less possibility of exogenous an-throgenic source. On the other hand, As, Cu, Zn, Ni, Pb
were the elements most associated with pollution source. Ratios of nugget values of heavy metals in soils to ba- se stations were in the order: lead > copper > arsenic > zinc > nickel > chromium. Lead, copper, arsenic had the ratios of nugget values to base stations of 92.6%, 86.6%, and 76.0%, respectively. In accordance with classifica-tion criteria of spatial correlaclassifica-tion of regionalized varia- bles [17], these three elements were specially weakly co- rrelated, because human activity weakened their spatial correlation. The rest heavy metals had 25% - 75% ratios of nugget values to base stations, indicating their moder-ate spatial correlation. Chromium had relatively low ratio of nugget values to base stations and the chromium con-tent in soils of studied area was close to the geometric mean, implying that chromium was mainly affected by soil formation factors.
REFERENCES
[1] J. M. Shu, J. J. Wang and X. C. Liu, “Ecological Restora-tion of Mining Wasted Lands,” China PopulaRestora-tion, Re-source and Environment, Vol. 8, No. 3, 1998, pp. 72-75. [2] M. K. Zhang and Z. X. Ke, “Copper and Zinc Enrichment
in Different Size Fraction of Organic Matter from Pol-luted Soils,” Pedosphere, Vol. 14, No. 1, 2004, pp. 27-36. [3] H. M. Chen, “Heavy Metals Pollution in Soil-Plant
Sys-tem,” Science Press, Beijing, 1996, pp. 1-14.
[4] Y. J. He and L. X. Zhu, “China’s Mineral Resources,” Shanghai Education Press, Shanghai, 1987, pp. 219-220. [5] L. Gao, W. M. Zhang and X. H. Yang, “Studies on the
Issues of Modern Ecology: The Rectification of Nonfer-rous Metals Industrial Environment and the Reclamation of Mine Land,” China Science and Technology Press, Beijing, 1996, pp. 572-582.
[6] C. Tu, C. R. Zheng and H. M. Chen, “The Current Status of Soil-Plant System in Copper Mine Tailings,” Acta Pe-dologica Sinica, Vol. 37, No. 2, 2000, pp. 135-143. [7] Z. M. Gao, “Ecological Research on the Pollution of Soil-
Plant System,” China Science and Technology Press, Beijing, 1986.
[8] Institute of Soil Science, “Analysis of Soil Physical and Chemical Properties,” Shanghai Scientific and Technical Publishers, Shanghai, 1978.
[9] T. M. Burgess and R. Webster, “Optimal Interpolation and Isarithmic Mapping of Soil Properties. I. The Semi- Variogram and Punctual Kriging,” Journal of Soil Science,
Vol. 31, No. 2, 1980, pp. 315-331. doi:10.1111/j.1365-2389.1980.tb02084.x
[10] P. Goovaerts “Geostatistics in Soil Science: State-of-the- Art and Perspectives,” Geodema, Vol. 89, No. 1-2, 1999, pp. 1-45. doi:10.1016/S0016-7061(98)00078-0
[11] H. C. Guo, “Land Restoration in China,” Acta Ecologica Sinica, Vol. 10, No. 1, 1990, pp. 24-26.
[12] C. S. Zhang, S. Zhang and J. B. He, “Spatial Distribution Characteristics of Heavy Metals in the Sediments of Yang-tze River System-Geostatistics Method,” Acta Geogra- phica Sinica, Vol. 52, No. 2, 1997, pp.185-192.
[13] S. Q. Wang, S. L. Zhu and C. H. Zhou, “Characteristics of Spatial Variability of Soil Thickness in China,” Geo-graphical Research, Vol. 20, No. 2, 2001, pp. 161-169. [14] H. B. Li, Z. H. Lin and S. X. Liu, “Application of Kriging
Technique in Estimating Soil Moisture in China,” Geo-graphical Research, Vol. 20, No. 4, 2001, pp. 446-452. [15] G. A. Tang and X. Yang, “ArcGIS Spatial Analysis
Ex-periment Guide,” Science Press, Beijing, 2006, p. 405. [16] F. A. Galley and O. L. Lioyd, “Grass and Surface Soils as
Monitors of Atmospheric Metal Pollution in Central Scotland,” Water, Air and Soil Pollution, Vol. 24, 1985, pp. 1-18.
[17] C. A. Cambardella, T. B. Moorman, J. M. Novak, et al., “Field-Scale Variability of Soil Properties in Central Iowa Soils,” Soil Science Society of America Journal, Vol. 58, No. 5, 1994, pp. 1501-1511.