Determinants in Human Gait Recognition
Tahir Amin*, Dimitrios Hatzinakos
Department of Electrical and Computer Engineering, University of Toronto, Toronto, Canada Email: *{tamin, dimitris}@comm.utoronto.ca
Received December 29,2011; revised January 31, 2012; accepted February 20,2012
ABSTRACT
Human gait is a complex phenomenon involving the motion of various parts of the body simultaneously in a 3 dimen-sional space. Dynamics of different parts of the body translate its center of gravity from one point to another in the most efficient way. Body dynamics as well as static parameters of different body parts contribute to gait recognition. Studies have been performed to assess the discriminatory power of static and dynamic features. The current research literature, however, lacks the work on the comparative significance of dynamic features from different parts of the body. This pa-per sheds some light on the recognition pa-performance of dynamic features extracted from different parts of human body in an appearance based set up.
Keywords: Biometrics; Feature Comparison; Feature Extraction; Gait Recognition
1. Introduction
The recognition of people by their physiological or beha- vioral characteristics is called biometrics. The use of bio- metrics in personal identification is not new and it has been used in criminology for a long time. Fingerprint databases are widely used by the law enforcement agencies from the early 19th century. Biometrics such as artistic drawings of facial features, color of eyes and footprints were routinely used in criminology even before the advent of modern technology. The invention of modern com- puters and digital technology have, however, transformed the way information is stored and processed. Digital technology has enabled us to store and process biometric data automatically without intervention or with our minimal input. The renewed focus on security in the past few years has brought the biometrics research into limelight. Recent developments in the biometric research have brought face, iris and fingerprint recognition from re- search labs to daily life. Biometric recognition systems are being installed as access control systems for granting access to offices, residential buildings and even laptop computers.
Gait is a behavioral biometric which can be perceived from a distance. It can be acquired without personal con- tact and cooperation. Iris and face biometrics have simi- lar advantages but they need high resolution images and frontal view. However, it is possible to extract gait pat- terns from low resolution images. Human gait can vary over long durations due to many factors such as change
in body weight, injuries and disease. However studies have indicated that it still possesses sufficient discrimi- natory power for personal recognition [1]. Gait is a com- plex function of skeletal structure, muscular activity, body weight, limb lengths, bone structures etc. This com- plexity of gait renders it difficult to imitate and hide if not impossible.
Human gait analysis can be used as a useful tool in a variety of applications. One such promising application is medical diagnostics of diseases that affect voluntary muscle activity such as walking. For example, Parkin-son’s disease that affects nerve cells in part of the brain controlling muscle movements. People with Parkinson's often experience trembling, muscle rigidity, difficulty in walking, and problems with balance and coordination. Early detection of walking disorders by motion analysis can be very helpful for the treatment of such diseases. Gait can also be used to generate early warning for law enforcement agencies by detecting suspicious motion activity in airports or subway stations.
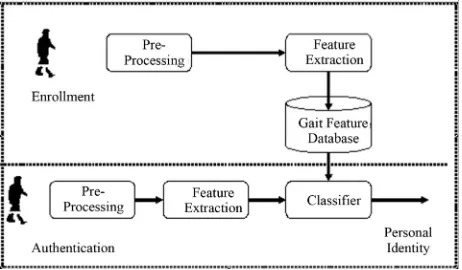
based approaches. The majority of techniques use man-ual initialization of the model in the first frame with fixed lengths of body segments. There are no such initia- lization issues in appearance based methods. However, the appearance based method being holistic in nature can suffer from lack of correspondence between extracted gait signatures to the actual physical quantities. Figure 1 shows the block diagram of a generic gait identification system.
The most critical step in gait recognition system is the extraction of gait features from video data. Human gait is cyclic in nature and this characteristic exhibits itself in cyclic appearance changes in the images when taken from a side view. Although gait is a dynamic process, studies have shown that static body parameters such as length and widths of limbs are also important in gait recognition. In appearance based methods, dynamics of lower half of the body are generally considered more important. Studies have been performed on the relative importance of static and dynamic features in gait recog-nition. But there is a lack of work in relative analysis of dynamic features from different parts of the body espe-cially in an appearance based set up. Dynamics of dif-ferent parts of the human body play a role in characteriz-ing the human gait pattern. This paper analyzes the dis-criminatory power of features extracted from different parts of the body by applying area masks.
The rest of the paper is organized as follows. Section 2 gives a brief overview of the previous works in gait fea-ture comparative analysis. In Section 3, we discuss pre-processing of silhouettes and provide details of dynamic feature extraction. Experimental results and discussion are given in Section 4. Section 5 draws conclusions with some directions to the future work. References are listed in Section 6.
2. Previous Works
[image:2.595.57.288.585.720.2]We will briefly review the previous works on determina-tion of characteristics that contribute to gait recognidetermina-tion and their relative importance. As mentioned earlier in the
Figure 1. Block diagram of the gait recognition system.
preceding section, the current research literature lacks the comparative analysis of dynamic features extracted from different parts of the body. The comparison between static and dynamic features has, however, been studied in some of the works which will be summarized below.
Human locomotion has been widely studied by medi-cal and physiologimedi-cal research community. Their main purpose is to determine the gait variations and distinguish between normal and pathological gait and rehabilitation of patients. Saunders et al. have defined human walking as the translation of the center of mass of the body from one point to another in a way that requires the least energy [2]. They also identified six gait determinants or vari-ables that affect the energy expenditure. The six gait de- terminants are pelvic rotation, pelvic tilt, knee flexion at mid-stance, foot and ankle motion, knee motion and lateral pelvic displacement. The focus of this work as well as other similar ones was to study the movement of different muscles and limbs during the gait process. These types of studies are useful for detecting abnormalities in human walking and may also serve as a general guideline for recognition systems. The perception of human gait as well as its recognition involves much more than just the six determinants given in [2].
the method is able to achieve a very compact representa-tion of human gait (4-dimensional), its performance is low for lower rank recognition.
Veeraraghavan et al. [8] conducted a detailed com-parison between shape and kinematic features for human recognition. Their experiments indicated that shape of the body carries more information than the kinematics for recognition of humans from video sequences. How-ever, using kinematics in conjunction with shape features considerably improved the performance of the system. Similarly, gait analysis work carried out by R. Green and L. Guan also showed that anthropometric (static) features extracted by them were more discriminatory for human identification than the dynamic features in the shape of joint angle trajectories [9]. On the other hand, the exper- iments conducted by Johansson establish the importance of dynamic features for identification [1]. Contradicting results have been reported about the importance of dy-namic and static features while dydy-namic feature com-parison has not been performed explicitly. This work is poised to shed some light on the dynamic feature perfor- mance extracted from different parts of the binary sil-houettes.
3. Extraction of Body Dynamics
In appearance based gait recognition systems, the first step usually involves segmentation of human subject from the background. This segmentation process is usu-ally performed by background subtraction. The resulted silhouettes are noisy because of segmentation errors. We observe that silhouettes in the database contain outliers which should be removed to make the gait feature ex-traction more robust. We use median filtering with a mask of 5 × 5 to filter the silhouettes to get rid of outliers. The output from the median filter is binarized by simple thresholding to obtain smoothed silhouettes.
Human walking process is cyclic in nature. Gait cycle is the time between two identical events during human walking. It is usually measured from heel strike to heel strike of one leg. A complete gait cycle is shown in Fig-ure 2.
[image:3.595.363.484.550.724.2]The movement of arms and legs is the most prominent motion during gait cycle. Assuming that image plane is perpendicular to the direction of motion, the gap between
Figure 2. Human gait cycle.
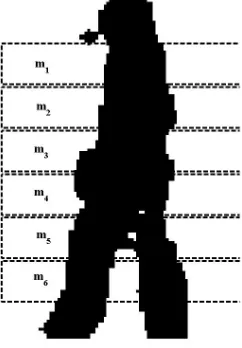
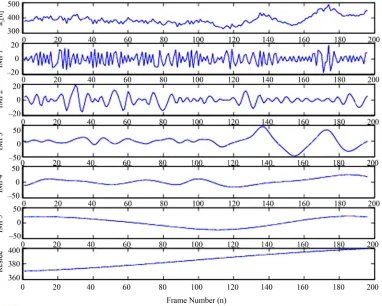
two legs in 2D silhouettes changes during gait cycle. Similarly the gap between two arms and the rest of the body also changes in a cyclic fashion. This dynamic in-formation can be captured by applying area masks at different parts of the binary silhouettes similar to the ap-proach adopted by Foster et al. [10]. The number of pix-els of the binary silhouettes under these masks is calcu-lated. The process is repeated for each binary silhouette in the gait sequence and we obtain six area signals of length N, the number of frames in the gait sequence. The width of each area mask is 15 pixels. Figure 3 shows the location of six area masks for an example silhouette from the database.
The following equations summarize the extraction of six area signals from the masks shown in Figure 3.
1 if pixel [ , ] belongs to foreground [ , ] =
0 if pixel [ , ] belongs to background
i j b i j
i j
, = 1 for < 0 otherwise(1)
p p
p
L i L m i j
(2)
,
= , ,
p n p
i j
a n
b i j m i j (3)where b[i, j] is the binary silhouette, mp[i, j] is the area
mask and ap(n) is the area under mask p for frame n of
the silhouette sequence. Lpis the starting row for mask
mpand p = [1, ···,6] is the mask index. These area
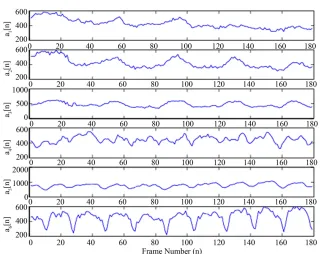
sig-nals are shown in Figures4 and 5 for two typical silhou-ette sequences from the database.
[image:3.595.60.284.630.735.2]The area signals extracted by applying the area masks are noisy due to the imperfections in the silhouette ex-traction process. It is observed that a high frequency rid-ing wave is present in all of the area signals. We apply a newly proposed Empirical Mode Decomposition (EMD) algorithm to remove these riding waves to get cleaner area signals. EMD algorithm is described in the follow-ing subsection.
Figure 4. Area signals for a silhouette sequence.
Figure 5. Area signals for another silhouette sequence.
3.1. Empirical Mode Decomposition (EMD) cases, non linear and non stationary data can be trans-formed to linear and stationarity data before processing it with Fourier based methods. But in other cases new methods are needed which can analyze non linear and non stationary data. There has been some progress in the analysis of non stationary data in recent years. Wavelet analysis and Wagner-Ville distribution are the examples of data analysis tools for non stationary data. Huang et al.
[image:4.595.136.456.352.606.2]proposed EMD to decompose non linear non stationary data into oscillatory modes called Intrinsic Mode Func-tions (IMF) [12]. The method separates IMFs from sig-nals modulated in both amplitude and frequency. IMF is a function that satisfies two conditions:
The number of extrema and the number of zero cross- ings are either equal or at most differ by one.
The mean value of the envelope traced by the local maxima and the envelope defined by the local minima is zero.
IMFs are extracted by the sifting process which is ap-plied iteratively until a predefined condition is satisfied or the residue becomes a monotonic function. The signal
can be then represented in the following form:
x(t)
=1
( ) = k i k
i
a t
e re r
(4)
where i denotes the ith extracted empirical mode and
k is the residue which is either a constant or mean trend.
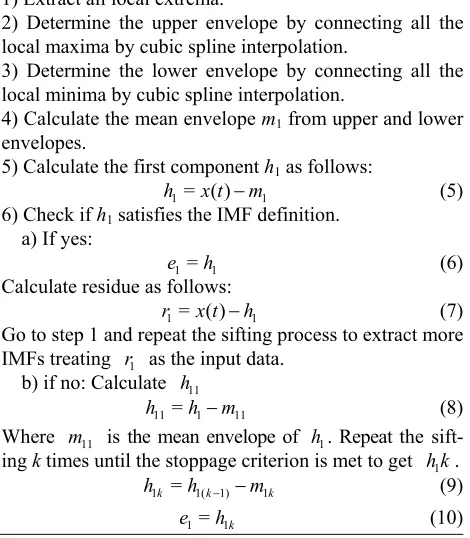
The sifting procedure to obtain the IMF is summarized in 6 steps as given in Algorithm 1.
Algorithm 1: EMD Algorithm 1) Extract all local extrema.
2) Determine the upper envelope by connecting all the local maxima by cubic spline interpolation.
3) Determine the lower envelope by connecting all the local minima by cubic spline interpolation.
4) Calculate the mean envelope m1 from upper and lower
envelopes.
5) Calculate the first component h1 as follows:
1 1
6) Check if h1 satisfies the IMF definition.
= ( )
h x t m
=
e h
= ( )
r x t h
r
11
h
11= 11
h h m
m h
h k
1k = 1(k1) 1k
h h m
1= 1k
e h
(5)
a) If yes:
1 1
Calculate residue as follows:
(6)
1 1
Go to step 1 and repeat the sifting process to extract more IMFs treating as the input data.
(7)
1
b) if no: Calculate
1 (8)
Where 11 is the mean envelope of 1. Repeat the sift-ing k times until the stoppage criterion is met to get 1 . (9) (10)
In order to illustrate the noise removal by EMD, we chose two area signals from Figures 4 and 5 and de-composed them using the EMD algorithm. The input sig- nals are plotted in Figure 6 and their IMFs in Figures7 and 8.
The high frequency noise appears as the first IMF, as shown in Figures7 and 8. The area signals are
1
IMF
1
IMF
5
1
=2
= i k
i
a n
e n r n
5
2
=2
= i k
i
a n
e n r nreconstructed by ignoring as given in the follow-ing equations.
(11)
(12)
The reconstructed signals are shown in Figure 9.
3.2. Correlation Analysis
After the noise removal from area signals by EMD algo-rithm, we compute autocorrelation of all six recon-structed area functions as follows:
=
ap p p
n
R l
a n a n l (13)where '
p
a
R represents the autocorrelation function of
the reconstructed area signal ap
'
and l is the time lag.
p
a
R l= [1.. ]N
'
is only calculated for positive lags i.e. .
The dynamic gait features are then derived by taking the Discrete Cosine Transform (DCT) of the autocorrelation functions. The DCT of a discrete function
p a R
is de-fined as: 1 =0π 2 1
= cos 2 N p ap l l k
T k c k R l
N
(14)
p
T k is the DCT transform of the original signal where
a p
R l c k
of length N. The coefficient is given by:
1 2
0 = , =
c c k
N N
1 k M 1
(15)
[image:5.595.56.291.371.640.2] . for
Figure 7. Input signal a1 and its IMFs.
Figure 9. Area signals after noise removal.
4. Experimental Results
4.1. Database DescriptionWe use the May 2001 version of Gait Challenge (GC) database from University of Southern Florida (USF) [12]. This database consists of 452 sequences from 71 subjects recorded under the following 5 covariates.
shoe type, A or B
surface type, Grass (G) or Concrete (C)
carrying conditions, with Briefcase (BF) or without (NB)
viewpoints, Left (L) or Right (R)
time instants, t1 or t2
In order to assess the performance of gait recognition algorithms, the GC database also contains Human ID Challenge Experiments. There are total 11 experiments. We use experiment A (G, A, L, NB, t1) to analyze the
recognition potential of dynamic features extracted from different parts of the silhouettes. Experiment A is chosen due to the following reasons:
Both Gallery (G, A, R, NB, t1) and A set contain all
the 71 subjects
They are recorded under similar conditions except a different viewpoint. This eliminates the effect of other covariates which can skew the results.
4.2. Gait Features
Each silhouettes sequence is processed frame by frame for the extraction of dynamic gait features. The silhouette frames are processed by median filtering to reduce out-liers. Next, we estimate the gait period from the autocor-relation function of the silhouette area signal. Speed normalization is achieved by ensuring the same number of frames in each gait cycle for all silhouette sequences. The six area signals are then extracted as explained in the preceding section and EMD algorithm is applied to reduce
the noise. DCT coefficients of autocorrelation functions of each of the six reconstructed area signals are com-puted. The first 35 DCT coefficients form our dynamic gait feature.
4.3. Feature Vector Normalization
We normalize the gait features by using Equation 16 to put equal emphasis on each component of the feature vector. Each of the components of 35-dimensional feature vector takes on different value for each silhouette se-quence. These different values of each component form a sequence of numbers. We consider that these sequences are being generated by a Gaussian distribution. Mean μν and standard deviation ν of each such sequence rep-resenting a component of the gait signature v are calcu-lated and then the sequence is normalized as follows:
σ
= i ν
i
ν
ν μ
ν σ
(16)
This normalization process maps most of the values of the feature components v in the range [–1, 1]. The ad-vantage of this normalization is that a few abnormal val-ues occurring in the sequence will not bias the impor-tance of other values.
4.4. Feature Matching
Features are matched by nearest neighborhood using the simple City block distance. The City block distance be-tween the two gait feature vectors is defined as:
=1 , = P i i
i
d p g
p ga
(17)
where p and g are the feature vectors of probe and gal-lery sequences respectively and p is the dimension of the signature vector.
4.5. Comparison of Dynamic Features
Cumulative Match Score (CMS) is used to evaluate the performance of different dynamic gait features. Each probe sequence feature is compared with the features of 71 sequences in the gallery. The gallery set consists of one sequence for each subject. The gallery sequence set is sorted according to the similarity to the probe se-quences. The rank1 identification result is the total num-ber of correct matches appearing on the top while Rank 5 value represents the correct identification obtained among the top 5 matches.
Table 1 presents the performance evaluation of fea-tures extracted from the six area signals at Rank 1 and Rank 5. At Rank 1, the best performance of 97.18% is achieved from the features extracted from 6. This area
Table 1. Comparison of features at rank 1 and rank 5.
Area Signal Rank 1 Rank 5
(%) (%)
a1 53.52 94.37
a2 53.52 92.96
a3 78.87 100
a4 73.24 98.59
a5 73.24 98.59
a6 97.18 100
gait motion. The second most significant results of 78.87% are achieved from 3 which represents the lower arm
dynamics. We achieve a recognition performance of 73.24% for both 4 and 5 features. Similarly, rank 1
recognition performance of 1 and 2 features is also
the same at 53.52%. Rank 1 results indicate that thigh movement and knee movement is of equal importance in gait recognition. However, the performance of thigh and knee features is slightly lower than the features extracted from the lower arm dynamics.
a
a a
a a
a a
a
a a2
a a
Similar result pattern is obtained at rank 5. 6 and 3 features provide the best recognition performance of
100%. The recognition rate of 4 and 5 is slightly
lower at 98.59%. The lowest performance of 92.96% is obtained from a2 features. The recognition
perform-ance of 1 features is slightly higher than feature
set at 94.37%.
[image:8.595.58.285.101.215.2]a
Figure 10 shows the CMC plot for DCT features of six area signals. The recognition performance of the dy-namic features extracted from 3 and 6 is superior to the other feature sets. These results partially support the traditional notion of significance of leg dynamics in gait recognition. It is also observed that the dynamics of the lower arm is very important in determining the gait pat-tern of the human subjects in an appearance based setup.
5. Conclusion
Human locomotion is a complex phenomenon involving the coordination of different limbs as the body translates from one point to another. The static configuration of the body such as the widths and lengths of different limbs have been shown of great importance in determining the gait pattern of the individuals. The contribution of dy-namics of different parts of human body has not been studied explicitly in an appearance based recognition set up. In this paper, we have analyzed the recognition per-formance of dynamic features from different parts of the body. It is shown by experimental evaluation that dy-namics of lower leg and lower arm are of utmost impor-tance for building an efficient gait recognition system. The motion of lower half of the body has always been considered more important in the determination of gait pat-
Figure 10. CMC for six area features.
tern. However, we have found that lower arm movement also plays an important role in gait recognition. The re-sults from the present work can be used for building a better feature selection process for a more robust recog-nition system. Lower leg is usually very noisy in the ex-tracted silhouettes because of shadows and walking sur-face issues. A set of better discriminatory features may be extracted from lower arm motion avoiding noisy data from lower leg.
REFERENCES
[1] G. Johansson, “Visual Perception of Biological Motion and a Model for Its Analysis,” Attention, Perception, & Psychophysics, Vol. 14, No. 2, 1973, pp. 210-211. doi:10.3758/BF03212378
[2] J. B. dec. M. Saunders, V. T. Inman and H. D. Eberhart, “The Major Determinants in Normal and Pathological Gait,” The Journal of Bone and Joint Surgery, Vol. 35-A, No. 3, 1953, pp. 543-558.
[3] L. Wang, H. Z. Ning, T. N. Tan and W. M. Hu, “Fusion of Static and Dynamic Body Biometrics for Gait Recog-nition,” IEEE Transactions on Circuits and Systems for Video Technology, Vol. 14, No. 2, 2004, pp. 149-158. doi:10.1109/TCSVT.2003.821972
[4] L. Wang, H. Z. Ning, T. N. Tan and W. M. Hu, “Fusion of Static and Dynamic Body Biometrics for Gait Recog-nition,” Proceedings of the 9th IEEE International Con-ference on Computer Vision (ICCV 03), Nice, 13-16 Oc-tober 2003, pp. 1449-1454.
doi:10.1109/ICCV.2003.1238660
[5] C. BenAbdelkader, R. Cutler and L. Davis, “Person Iden-tification Using Automatic Height and Stride Estimation,” Proceedings of the IEEE 16th International Conference on Pattern Recognition, Quebec, 11-15 August 2002, pp. 377-380. doi:10.1109/ICPR.2002.1047474
2001 IEEE Computer Society Conference on Computer Vision and Pattern Recognition, Kauai, 8-14 December 2001, pp. 423-430. doi:10.1109/CVPR.2001.990506 [7] “Georgia Tech GVU Center/College of Computing—
Human Identification at a Distance,” 2011. http://www.cc.gatech.edu/cpl/projects/hid
[8] A. Veeraraghavan, A. K. Roy-Chowdhury and R. Chel-lappa, “Matching Shape Sequences in Video with Appli-cations in Human Movement Analysis,” IEEE Transac-tions on Pattern Analysis and Machine Intelligence, Vol. 27, No. 12, 2005, pp. 1896-1909.
doi:10.1109/TPAMI.2005.246
[9] R. D. Green and L. Guan, “Quantifying and Recognizing Human Movement Patterns from Monocular Video Im-ages-Part II: Applications to Biometrics,” IEEE Transac-tions on Circuits Systems for Video Technology, Vol. 14, No. 2, 2004, pp. 191-198.
doi:10.1109/TCSVT.2003.821977
[10] J. P. Foster, M. S. Nixon and A. Prügel-Bennett , “Auto-matic Gait Recognition Using Area-Based Metric,” Pat-tern Recognition Letters, Vol. 24, No. 14, 2003, pp. 2489- 2497. doi:10.1016/S0167-8655(03)00094-1
[11] N. E. Huang, Z. Shen, S. R. Long, M. C. Wu, H. H. Shih, Q. Zheng, N. C. Yen, C. C. Tung and H. H. Liu, “The Empirical Mode Decomposition and the Hilbert Spec-trumfor Nonlinear and Non-Stationary Time Series Ana- lysis,” Proceedings of the Royal Society of London A, Vol. 454, No. 1971, 1998, pp. 903-995.
[12] S. Sarkar, P. J. Phillips, Z. Y. Liu, I. R. Vega, P. Grother and K. W. Bowyer, “The HumanID Gait Challenge Prob-lem: Data Sets, Performance, and Analysis,” IEEE Tran- sactions on Pattern Analysis and Machine Intelligence, Vol. 27, No. 2, 2005, pp. 162-177.